Pullback Reaches Critical Support
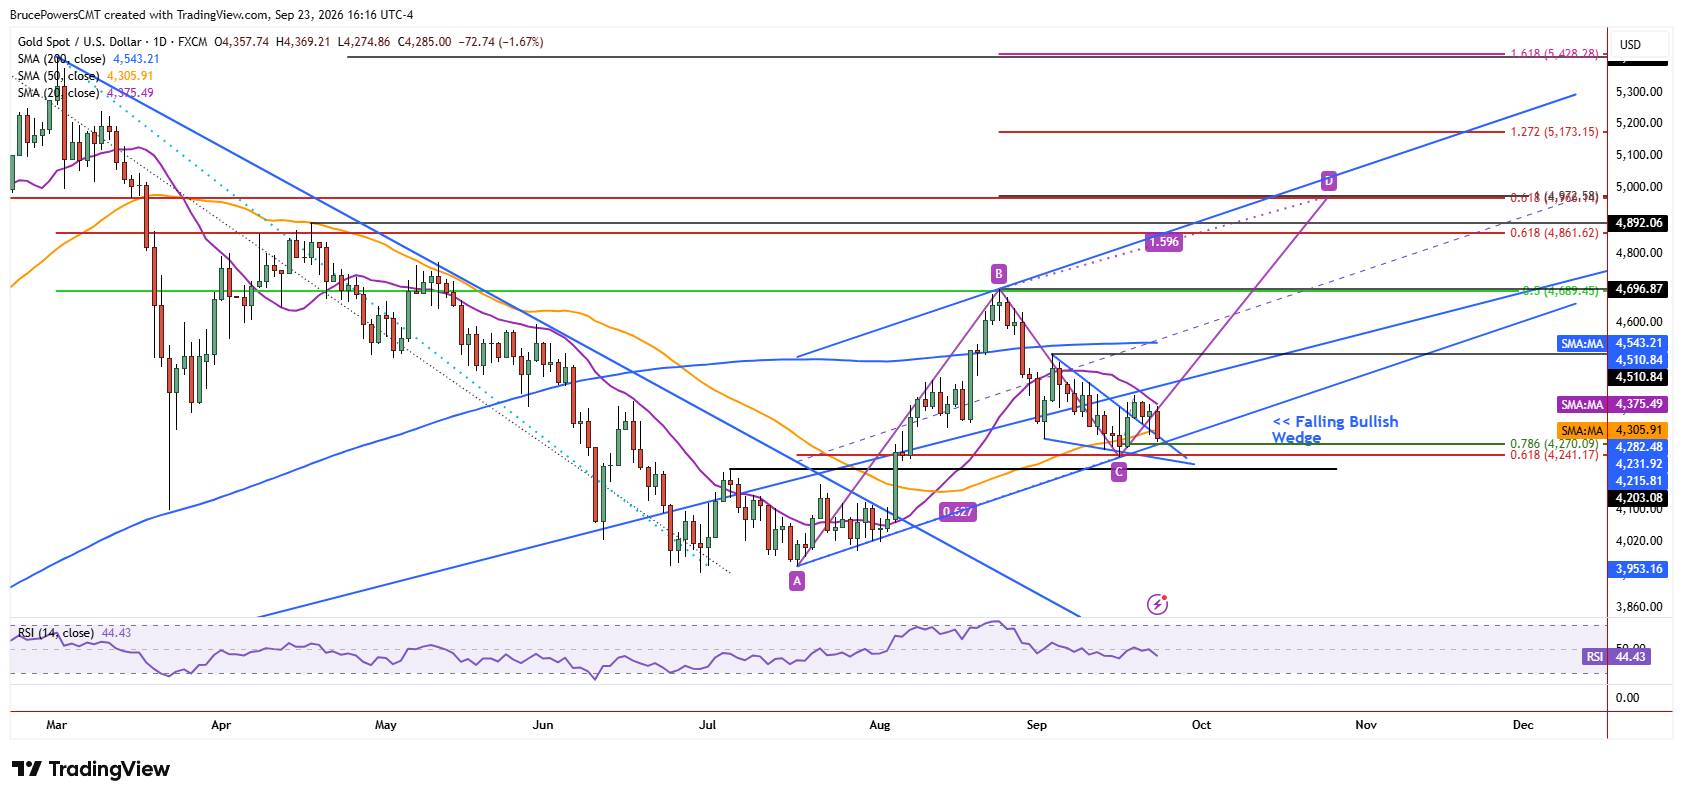
Gold continued to weaken into lower support levels on Wednesday, reaching a lower daily low of $4,275. The metal is set to end the session near the session lows, as it continues to trade in that area at the time of writing. Wednesday’s decline broke below the 50-day moving average, which was recently tested as support after being reclaimed last Thursday. This is short-term bearish behavior that came close to completing a 78.6% Fibonacci retracement of the prior short-term upswing at $4,270 and tested support near the downtrend line and a rising trendline.

$4,270 Becomes Key Near-Term Level
Therefore, that Fibonacci level presents a key near-term level. A decisive decline below it will also trigger a break below the uptrend line and further confirm the failure of support at both the 50-day moving average and downtrend line. For now, the expectation for an eventual resolution to the upside remains unless support fails to hold at the 78.6% Fibonacci retracement zone.
$4,369 Offers First Sign of Strength
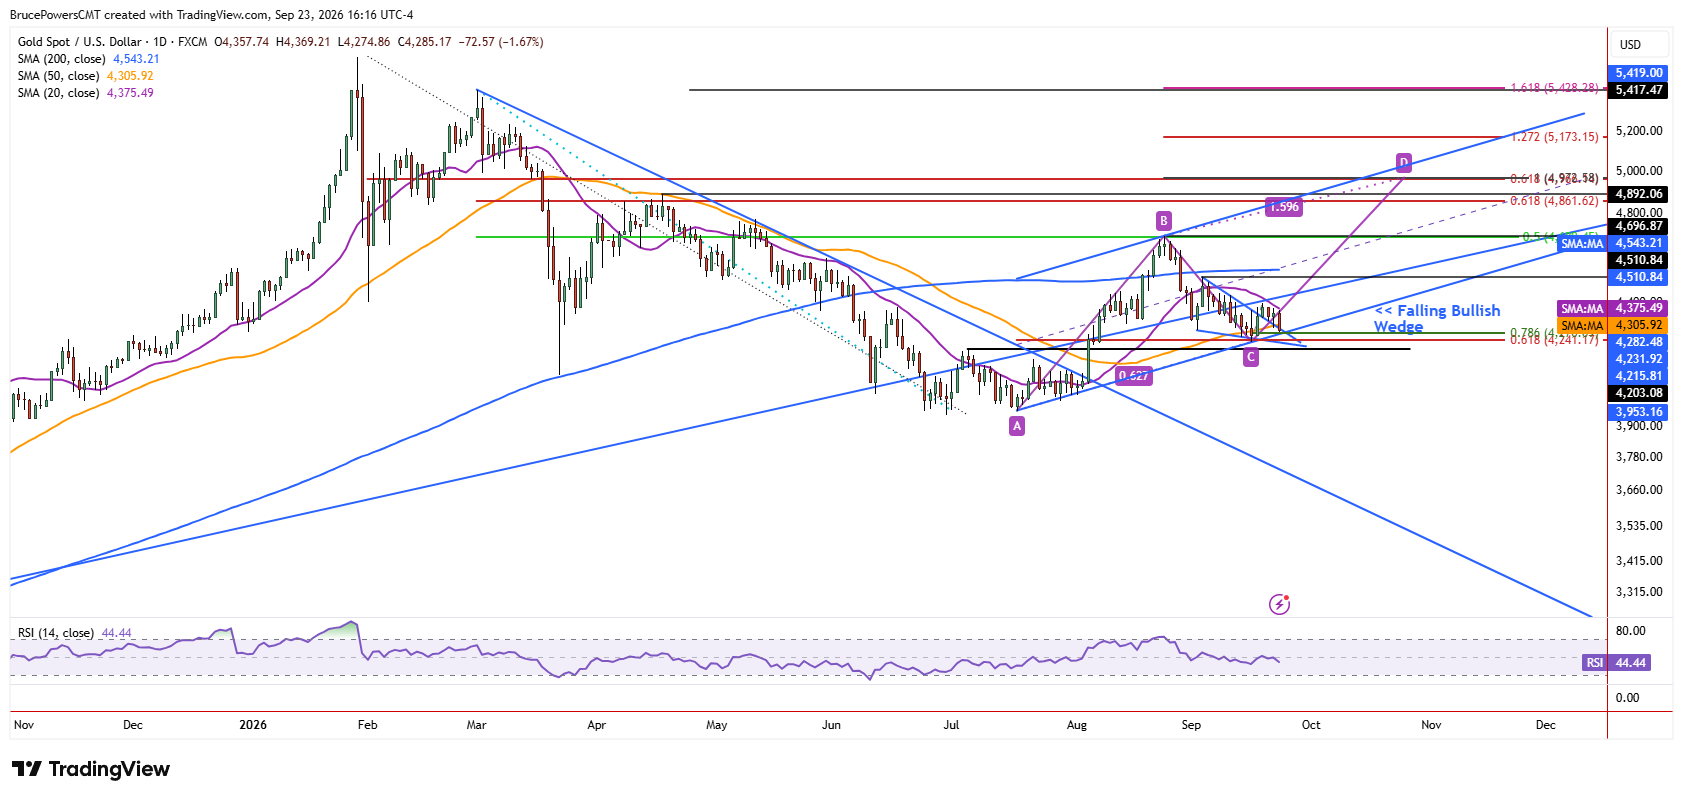
A decisive advance above Wednesday’s high of $4,369 would be the next sign of strength on the daily timeframe, especially since the 20-day moving average has confirmed resistance this week near the highs of each day. Consequently, a breakout above Wednesday’s high may quickly reclaim the 20-day moving average and add to the potential for the completion of the short-term pullback.
Falling-Wedge Breakout Keeps Bulls Engaged
The larger pattern unfolding remains a bullish breakout from a falling wedge pattern that triggered on Friday with a rally above the top boundary line of the pattern. Strength was seen following the establishment of strong support at the confluence of several indicators. This suggested that the recent bearish correction may have completed with a higher swing low of $4,235 that was generated last week.
$4,400 Breakout Opens $4,511 Target
If gold is able to rise above last week’s high of $4,400, a bullish continuation signal will be generated. The next upside target would then be the initial target derived from the wedge pattern at $4,511.
Gold Price Forecast
Every new Gold analysis as it publishes, today's technical signal and key levels, live price — on one page.
See all Gold forecastsIf you’d like to know more about how to trade gold and silver, please visit our educational area.