S&P 500 Drops as 10-Year Yield Runs Above 5%
The rate trade came back hard Wednesday afternoon. Hot PMI readings pushed Treasury yields higher. Crude recovered. The Nasdaq Composite Index gave back more of Tuesday’s record move. The S&P 500 Index broke lower with it. The 10-year yield went through 5.041% and kept going to 5.129%. That is the number stocks had been trying to avoid all month.
At 17:09 GMT, the S&P 500 Index is trading 7,700.42, down 64.22 points or 0.83%. The session high is 7,761.94 and the low is 7,694.89. The Nasdaq Composite Index is down 1.2%. The Dow Jones Industrial Average is lower by about 0.6%.

The PMI Reports Repriced the October Rate Trade
October rate-hike odds jumped above 73% Wednesday from 55.4% a day earlier. A month ago that number was 8.8%. The PMI data gave the rate market the push. The numbers showed services inflation holding and demand strong enough to keep price pressure alive outside of oil.
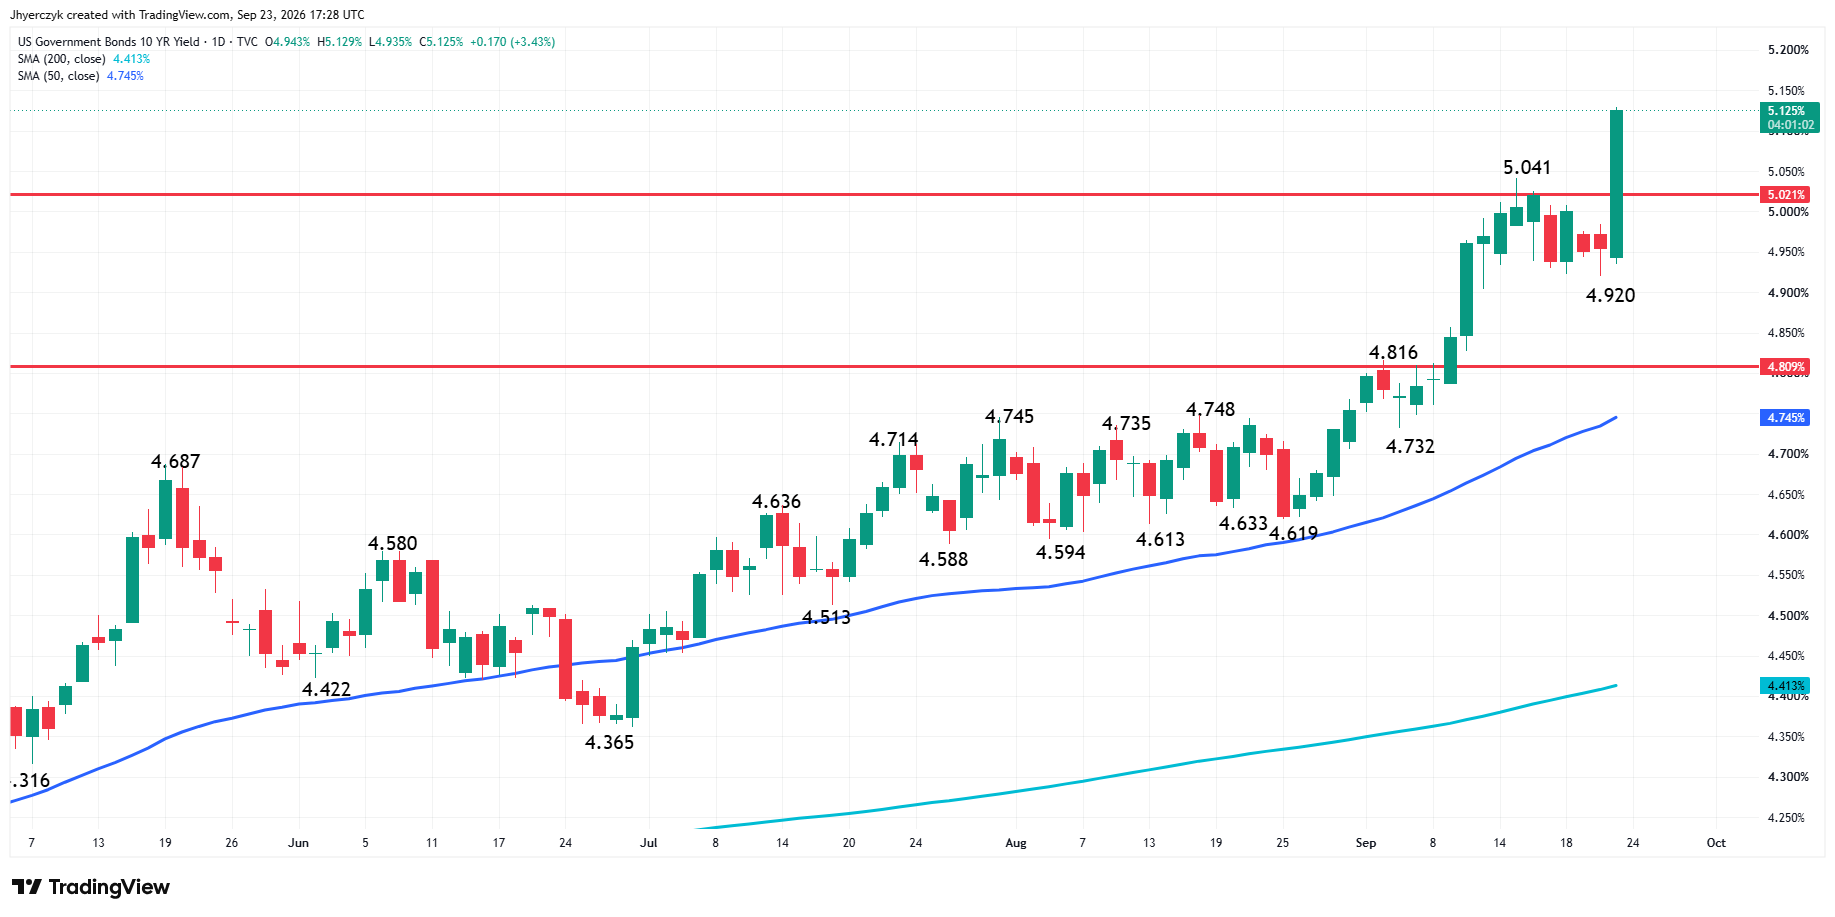
Tuesday’s stock rally was still trading the idea that lower crude and softer yields could give technology another run. Wednesday’s data took that trade apart. The 10-year yield reached 5.129% after trading through last week’s 5.041% high and was trading near 5.125%, up 0.170 percentage points on the day. The 50-day moving average on the 10-year is 4.745%. The yield is running away from it.
The two-year moved higher alongside the 10-year. Both ends of the curve repricing at the same time tells the stock market this is not a long-bond story. Growth stocks ran to a record Tuesday on falling yields. Wednesday reversed both the yields and the trade.
Crude Recovered and Added to the Inflation Problem
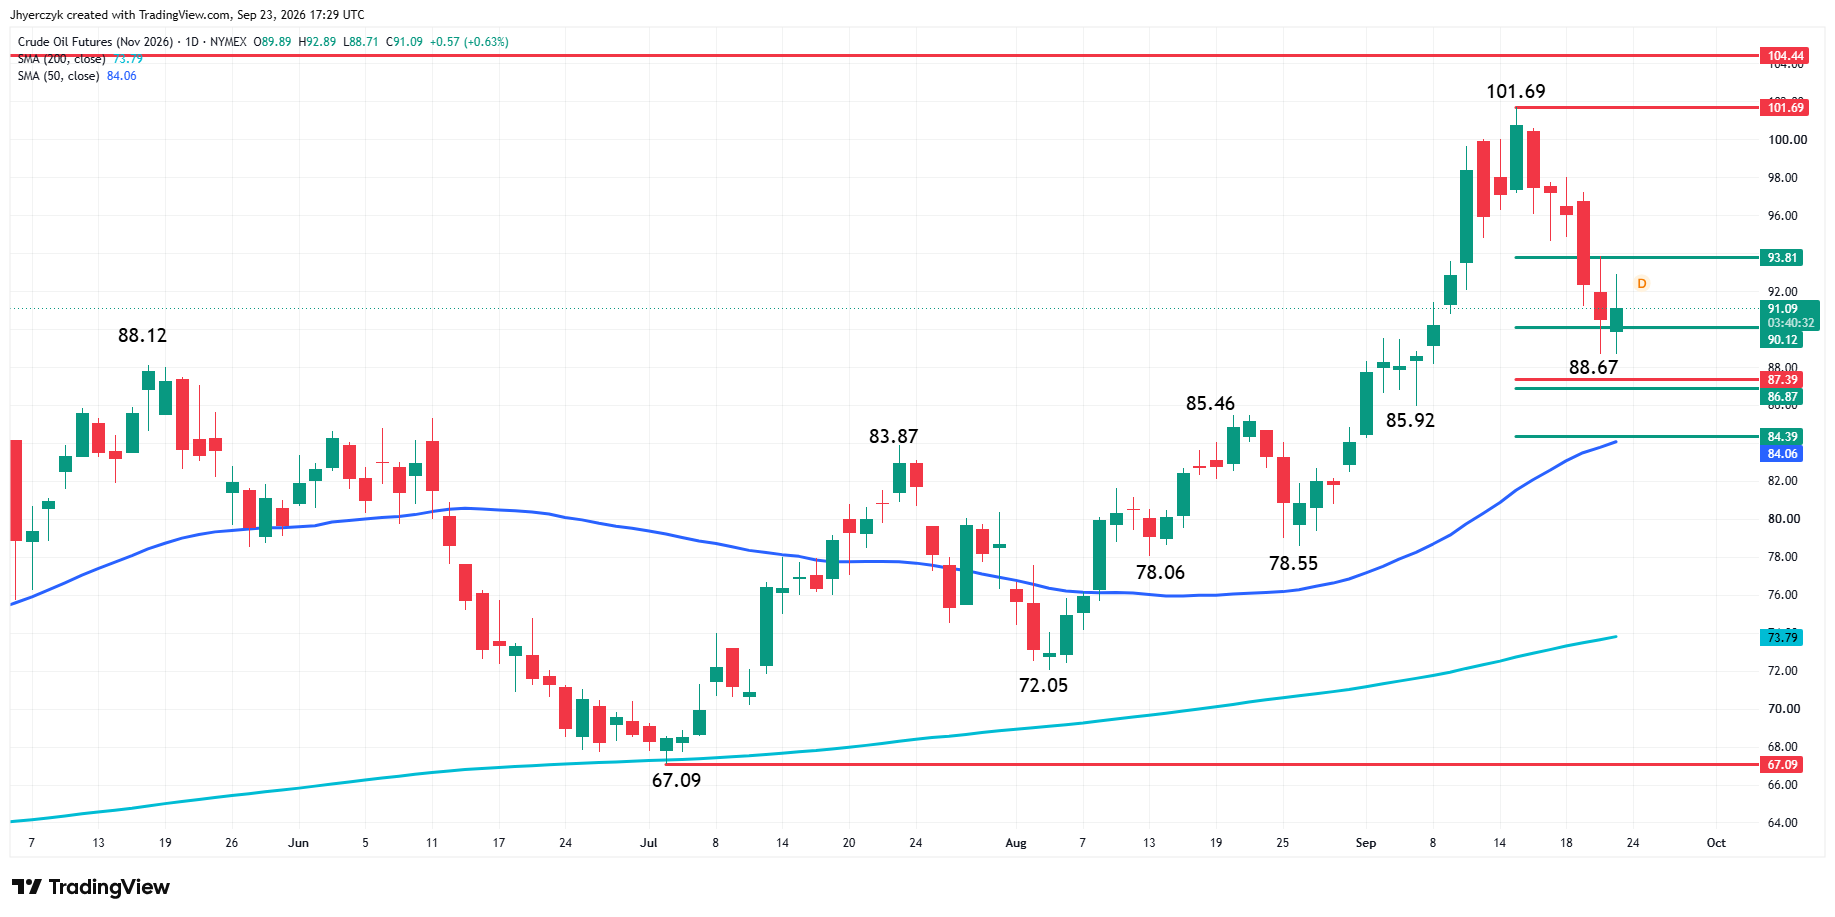
November WTI crude oil futures reached $92.89 Wednesday and are trading near $91.09, up $0.57 or 0.63%. The rally fell short of the $93.81 short-term 50% level. Crude did not have to recover all of Tuesday’s break to complicate the stock market.
Dow Jones Price Forecast
Every new Dow Jones analysis as it publishes, today's technical signal and key levels, live price — on one page.
See all Dow Jones forecastsThe PMI data made the inflation story broader than oil. Higher crude on top of hot services data is what pushed the 10-year through 5%. Utilities, consumer discretionary, and communication services are the weakest sectors. Utilities trade against yields. Consumer names feel higher borrowing costs and fuel prices. The communication services sector carries the technology valuation trade. The sector board lined up with the rate move and the crude recovery together.
Stocks in the News
McDonald’s dropped more than 5% after warning that inflation and flat traffic are still weighing on the restaurant business. Royal Caribbean fell nearly 3% after announcing a $3 billion deal for a 50% stake in the parent of Sandals and Beaches Resorts.
Alibaba dropped about 4% after a four-day rally as traders took profits. Paychex fell nearly 7% after revenue in its Management Solutions business missed. Immunovant was down about 9% on disappointing trial results.
Worthington Enterprises held gains after earnings and data-center liquid-cooling demand. IonQ held after its quantum error-decoder announcement. Cracker Barrel was higher on a better-than-expected quarter.
The selective buying shows that money is still moving into individual stories while index traders reduce exposure to the rate trade.
Daily S&P 500 Technical Analysis
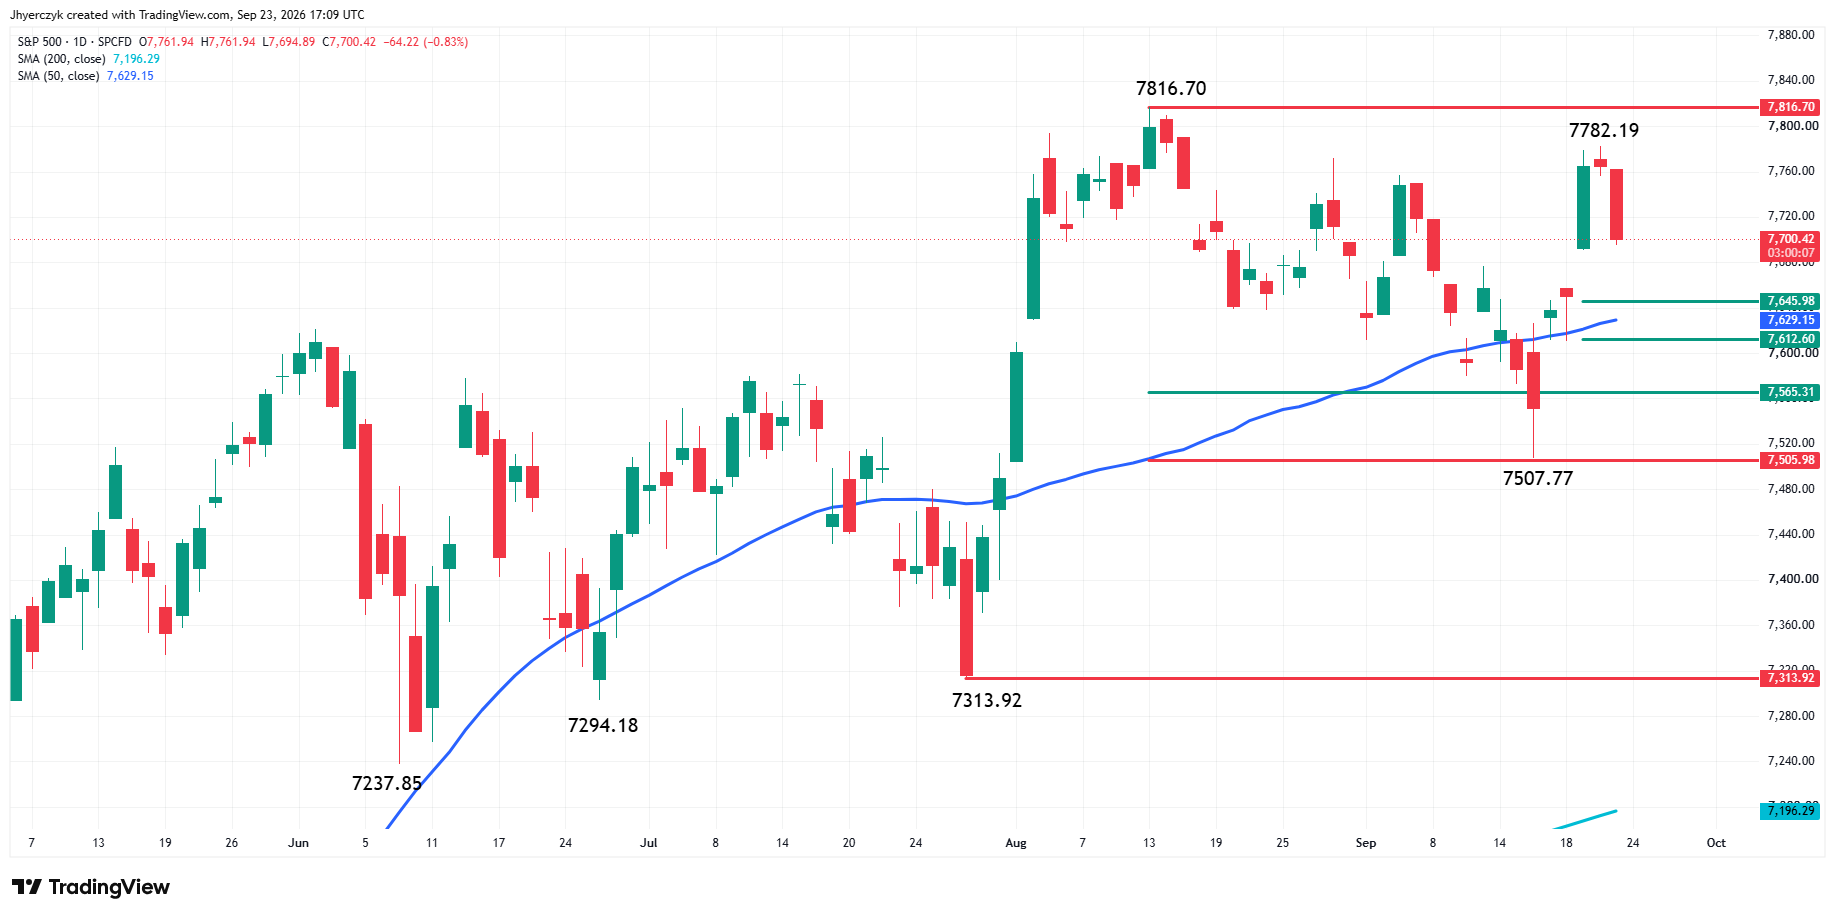
The main trend is up on the daily swing chart, but the S&P 500 Index is correcting from the 7,782.19 minor top. The index remains below the 7,816.70 main high and has not taken out a main bottom. The larger trend has not changed. The immediate trade has.
The 7,645.98 to 7,612.60 retracement zone is the first support area below. The 50-day moving average at 7,629.15 sits inside that zone. That gives buyers a real area to defend if selling continues.
A break through the zone puts 7,565.31 and then 7,505.98 back on the screen. The current move is a pullback as long as those lower levels hold. A recovery through 7,782.19 would put the 7,816.70 main high back in play.
Daily December E-mini S&P 500 Futures Technical Analysis
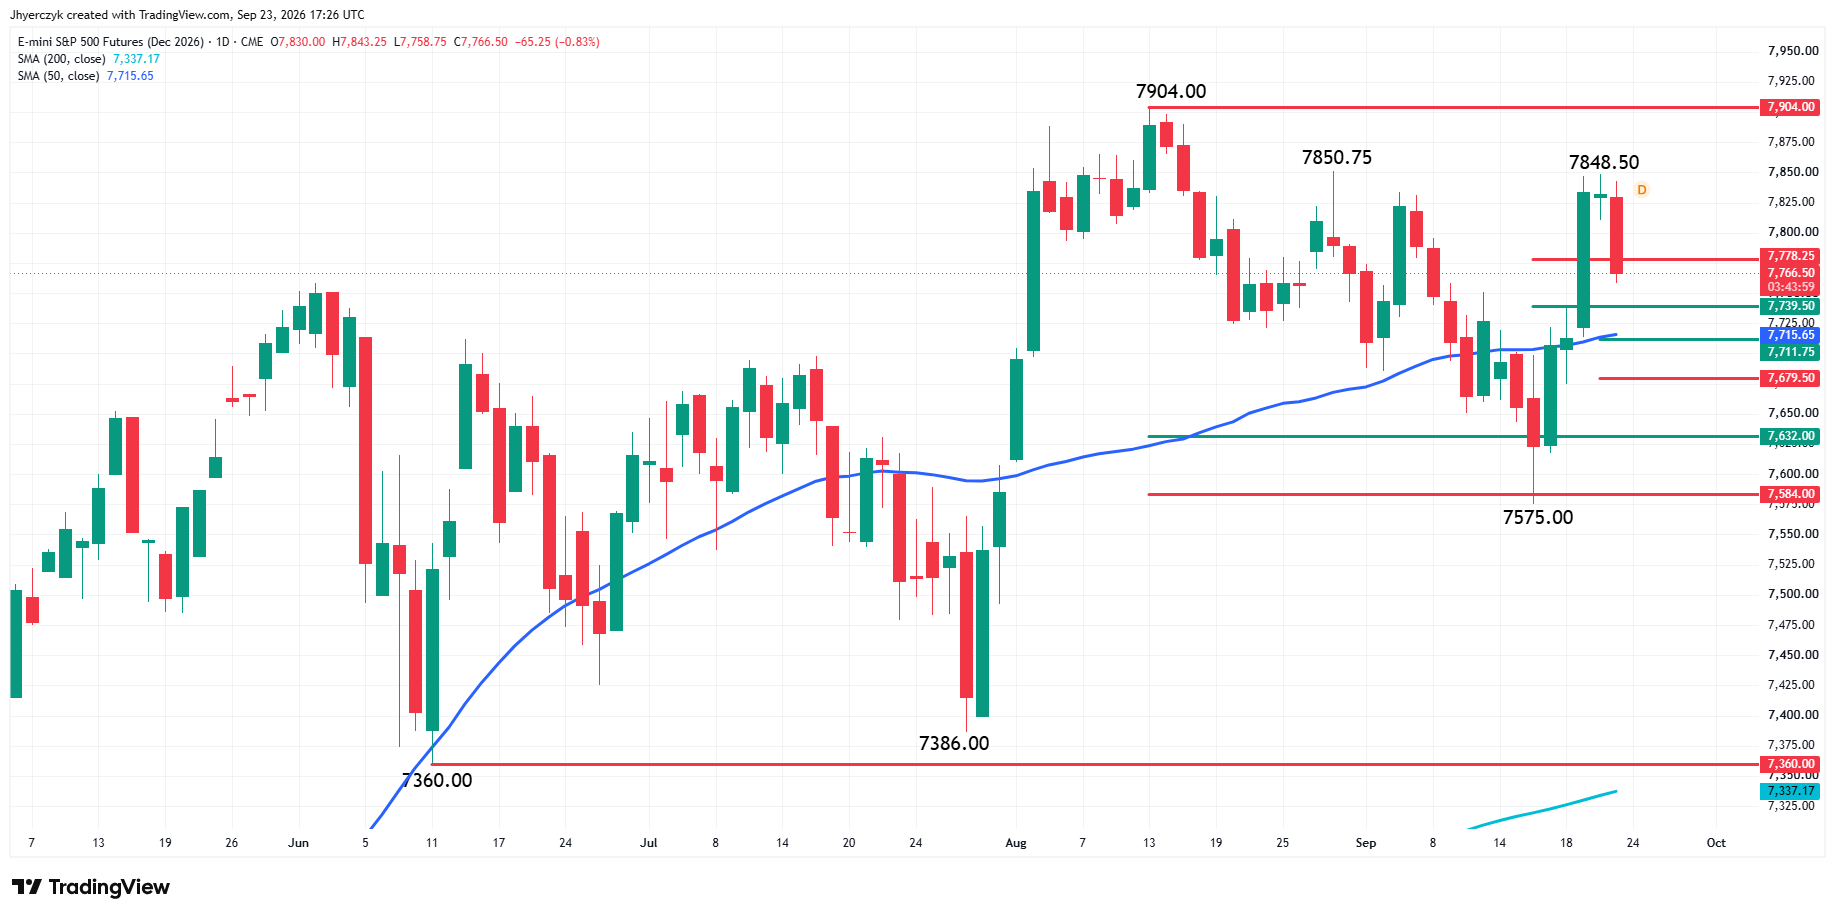
The main trend is up according to the daily swing chart after December E-mini S&P 500 futures crossed 7,833.50 Tuesday.
The trade through 7,833.50 Tuesday should have brought in follow-through buying. Instead, the contract reached 7,848.50 early Wednesday and could not extend the move. That may be telling us investors are more willing to bid at lower prices they can control than take offers near a new high. One day does not end an uptrend, but it can be the first sign that the momentum buyers are losing their lean.
The first downside level is 7,739.50. Below that, the 50-day moving average at 7,715.65 and the 7,711.75 50% level form a support cluster. The 7,711.75 level comes from the 7,575.00 to 7,848.50 rally.
A sustained move through the cluster could send the market into the 7,679.50 to 7,632.00 support area. The 7,679.50 level is the 61.8% retracement of the current rally. A move through 7,575.00 will change the main trend to down.
On the upside, a trade through 7,848.50 would show the buyers are back and put the 7,904.00 main high in play. Until then, the market is working through a pullback inside an uptrend. The key is whether buyers show up before the 7,739.50 level gives way.
Stock Market Forecast
The near-term trade belongs to yields. The 10-year at 5.125% with October hike odds above 73% is not giving stocks room to bounce. Tuesday’s rally ran on falling yields and falling crude. Wednesday reversed both. The PMI data broadened the inflation story beyond oil and the rate market responded by pushing October pricing from 55% to 73% in one session.
The S&P 500 Index is correcting inside an uptrend. The 7,645.98 to 7,612.60 zone with the 50-day at 7,629.15 inside it is where buyers have to show up. December E-mini S&P 500 futures have the 50-day at 7,715.65 and the 7,711.75 50% level as the first cluster. The cash and futures charts are both in pullbacks. Neither has broken a main bottom. The yield market will be the key driver of how deep the pullback goes.
More Information in our Economic Calendar.