
Natural Gas Is Rallying but March Is Not Buying the Winter
October natural gas pushed through $3.026 Tuesday and November followed with an even stronger move Wednesday. March is higher too but it is still below its 50-day moving average. That is the curve separating late-season heat from a real winter supply problem. The front months are trading the Commodity Weather Group’s hotter forecast through October 6. March is still asking whether any of that matters once heating season takes over.
At 10:25 GMT, October natural gas futures are trading $3.018, up $0.053 or 1.79%. The session high is $3.052 and the low is $2.999. November futures are trading $3.187, up 2.25%. March futures are at $2.863, up 1.63%.

October Ran Through the High but Stalled at the Next Level
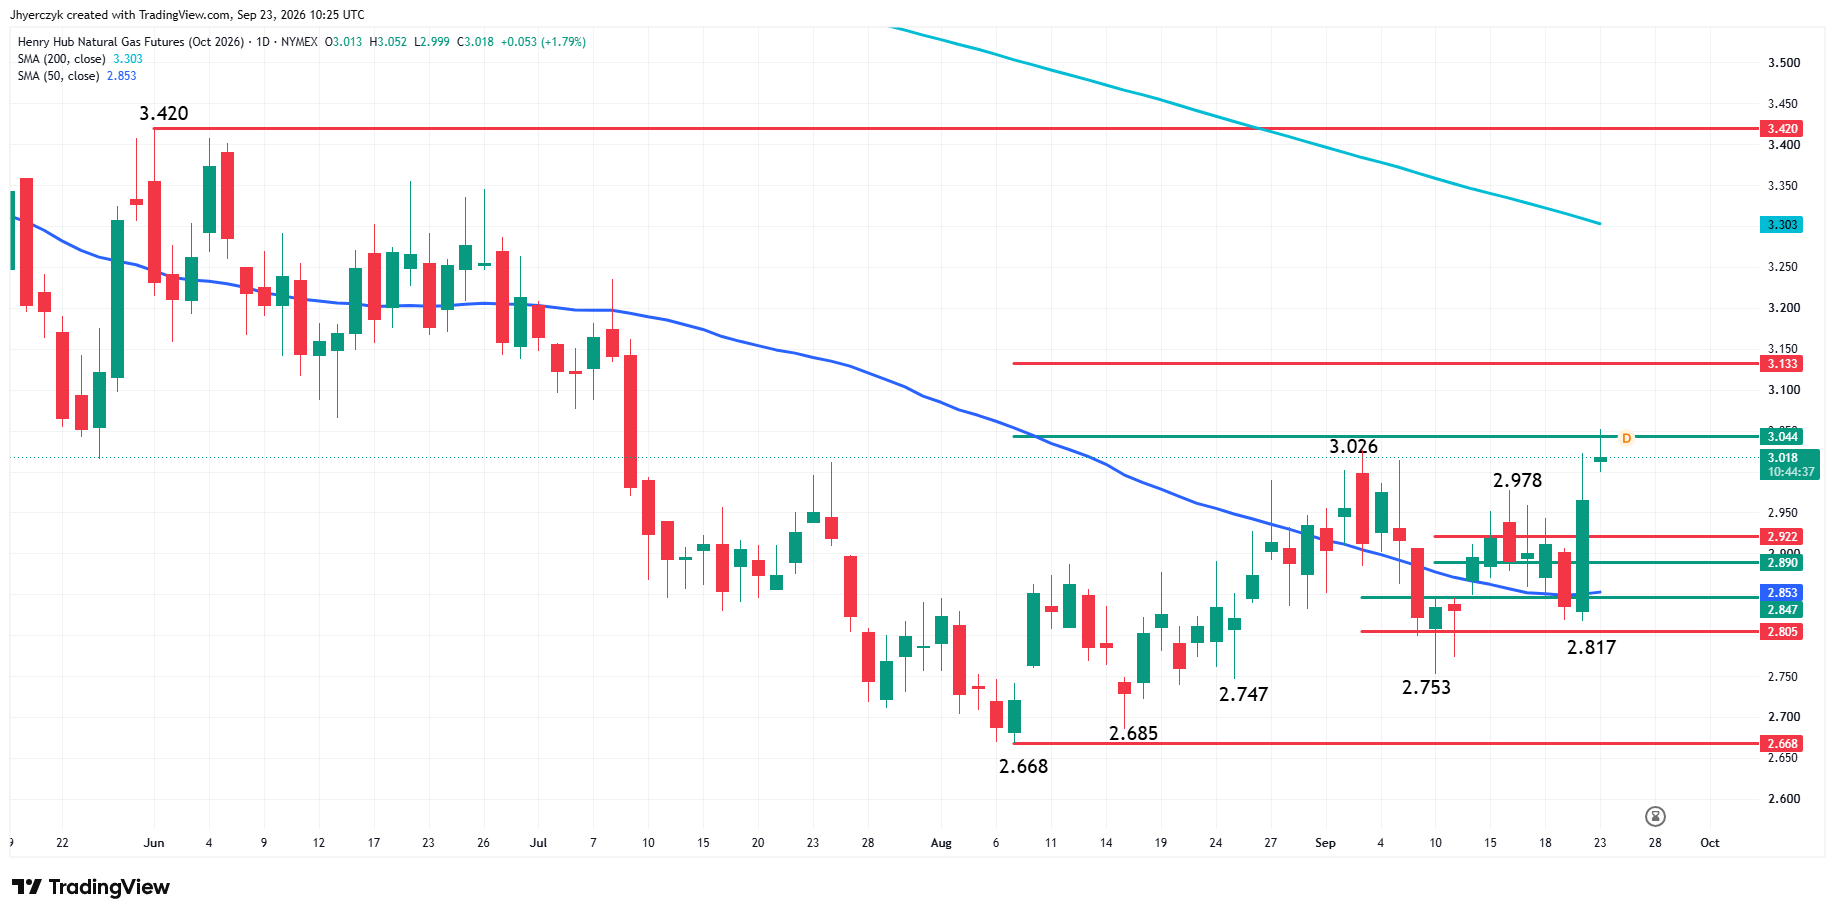
October reached $3.052 Wednesday after trading through the $3.026 swing top. That changed the main trend to up on the daily swing chart. The move has not held above the next resistance at $3.044. The 50-day moving average is at $2.853. October was below it last week. It is well above it now after the recovery from the $2.817 low.
The $3.044 level is the first test. A sustained move over it puts $3.133 in play. The $2.922 to $2.890 area is the first support zone if the weather bid fades. October is the contract most exposed to the late-summer heat forecast and Thursday’s storage report. It is supposed to move first. Whether the move spreads down the curve is the question the rest of the session answers.
November Is Following the Weather but Production Has Not Gone Anywhere
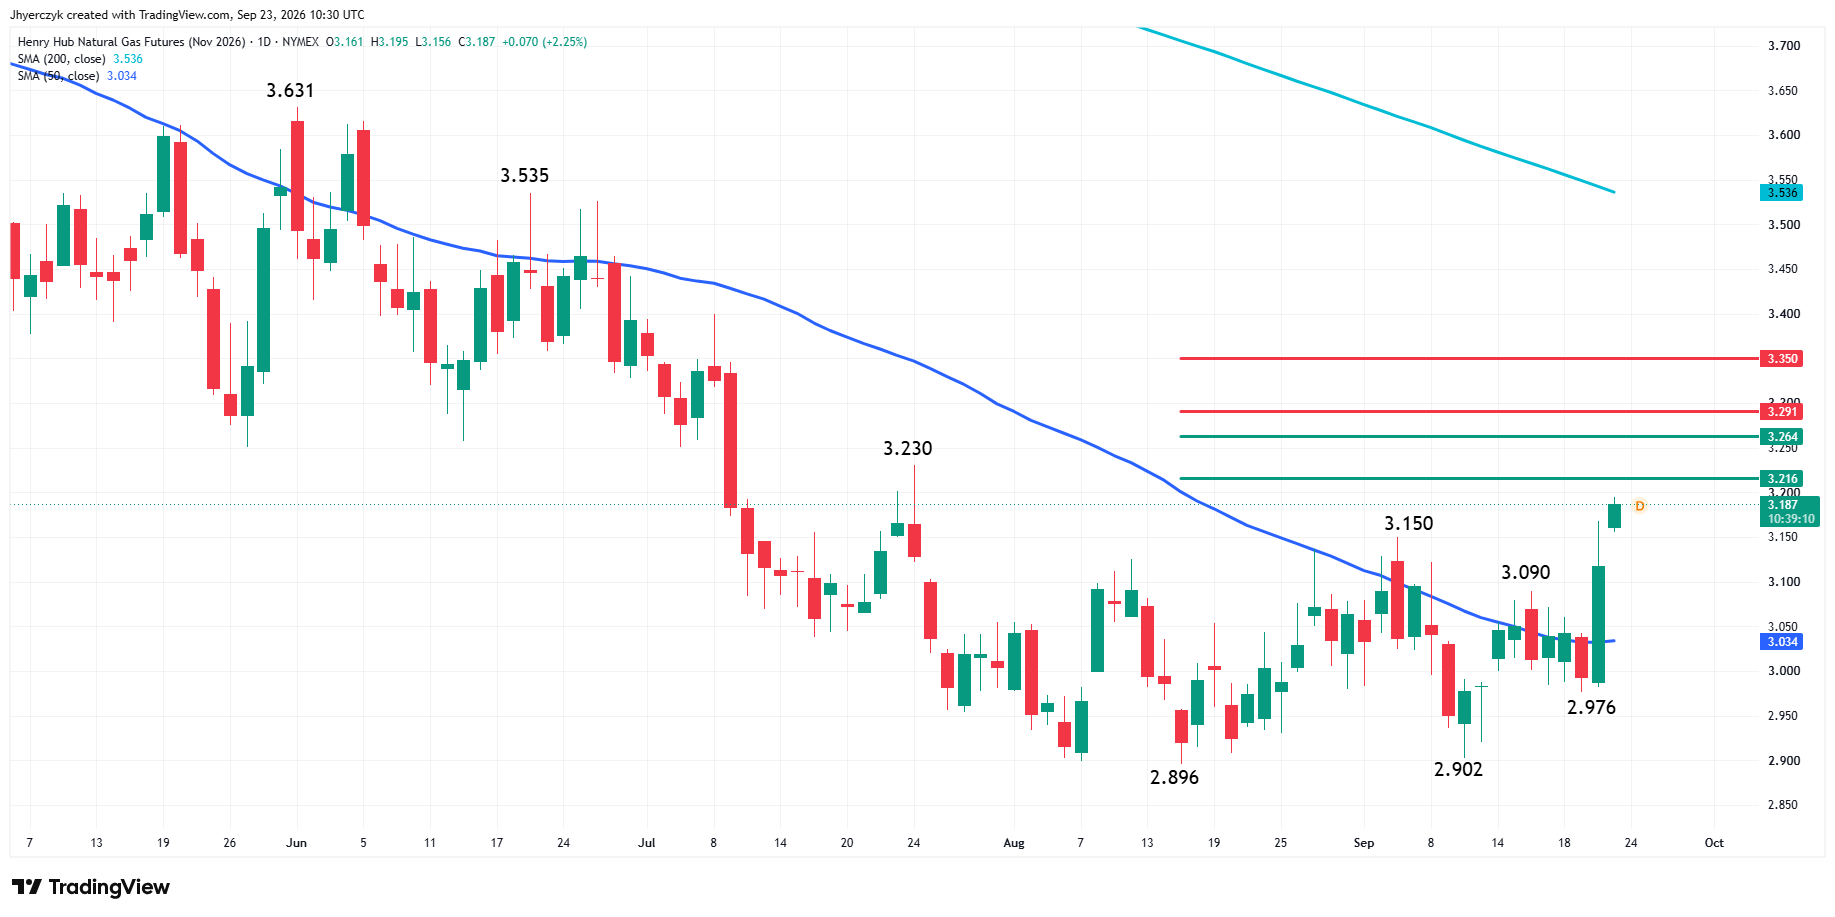
November is up more than 2% at $3.187. The contract is above its 50-day moving average at $3.034 after recovering from the $2.976 low. The first resistance is $3.216. Above that, $3.264 and $3.291. November has more room than October before it runs into a major level.
Lower-48 dry gas production was 112.2 bcf per day Tuesday, up 3.1% from a year ago according to BNEF. Down from the recent highs. Not a supply disruption. Demand was 74.6 bcf per day, up 0.3% from a year earlier. LNG feedgas was 18.5 bcf per day, down 0.6% from the prior week.
Natural Gas Price Forecast
Every new Natural Gas analysis as it publishes, today's technical signal and key levels, live price — on one page.
See all Natural Gas forecastsThe Commodity Weather Group forecast has above-average temperatures across the South-Central United States through October 6. Power demand is supposed to be fading by now. Extra air-conditioning demand is keeping gas-fired generation in the market longer than traders expected. That is the bid under the front months. Production at 112.2 bcf per day and feedgas slipping is the weight sitting on top of it.
March Is Higher and Still Below Its Moving Average
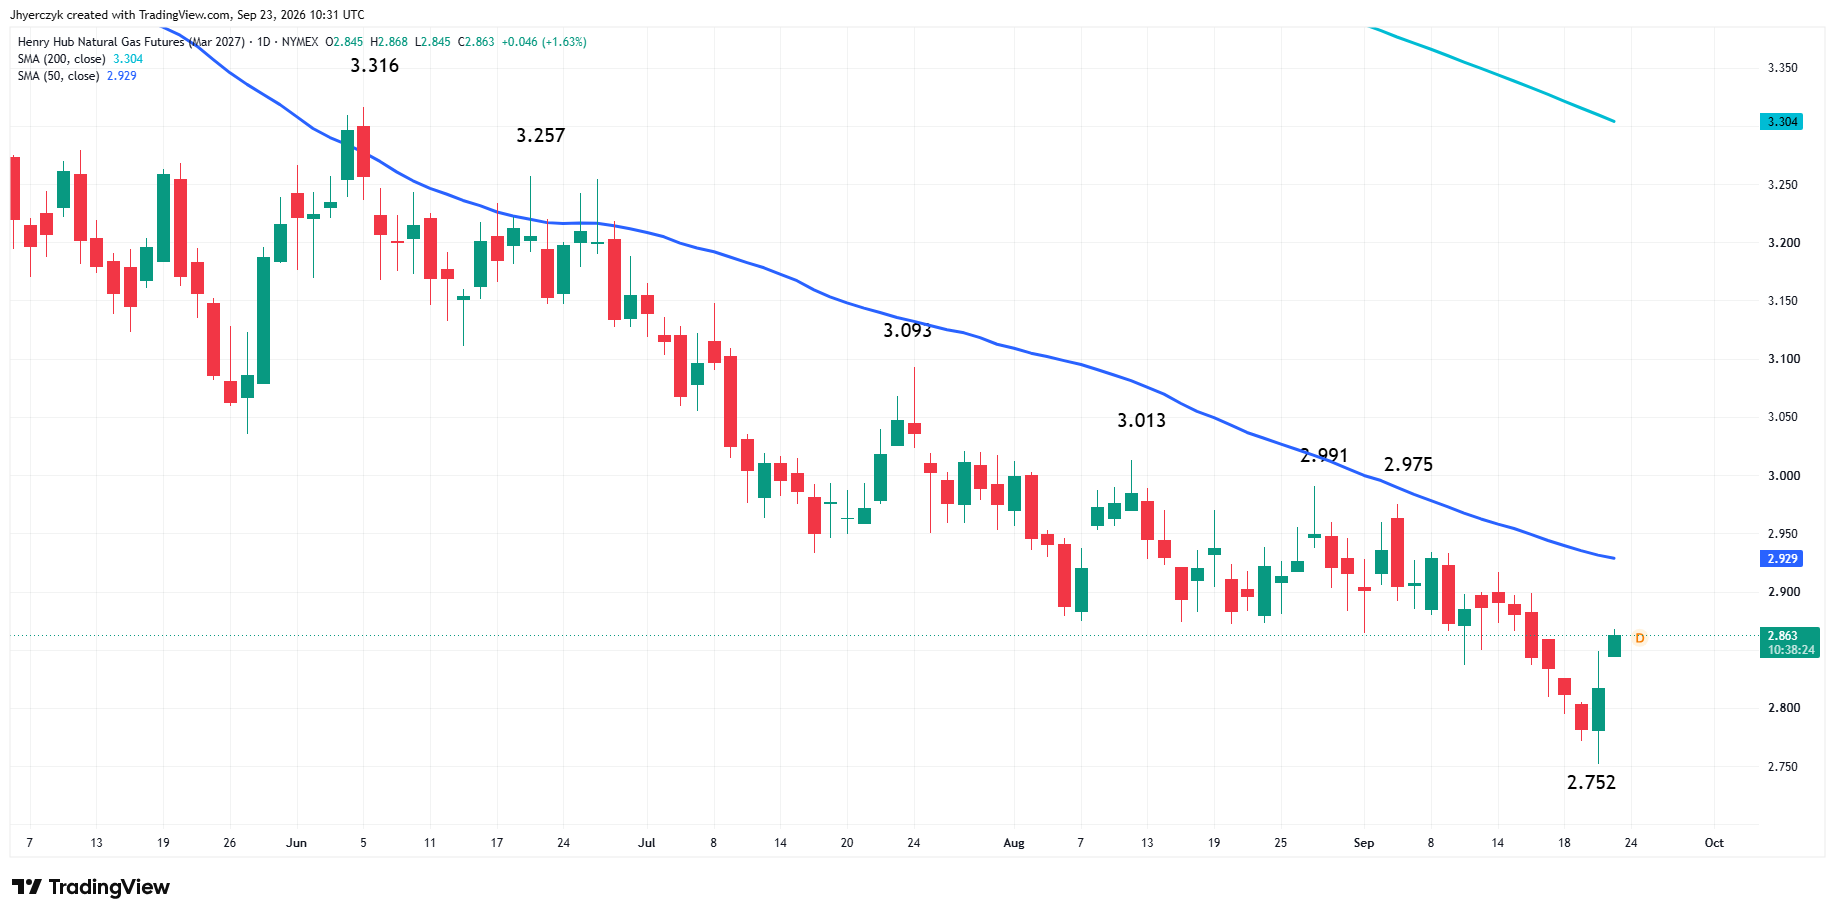
March is up 1.63% at $2.863. It bounced from the $2.752 low last week and reached $2.868 Wednesday. The 50-day moving average at $2.929 is still above the market. The contract remains below a series of lower highs.
If the market was starting to price a real winter shortage, March would be leading the move or clearing its average alongside October and November. It is not doing either. The Super El Niño forecast is still pressing on the deferred contracts. A warmer Northern Hemisphere fall and winter would reduce heating demand when the market needs it most.
The curve is putting a weather premium into October and November. It is leaving March behind. Buyers need $2.929 on March before the winter argument changes. Until then, the front-end rally and the deferred-curve weakness are two different trades running at the same time.
Storage Is Still Heading Toward a 10-Year High
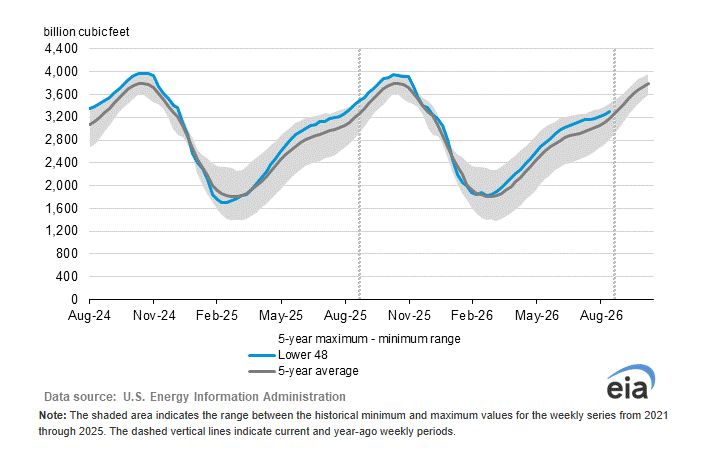
Thursday’s EIA storage estimate is for a 50 bcf build. Last week’s 44 bcf injection came in below the 48 bcf estimate and well below the five-year average build of 74 bcf. The smaller build helped the market last week. It did not change the storage picture.
Inventories are 3.7% above the five-year seasonal average as of September 11. The EIA projects end-of-October storage near 3,985 bcf, the highest in a decade and 5% above the five-year average. The EIA also raised its 2027 production forecast to 116.0 bcf per day from 115.3 bcf per day in July.
Edison Electric Institute had lower-48 electricity output up 16.1% from a year earlier at 94,427 gigawatt hours in the week ended September 12. Trailing 52-week generation was up 3.3%. The power demand number is helping the front of the curve. It has not overcome what production and storage are doing on the other side of the balance sheet.
What to Watch
Thursday’s 50 bcf storage estimate is the first test. A smaller build gives October and November another reason to hold gains. A larger build reminds the market that end-of-season storage is still tracking toward the highest October number in a decade.
The South-Central heat forecast through October 6 is keeping the front-end bid alive. As long as that forecast holds, late-season power demand supports October and November. A cooler shift takes the reason for the rally away fast.
October changed its main trend to up after trading through $3.026 but needs to hold above $3.044 to show the move has follow-through. November is above its 50-day at $3.034 with $3.216 in front of it. March is the cleaner read on the winter trade and it remains below $2.929. The front end is buying heat. March is not buying the winter yet.
More Information in our Economic Calendar.