Breakout Revives Long-Term Bullish Trend
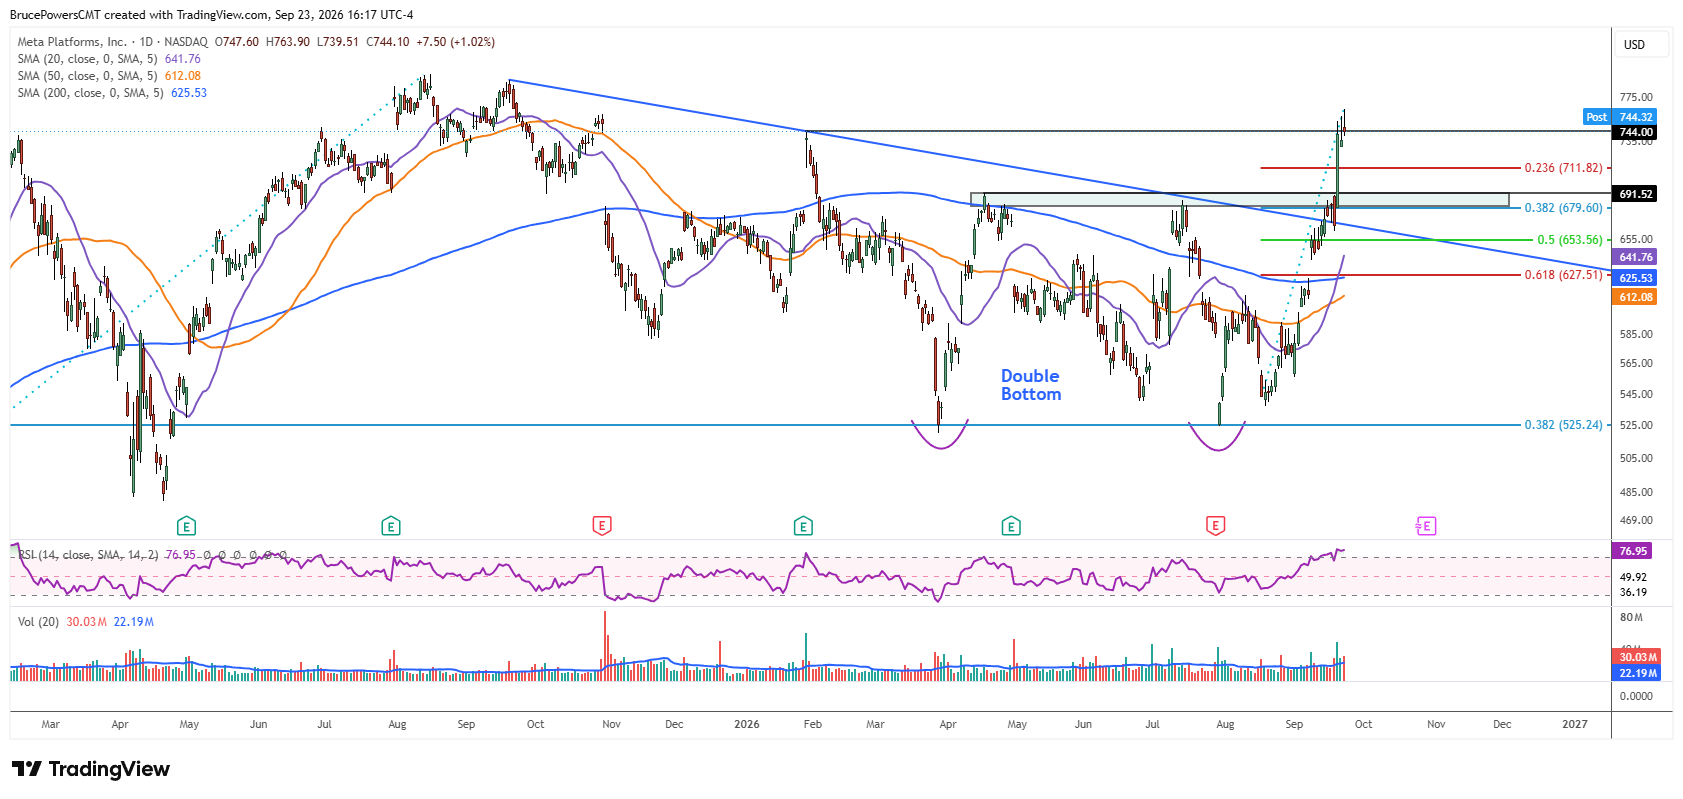
Shares of Meta Platforms, Inc. (META) have sustained a five-week advance supported by the launch of its new Muse AI personal agent on September 8. On Monday, the stock triggered a bullish reversal from a bottom consolidation pattern, taking the form of a double bottom, on a rally above resistance at $691.52. That breakout also confirmed the completion of the bearish correction that followed the $796.25 peak in August 2025. This means that META has been consolidating and building demand for its next move for a little over a year.

Momentum Meets Near-Term Exhaustion Risk
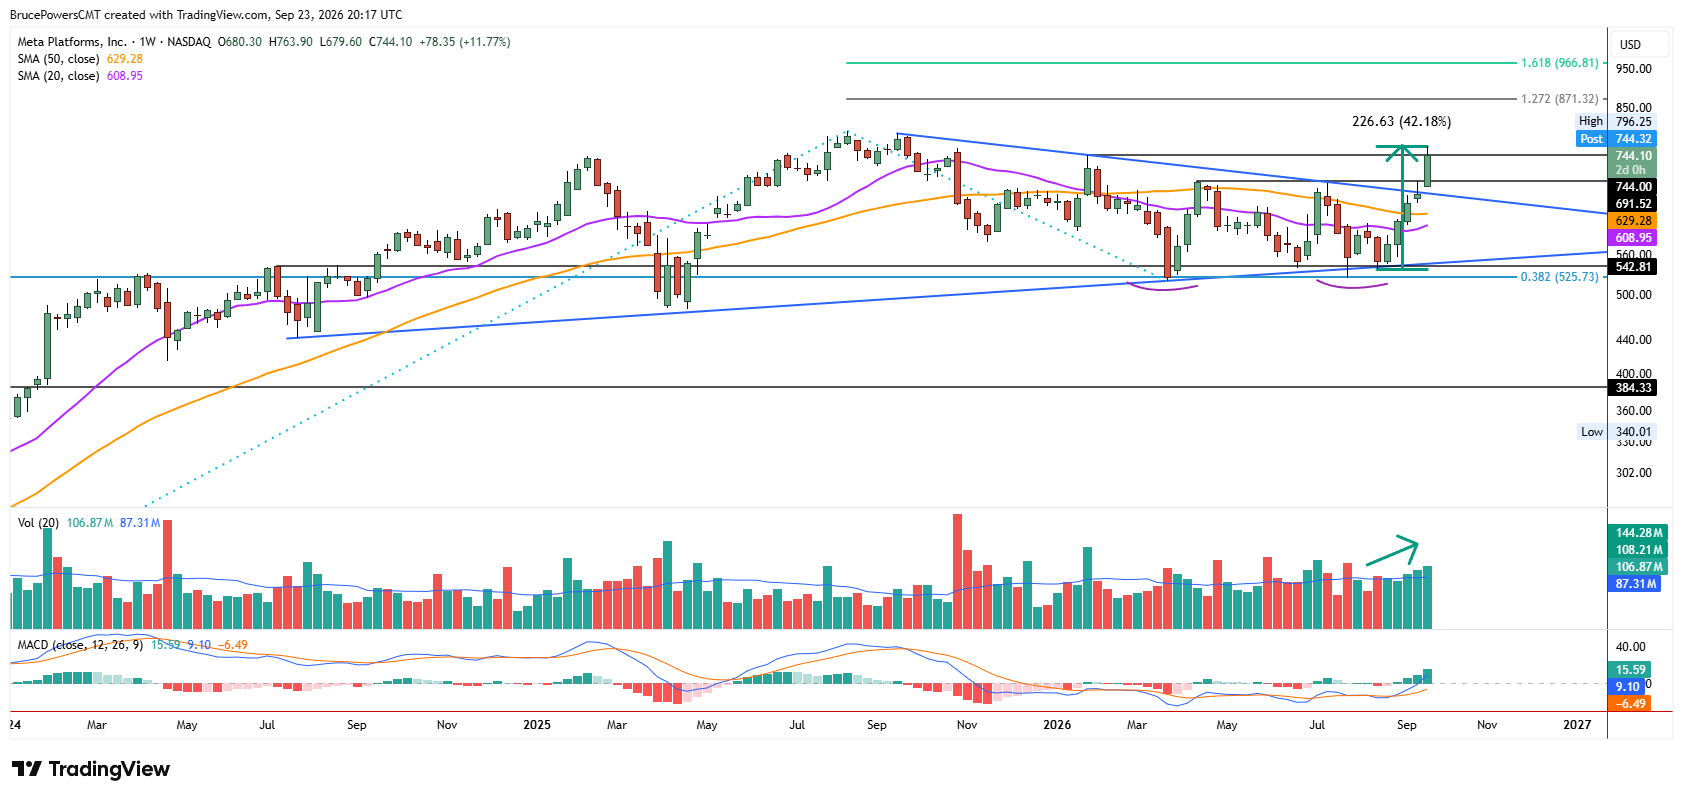
META reached a new high of $763.90 on Wednesday, which followed a bullish trend reversal signal that triggered on Monday on a move above the lower swing high of $744 from January. There was not a daily close above that level to confirm that move until Wednesday’s close of $744.10. Although that may be enough to engender confidence. Nonetheless, in the near-term META is at risk of exhaustion leading to either a pullback or consolidation. As of Wednesday’s high, the stock was up by around 42% when measured from the recent higher swing low of $537.27 from mid-August.
First Support Zone Comes Into Focus
A key potential support zone is going to be around the neckline of the double bottom pattern near $691.92, along with the 38.2% Fibonacci retracement of the recent advance at $679.60. That would be the first price zone that has some degree of confluence. In addition, the downtrend line nearby represents a potential support zone. The 50% retracement at $653.56 can be used as a guide for dynamic support around the downtrend line as well.
Rising Volume Confirms Underlying Demand
Further confirmation of recent demand can be seen by the rising weekly volume levels the past five weeks as the advance extended. It increased further into the advance, which is indicative of rising underlying demand. Along with the other bullish indications noted above, this puts META in a position to complete its first pullback after a key breakout, providing the potential for defined risk and new record highs if the long-term bull trend extends.
If you’d like to know more about technical analysis and how traders use it, please visit our educational area.