


Bullish Breakout Gains Momentum
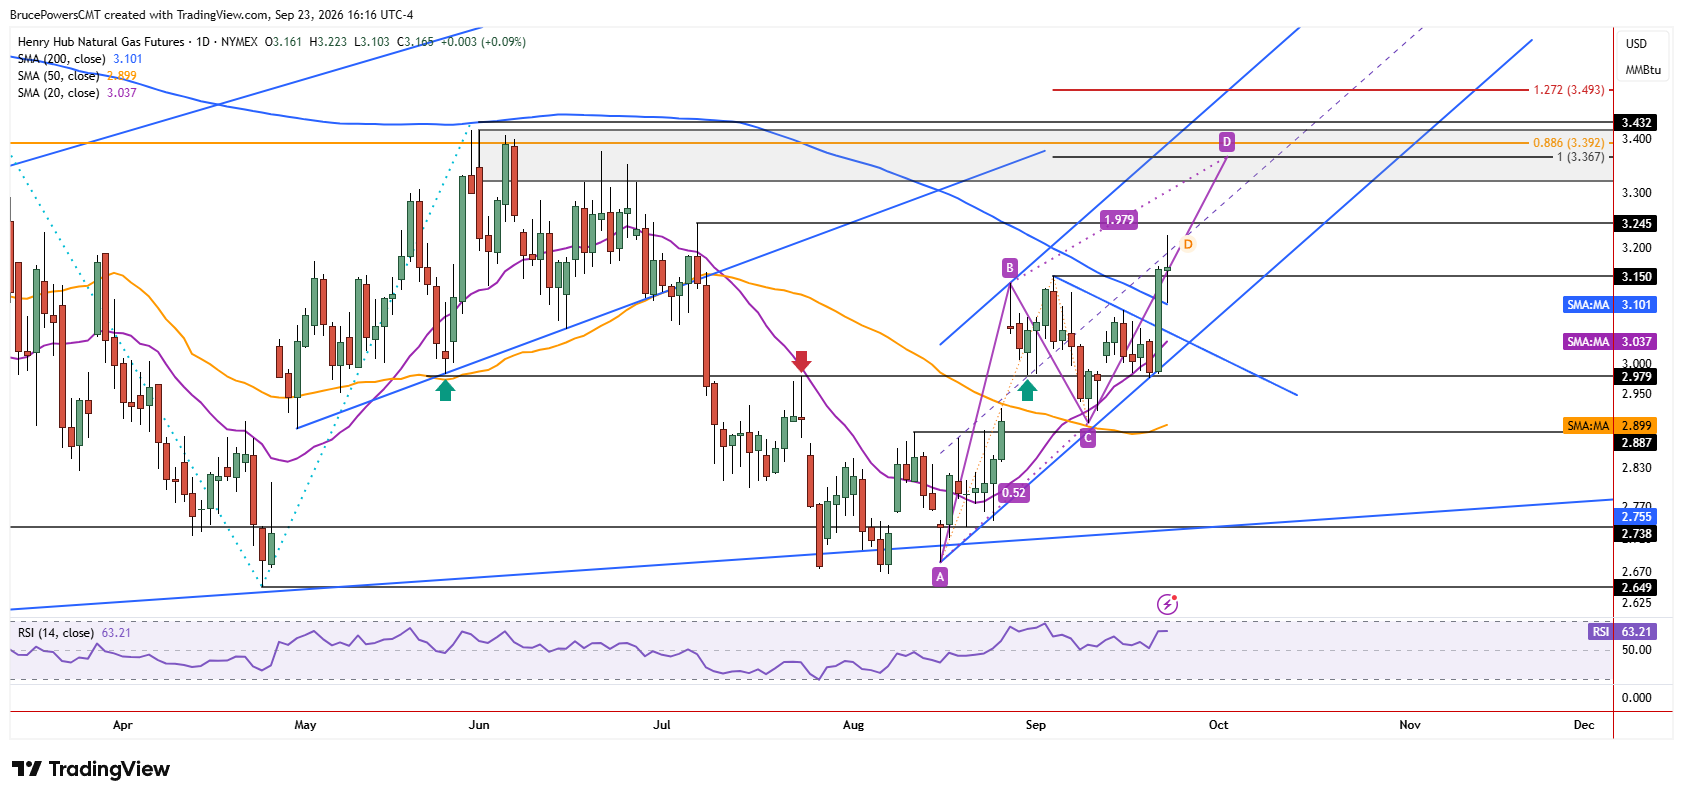
Natural gas extended gains on Wednesday, signaling a continuation of the short-term bullish trend and reaching a new high of $3.23. A sharp advance on Tuesday reclaimed the 200-day moving average and signaled a bullish reversal on a move above the prior high of $3.15. Both signals suggest further upward pressure in natural gas, while also anticipating potential pullbacks or consolidation.

200-Day Moving Average Turns Into Support
A higher daily low of $3.10 on Wednesday found support at the 200-day moving average, providing an initial short-term signal that the indicator had switched from resistance to support. That switch shows buyers likely retaining underlying control, which may result in another attempt at the next resistance zone defined by the prior lower swing high at $3.25 from July. Moreover, Tuesday’s advance confirmed the breakout above the prior high of $3.15 by closing above it near $3.16, indicating that an upside continuation may follow.
Rising Channel Defines Dynamic Support
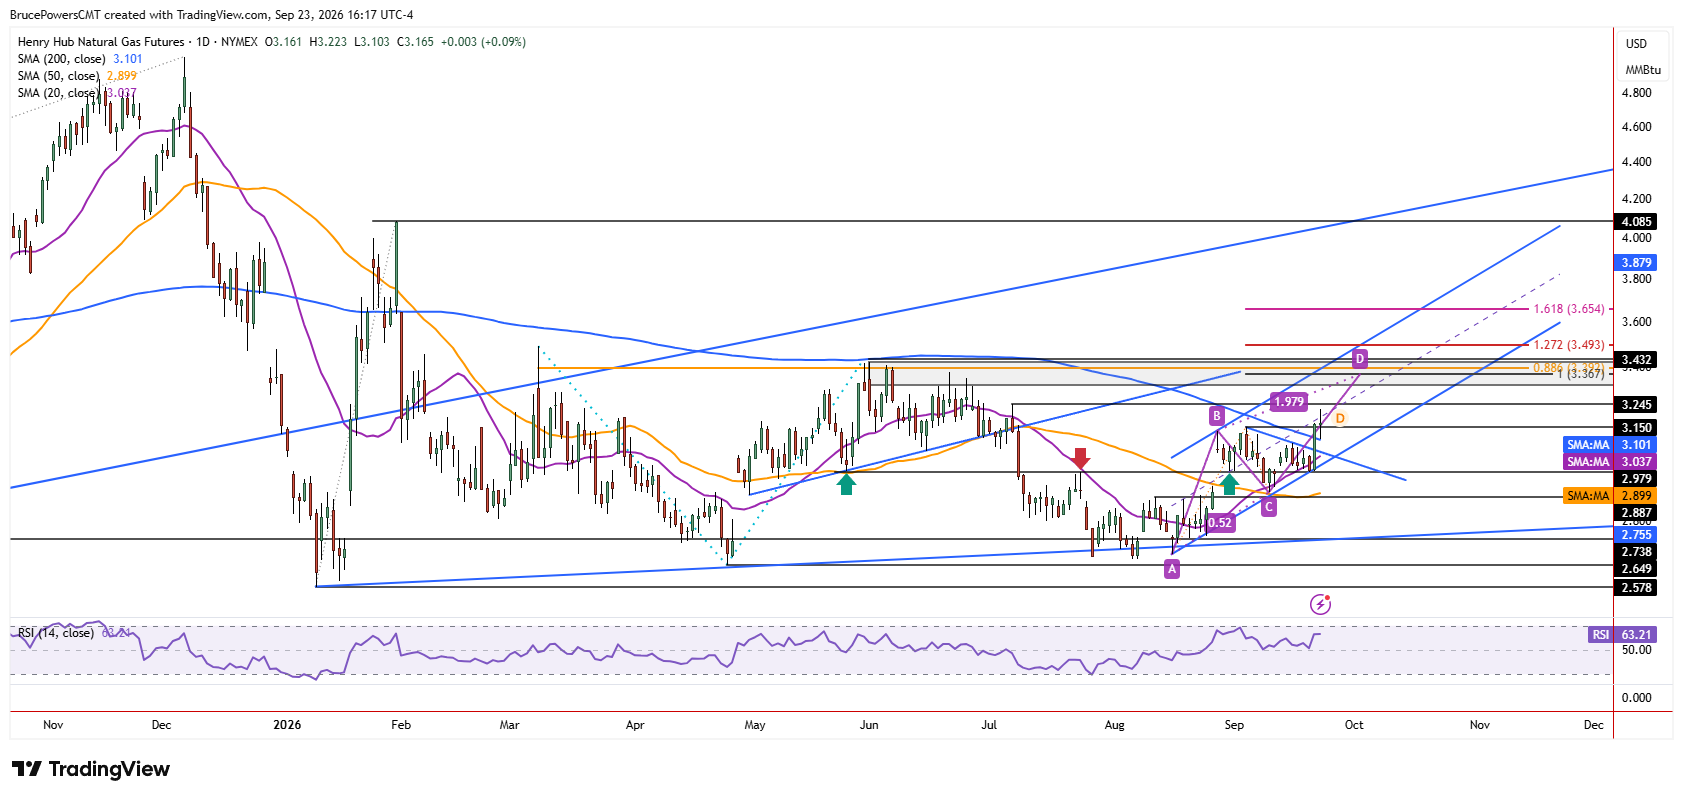
Dynamic support for the rising channel is defined by both a rising trendline and the 20-day moving average, now near $3.04. Since that average is rising it will soon cross above the short downtrend line that defined the upper boundary of recent consolidation. A pullback to retest support near the 20-day moving average would be a normal move following this week’s rally. However, if support holds near the 200-day moving average and it is followed by strength, a stronger bullish indication would be given.
ABCD Pattern Points Toward $3.37
A potential upside target from measured moves can be seen in the rising ABCD pattern on the chart, near $3.37. That is where the current upswing will match the advance the first advance, and it defines a potential resistance zone. It also is used to measure strength, in the case that the level is exceeded to the upside. That potential target lies within a potential resistance zone roughly defined by prior highs from $3.32 to $3.42.
If you’d like to know more about how to trade natural gas, please visit our educational area.



