AMD Technical Analysis
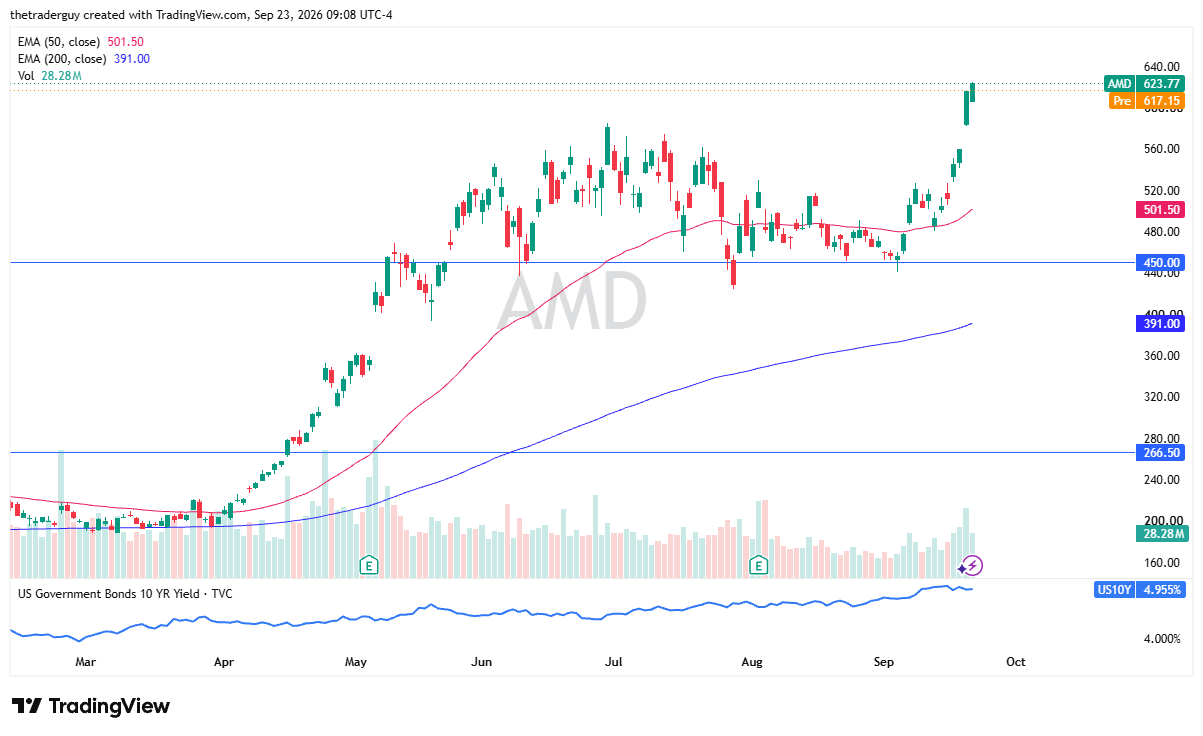
The pre-market trading for AMD looks a little bit soft. That being said, though, we must keep in mind that it has shot straight up in the air recently. So, a little bit of a pullback makes sense and, in fact, probably attracts buyers. I’d like to see a little bit deeper correction than the pre-market trading suggests, but we’ll have to see what the market gives us.
Either way, we have recently cleared a pretty significant swing high at $585. Anywhere in that area that we start to bounce, I might start getting interested.
INTC Technical Analysis
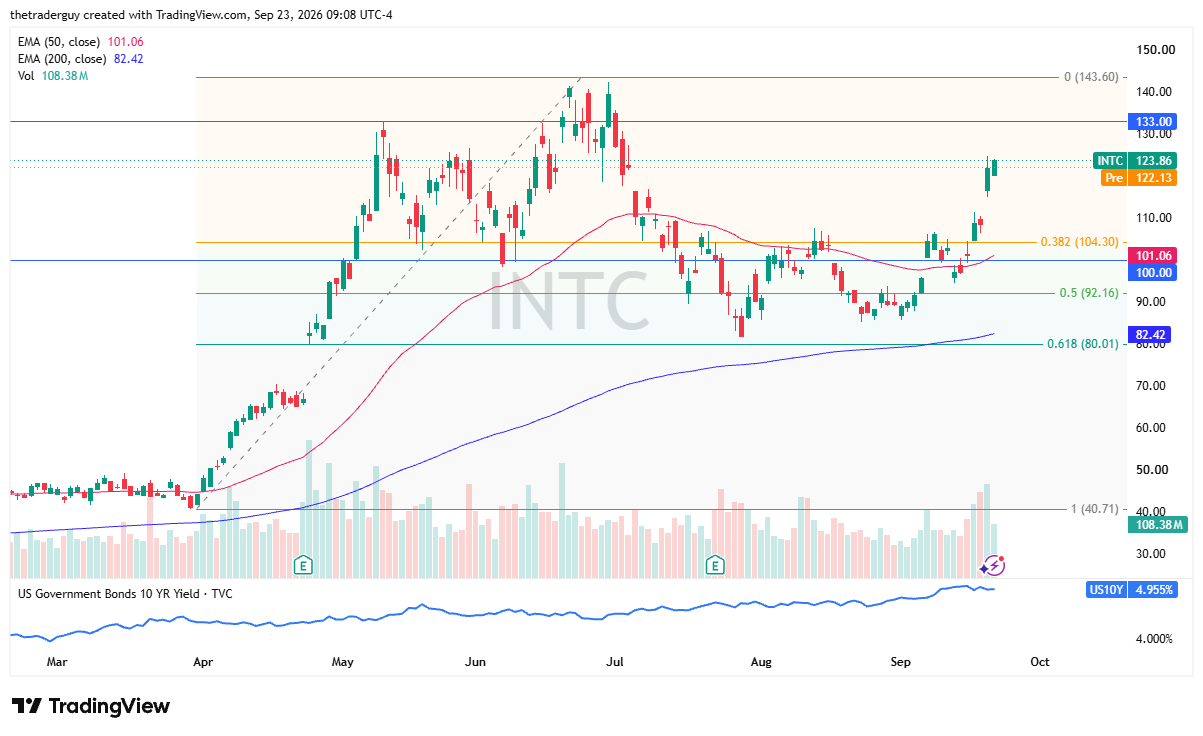
Intel looks like it’s going to do somewhat the same. It did get the same jump a couple of days ago. It is a market that has a lot of support underneath. The most obvious spot for me is $110. I don’t know that we get down there, but this is definitely a market that I like in general. Intel has been a stellar performer most of the last year, and this looks like it’s going to be more of the same type of bullish behavior, with the occasional pullback that traders will be looking to take advantage of.
NVDA Technical Analysis
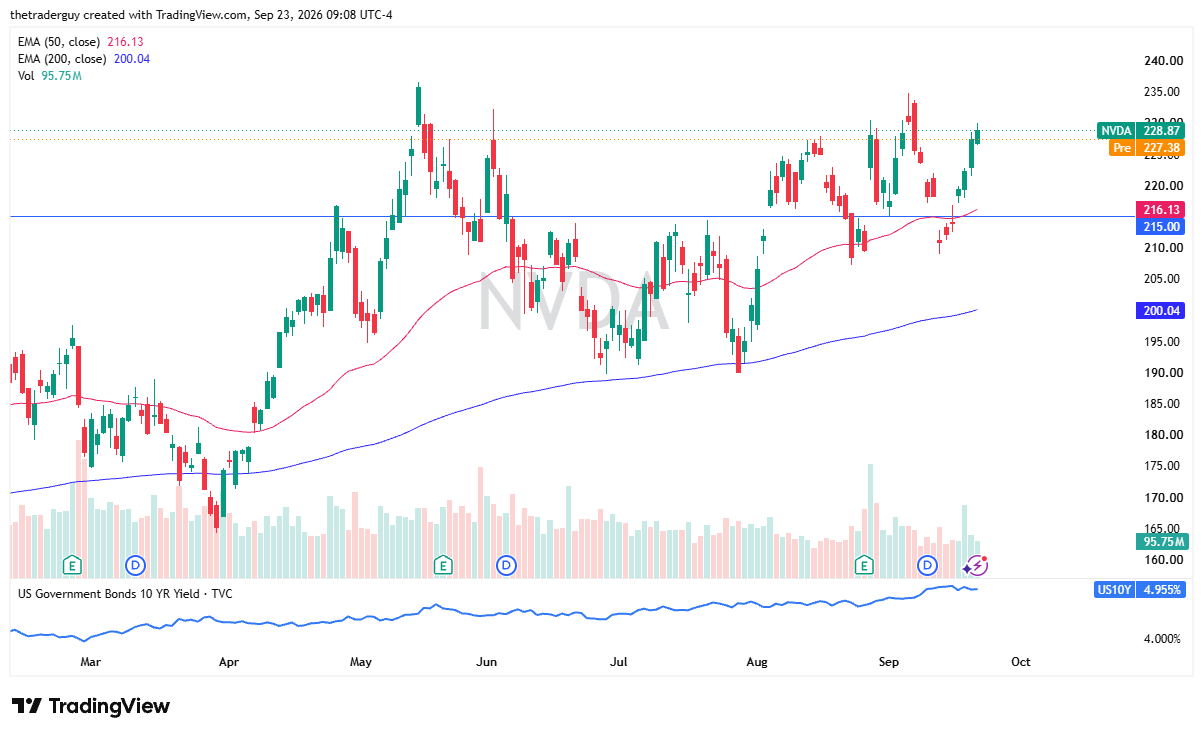
NVIDIA looks a little more range-bound, but that makes sense. NVIDIA had been on fire for years, so I’m watching this. This is probably my least favorite of the three, although longer term, I think it’s fine. It’s just the structural setup that I’m not as big of a fan of, as we are still in the same consolidation that we have been in since the beginning of August.
That being said, I certainly wouldn’t short this market, and I do think there’s a significant amount of support near the 50-day EMA and the $215 level.
If you’d like to know more about technical analysis and how traders use it, please visit our educational area.