



Saudi Arabia got crude moving through the Strait again and restarted the East-West Pipeline in the same week. Iraq is adding barrels through Turkey. An Iranian official floated a seven-day Hormuz reopening and crude sold off before anyone could verify it. Diesel did not flinch. Gasoil’s premium to Brent hit a record and the White House responded by talking about banning diesel exports. The crude side of the energy market is getting relief. The diesel side has a problem nobody in the supply chain has solved yet.
At 13:16 GMT, November Brent crude oil futures are trading $100.54, up $1.29 or 1.30%. The session high is $100.80 and the low is $97.91. November WTI crude oil futures are trading $91.05, up $0.53 or 0.59%. The session high is $91.36 and the low is $88.71.
Daily November Brent Technical Analysis
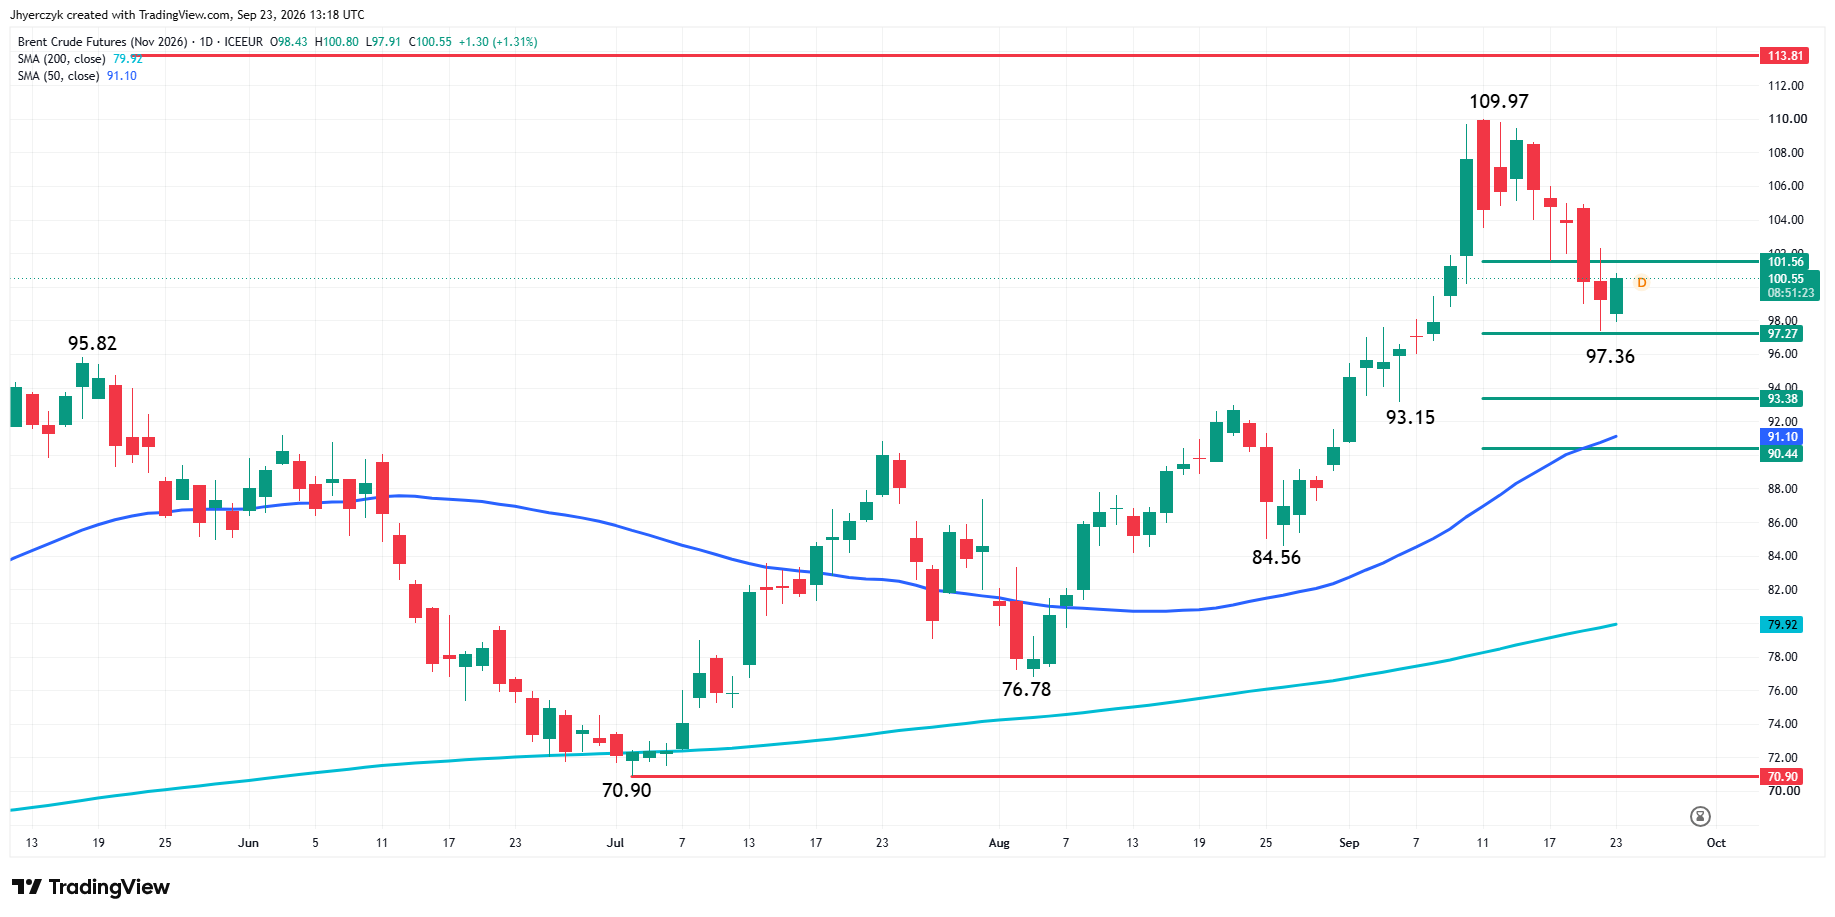
The main trend is up according to the daily swing chart. Brent rallied from the $84.56 bottom in late August to the $109.97 high in September. The break from $109.97 is a correction inside that larger move until the market takes out a main bottom.
The short-term 50% level is $101.56. It comes from the $93.15 to $109.97 rally. Brent traded back into that level Tuesday and could not hold it. Wednesday’s rally reached $100.80. Buyers have not taken back the 50% level yet.
Below the market, the $97.27 level is the 50% retracement of the $84.56 to $109.97 range. Brent reached $97.36 Tuesday and turned up. That was close enough to show buyers were waiting in the area. It was not a bottom. One day off a low does not create a bottom.
The next major 50% level is $93.38. The 50-day moving average is $91.09. That creates a support cluster below $97.27 if the current low fails.
The main trend stays up as long as Brent holds above the $93.15 main bottom. A trade through $93.15 changes the main trend to down. A trade through $109.97 resumes the uptrend. Until one of those things happens, Brent is trading inside a correction with the $101.56 and $97.27 retracement levels controlling the short-term moves.
Brent Oil Price Forecast
Every new Brent Oil analysis as it publishes, today's technical signal and key levels, live price — on one page.
See all Brent Oil forecastsDaily November WTI Technical Analysis
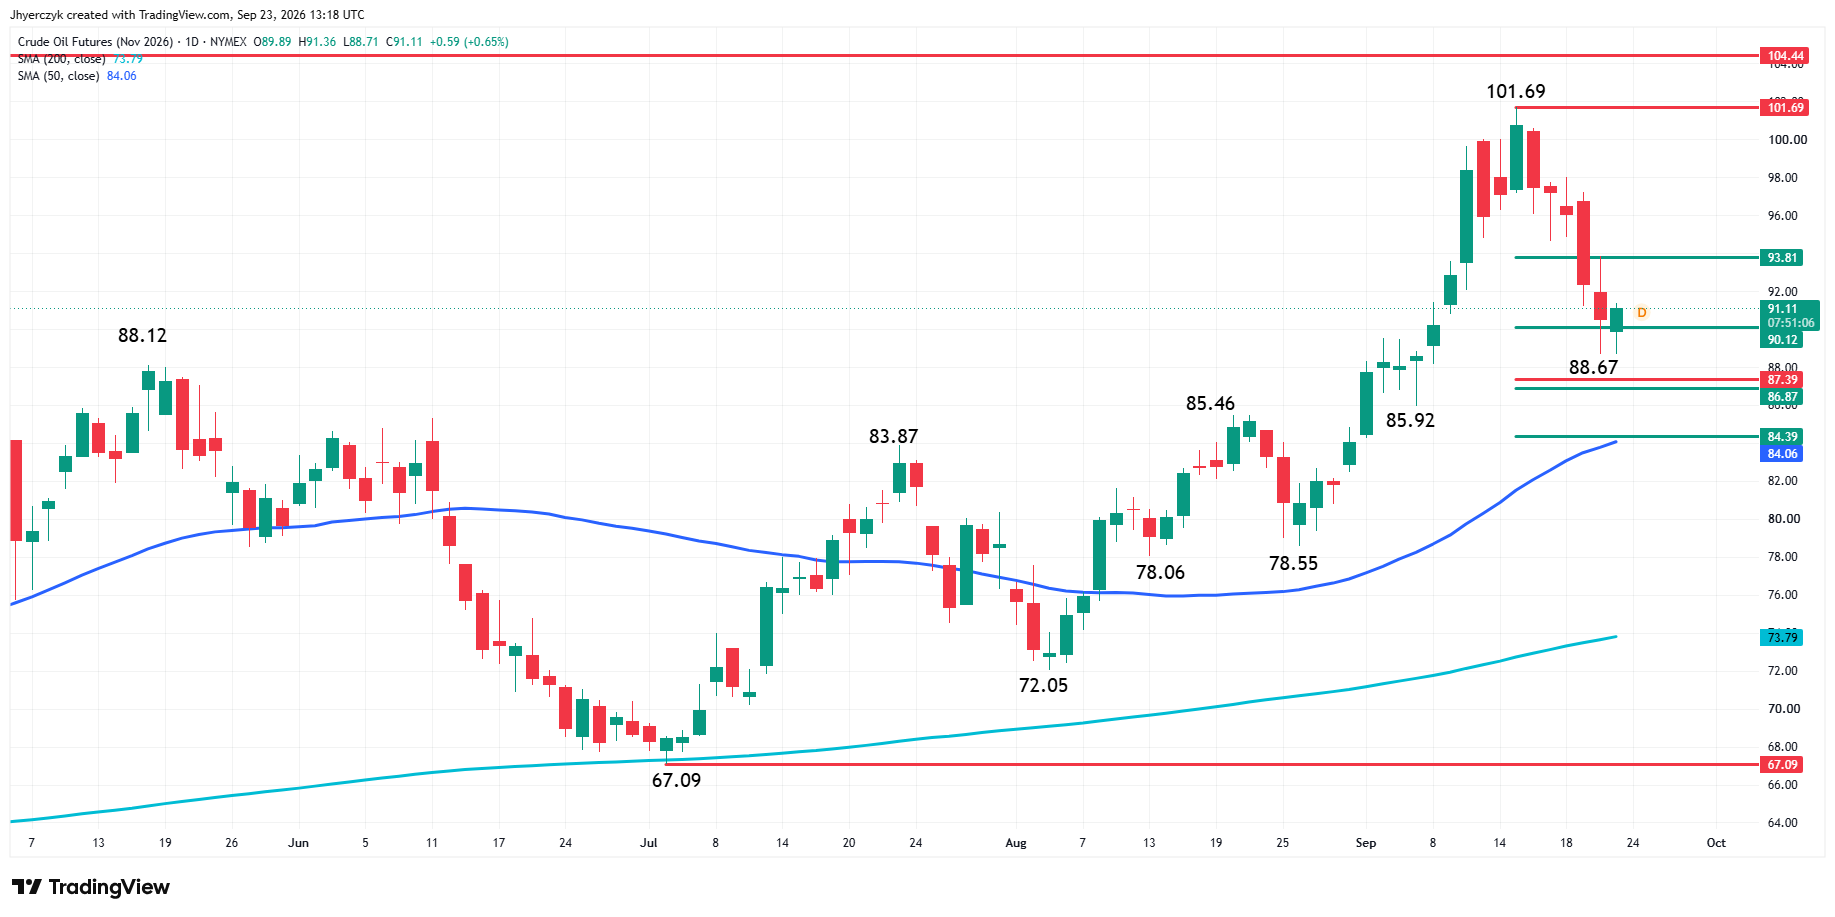
WTI is in the same position. The main trend is up on the daily swing chart, but the market is correcting from the $101.69 high.
The short-term 50% level is $93.81. It comes from the $85.92 to $101.69 rally. WTI broke under that level during the recent selloff. It has not recovered it. That leaves the short-term sellers with the edge, but it does not change the main trend.
The next important area is the $87.39 to $86.87 retracement zone. The $86.87 level is the 50% retracement of the $72.05 to $101.69 range. WTI reached $88.67 and bounced before testing the zone. Buyers showed up above it. That does not make $88.67 a bottom.
The 50-day moving average is $84.05. It sits below the retracement zone. A sustained move through $86.87 opens the door to the average. A hold above the zone keeps the correction contained.
WTI has a high at $101.69 and a major bottom at $85.92. The market has not taken out either number. That is why there is no CL bias here. WTI is between the short-term 50% level above and the deeper 50% level below.
Saudi and Iraqi Barrels Are Putting Pressure on Crude
Brent reached $97.36 Tuesday, the lowest since September 8. WTI hit its lowest since September 1. Both bounced Wednesday. The selling started because the market saw more barrels move.
The pipeline reopening gives Saudi Arabia a route to the Red Sea without sending every barrel through Hormuz. It is not at full capacity. It is running. TankerTrackers showed Aramco loaded about 14 million barrels on seven VLCCs inside the Gulf Sunday. JPMorgan had Saudi flows through the Strait averaging 2.9 million barrels per day over the past six days. In August that was 700,000.
Saudi Arabia shifted cargoes toward Asian buyers and ship-to-ship transfers through Oman after the Red Sea route was compromised. The routes are different. The risk on every route is live. More crude is moving anyway and that is what the market priced Tuesday.
Iraq’s oil minister said exports could rise above 600,000 barrels per day through Turkey. The Hormuz reopening comment from the Iranian official is conditional. The Saudi and Iraqi barrels are not. That is why crude traders are pulling premium out of Brent and WTI while diesel traders are still paying records.
Diesel Has Its Own Supply Problem
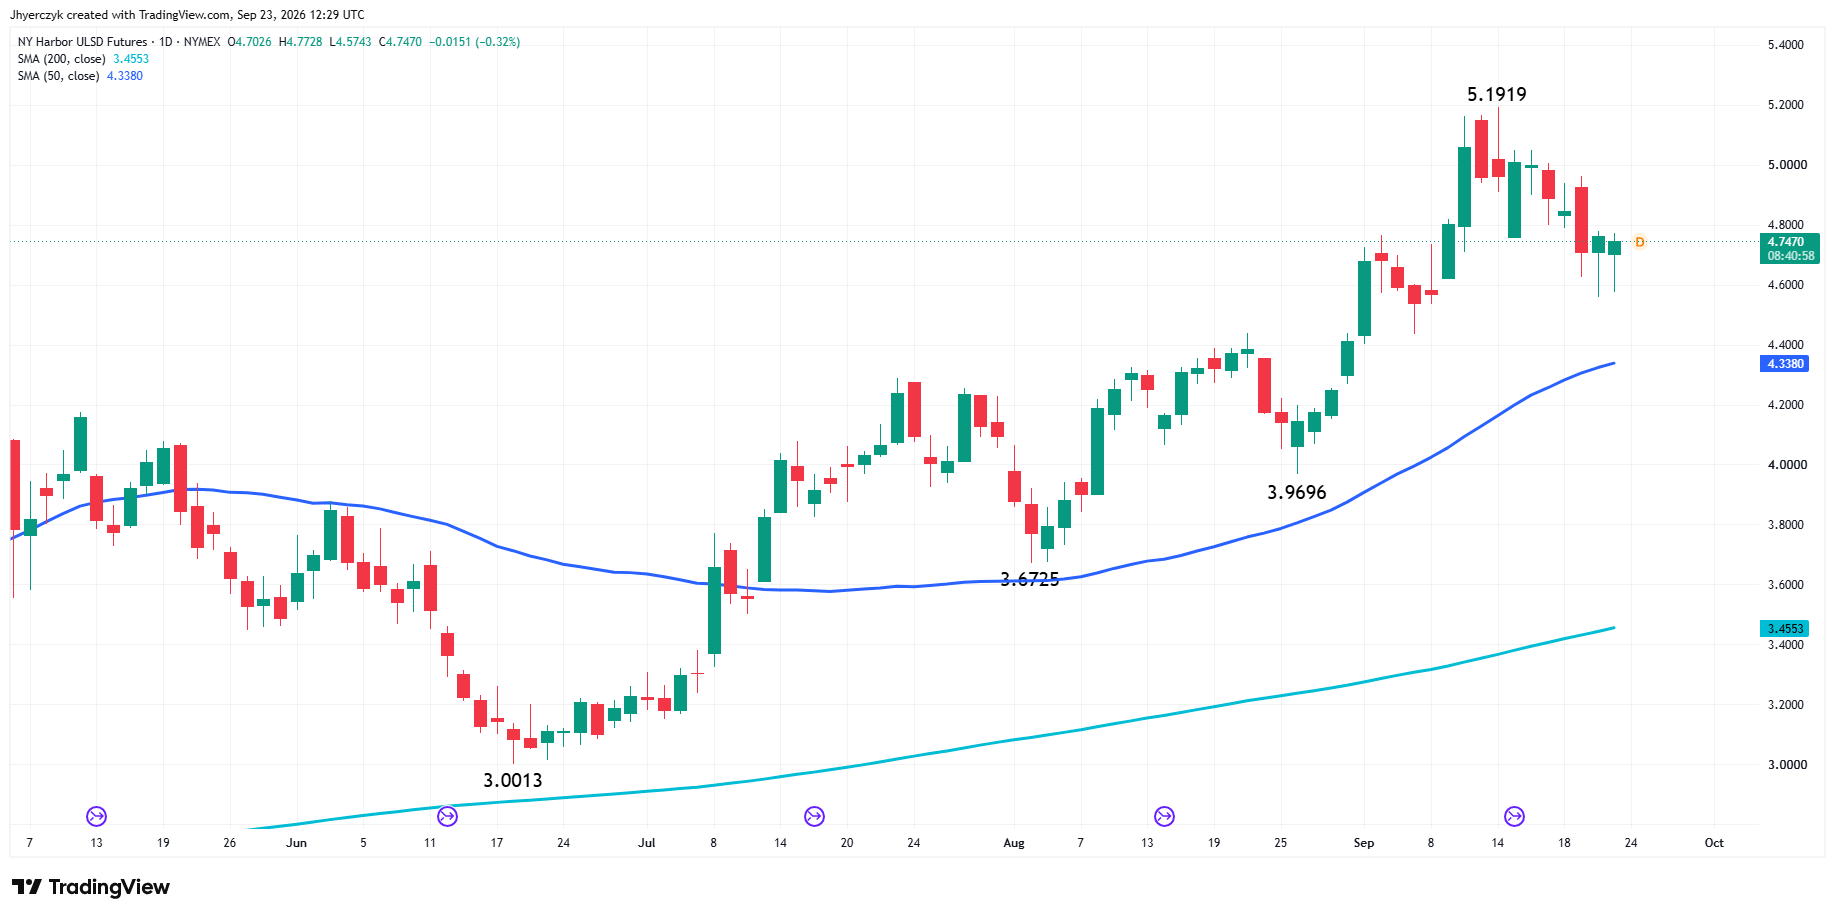
European low-sulphur gasoil hit a record premium to Brent near $95 per barrel. U.S. diesel climbed from roughly $4.60 per gallon in early July to about $6.30 by mid-September. Crude started pulling back from last week’s highs. The diesel chart kept going.
Europe has relied on U.S. diesel and jet fuel since the Middle East disruptions cut into the usual flow of product. President Trump said he supports restricting diesel exports to bring down domestic prices. The policy is not in place. The threat alone keeps the premium elevated.
A ban could keep more product inside the United States. It could also pull barrels away from Europe at record premiums. That does not solve a shortage. It moves it.
NY Harbor ULSD futures are near $4.75 per gallon, down slightly on the day. The contract reached $5.1919 last week. The 50-day moving average is $4.338. Diesel pulled back from the high. The larger uptrend has not been damaged.
The crude market can get relief from another Saudi cargo. The diesel market needs a refinery barrel. Those are two different problems on two different timelines.
The Inventory Charts Are Telling Two Stories
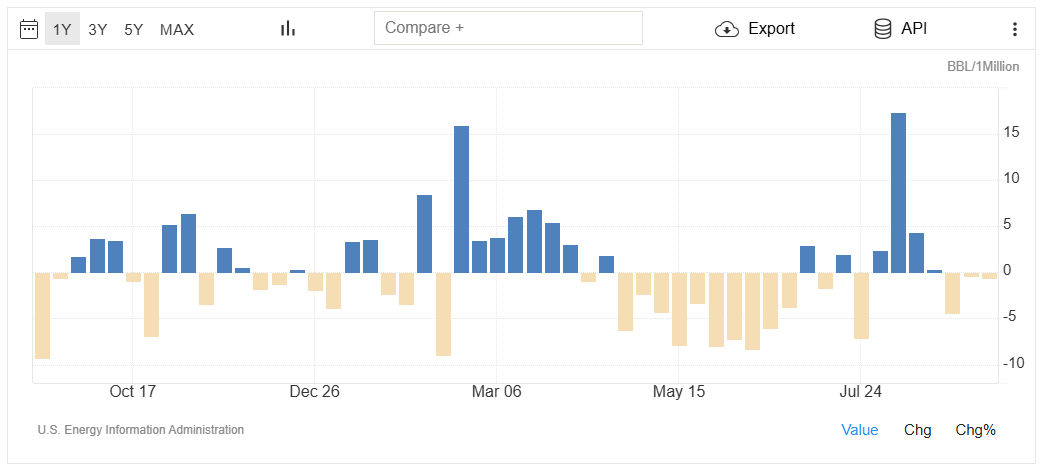
API data released Tuesday showed a 1.8 million barrel increase in U.S. crude inventories for the week ended September 18. Traders had expected a decline. The official EIA report is due at 14:30 GMT Wednesday.
Inventory changes have been uneven all year. Draws show up. Then a large build wipes out the story. The latest build fits what crude is doing this week. Higher Gulf flows and commercial supply adding at the same time.
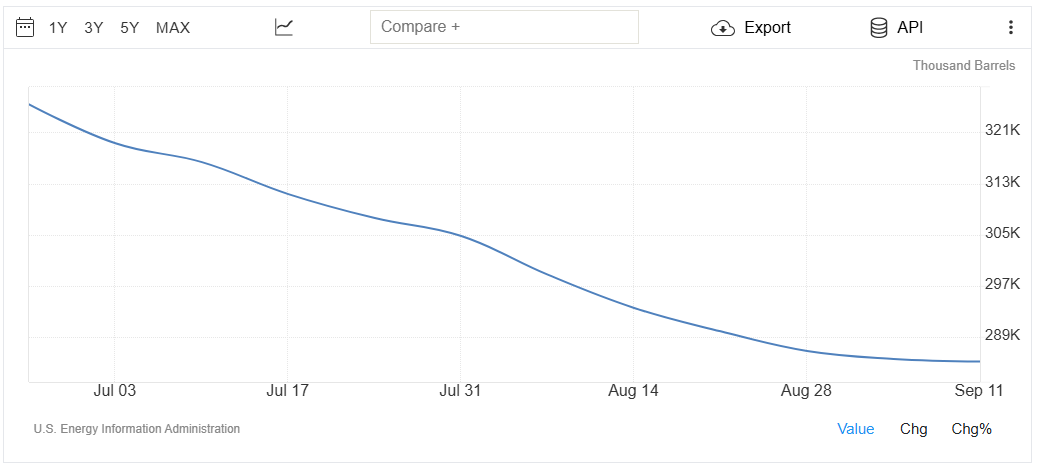
The Strategic Petroleum Reserve is going the other direction. SPR inventories slid from about 325 million barrels in June to roughly 285 million in September. Commercial supply can add while the strategic reserve keeps shrinking. One chart is the short-term supply. The other is the cushion behind the market. The EIA number at 14:30 GMT tells the next chapter on the commercial side.
Trump Put Escalation and Diplomacy on the Same Screen
Trump warned Tuesday that he could escalate the conflict if no deal is reached. He also said his envoys had productive talks with Iranian mediators. The market is trading both headlines at the same time and the crude price reflects the confusion.
Brent can trade below $100 while diesel stays above $6 per gallon. That is what the market is doing Wednesday. Crude buyers are getting more supply options from Saudi Arabia, Iraq, and the pipeline. Refiners and diesel buyers are still paying for the shortage that crude relief has not touched.
What to Watch
The EIA report at 14:30 GMT tests the API signal. The UNGA sessions in New York are the headline risk on crude. Trump is talking escalation and productive talks in the same week. One Iran report already sent Brent to $97.36 Tuesday. The next one could send it back above $101.
ULSD pulled back from $5.1919 and is still well above the 50-day. Gasoil’s premium to Brent is at a record. The crude market is getting supply relief from the Gulf. The diesel market has not responded to any of it. An export ban threat on top of a supply shortage is the reason the product side is not following crude lower.
Brent needs $101.56 back to show the correction is turning. Buyers showed up near $97.27 Tuesday. Below that, $93.38 and the 50-day at $91.09 are where the uptrend gets tested. WTI has not recovered $93.81 and the $87.39 to $86.87 zone is where the correction gets tested if selling continues. The main trends are up on both contracts. The levels are doing the work until something forces a direction.
If you’d like to know more about how to trade crude oil, please visit our educational area.