NASDAQ 100 Technical Analysis
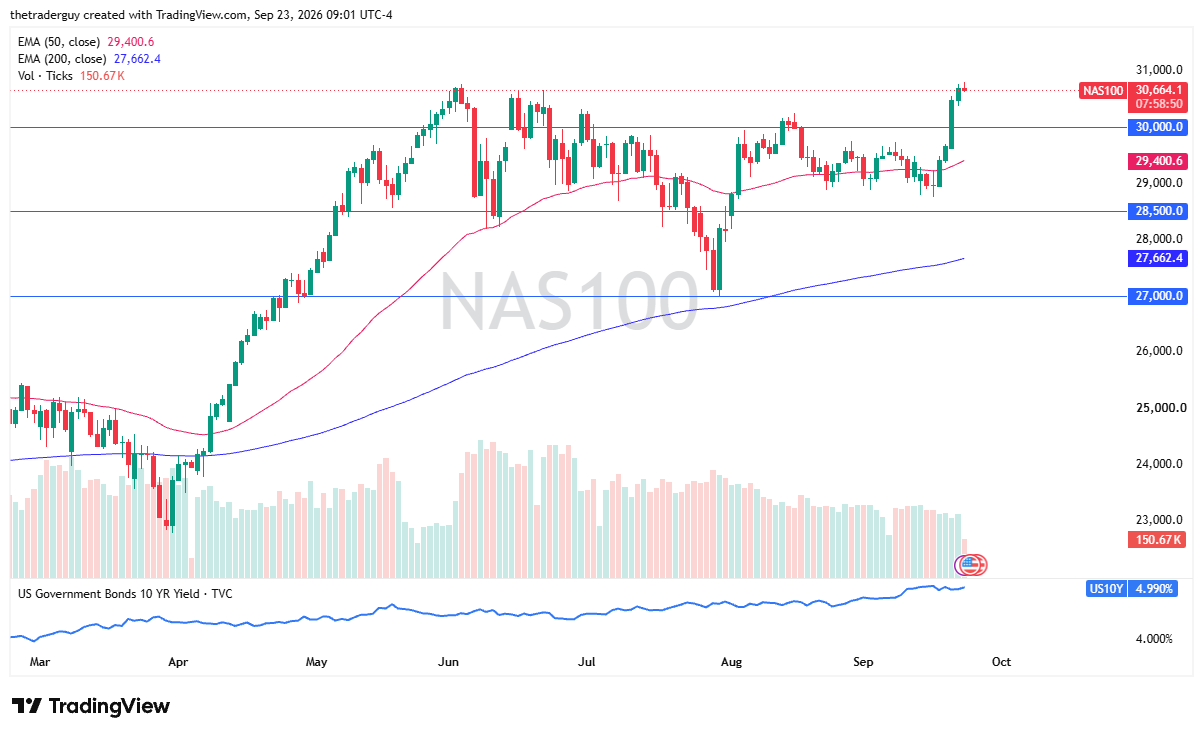
The Nasdaq 100 looks a little bit tired in the early hours of Wednesday trading. Overnight, it looks like the buyers tried to push it a little bit to the upside but did not really hang on to those gains. The new all-time high will have to wait, but short-term pullbacks, more likely than not, will attract attention. After all, this has been an extraordinarily bullish market.
The 30,000 level underneath could be a bit of a floor as well, so I am paying close attention to that. If we could clear 31,000, that would be a major win for the buyers. That being said, with interest rates sitting right around 4.99% on the 10-year yield in America, it is a bit impressive that we are all the way up here.

Dow Jones 30 Technical Analysis
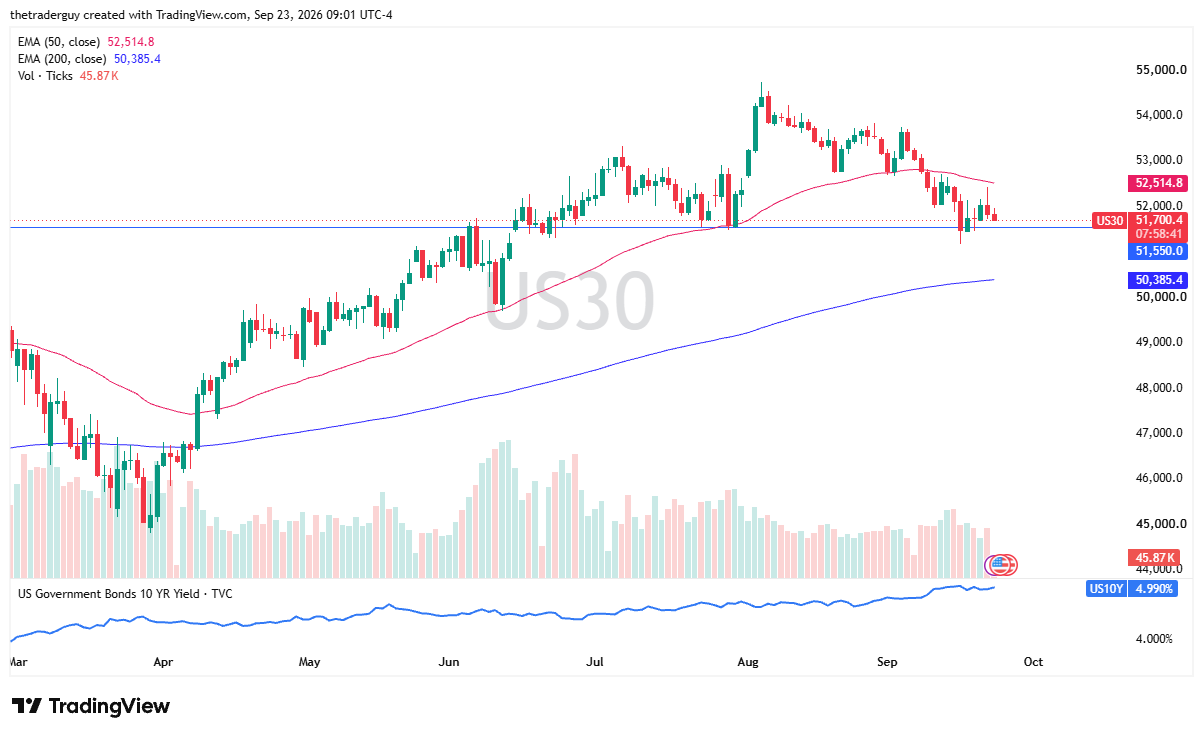
The Dow Jones 30 tried to rally a little bit early in the session, but then gave back gains, and the 51,550 level continues to be a bit of a short-term floor. If we were to turn around and break to the upside, then the 50-day EMA could be targeted near the 52,500 level.
Ultimately, this is a market that is trying to find its floor. Whether or not it does remains to be seen, but I am watching this area very closely because if we get a sharp move in one direction or the other, it could tell us where the next 500 points come from.
S&P 500 Technical Analysis
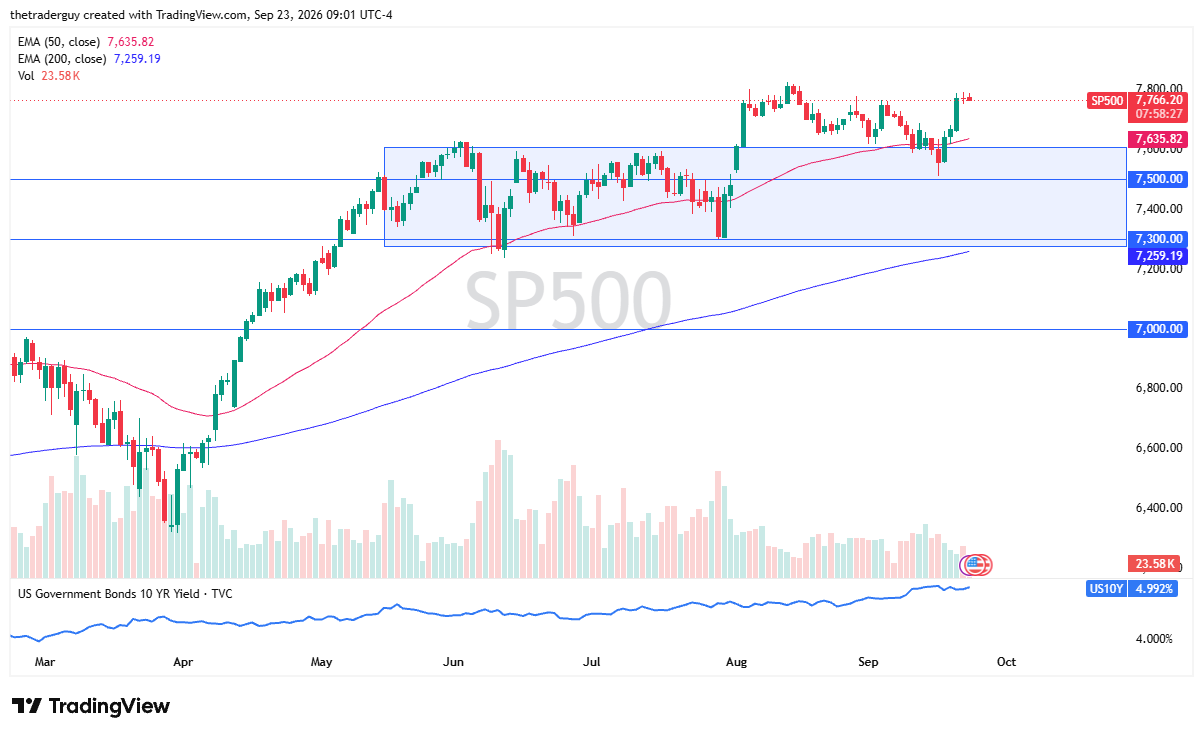
The S&P 500 looks like it is going to just meander like it did the previous session, just below the crucial 7,800 level. If we can break above 7,800, then we are probably on our way to an all-time high.
Short-term pullbacks, I still think, offer buying opportunities in this market, as it is bullish. Again, it is like the Nasdaq in the sense that it just will not drop with the massive interest rates out there. All things being equal, this is a market that I remain bullish on, but I also recognize that we should continue to see a little bit of value on these drops until something drastically changes.
S&P 500 Price Forecast
Every new S&P 500 analysis as it publishes, today's technical signal and key levels, live price — on one page.
See all S&P 500 forecastsIf you’d like to know more about chart patterns and how to trade them, please visit our educational area.