



Gold (XAU) trades near $4,330 as the S&P 500 holds near a record high. AI stocks have supported the rebound in the US stock market, but gold has struggled to keep pace. High real yields add pressure after the rate hike in September by the Fed. The gold-to-S&P 500 and Dow-to-gold ratios show whether that balance is shifting. I think that gold must hold $4,000 to avoid a deeper correction. This article presents the market developments, US stock market ratio analysis and price levels that could shape the next move in gold.
S&P 500 Near Record as Fed Rate Hike Weighs on Gold
U.S. stocks started the week with a strong rebound. The S&P 500 gained 1.49% on Monday as oil prices dropped and investors bought AI shares. This rally narrowed on Tuesday.
Oil prices supported the stocks on Monday and Tuesday. Brent oil briefly dropped below $100 a barrel on Tuesday as investors saw signs that more crude could reach the market from the Middle East. A lasting drop could ease inflation fears and push bond yields lower. That would also help gold. But the conflict remains unresolved so another increase in oil could quickly revive concerns about interest rates.
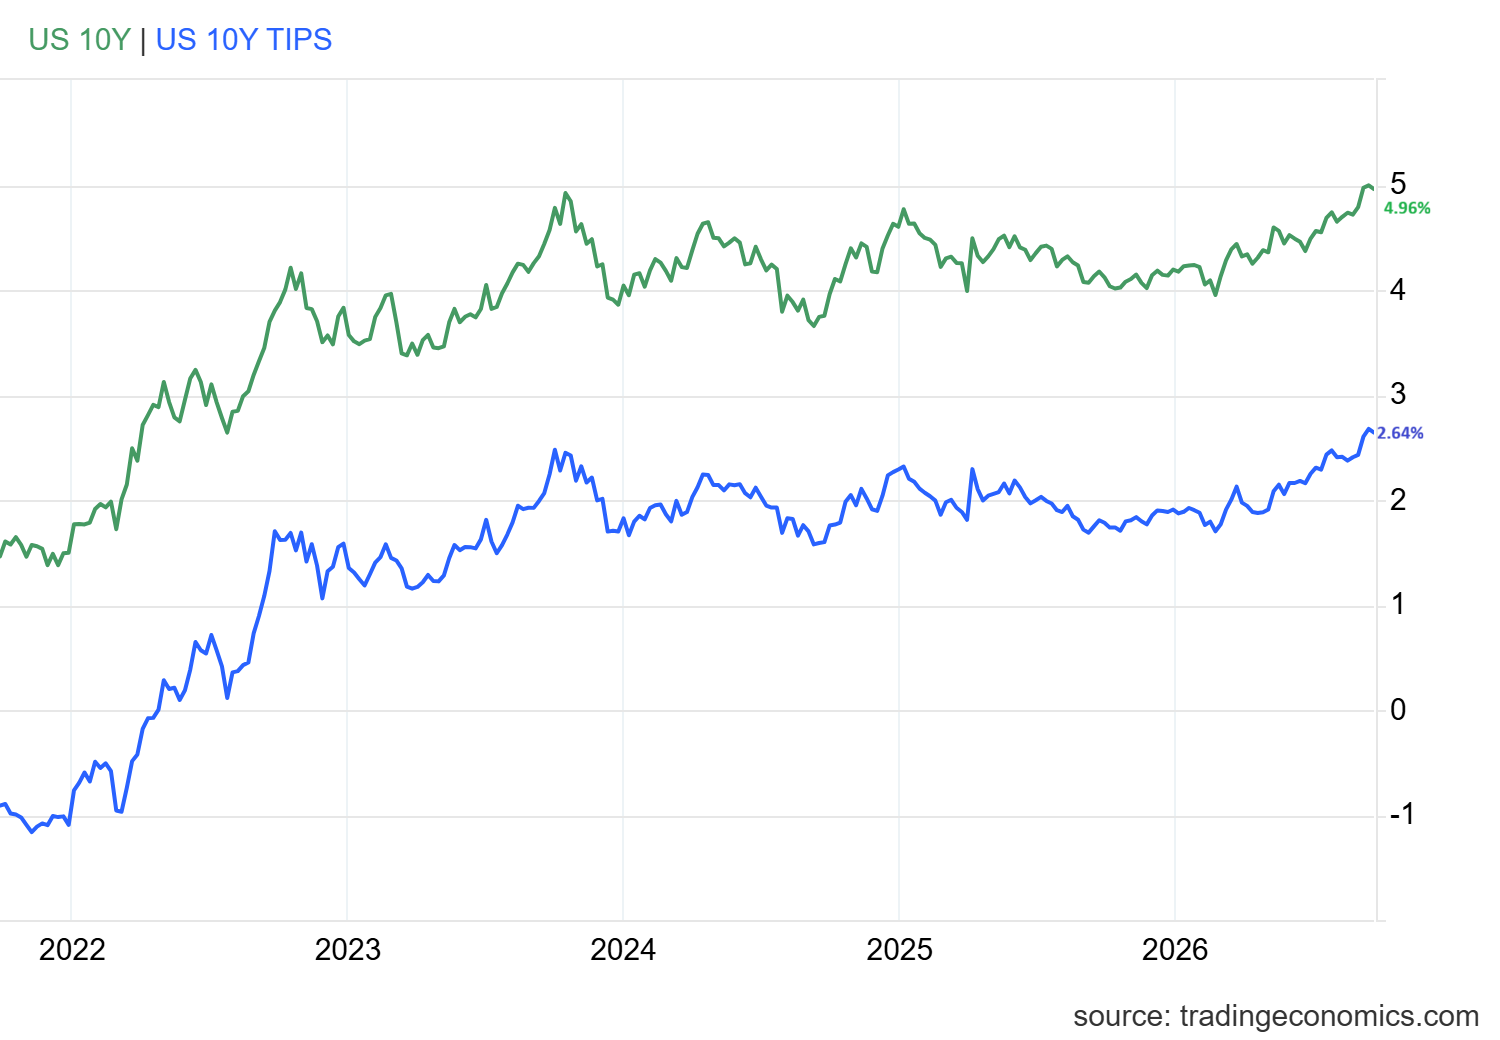
The concerns about the interest rates remain a challenge for gold. The Fed raised the policy rate by a quarter point to 3.75%-4.00% on September 16. Its median year-end projection suggests roughly one more increase if the economy develops as per expectations by the officials. The 10-year Treasury yield stood at 4.96% and 10-year real yield at 2.64% on Tuesday. Both have eased since Friday but bonds still offer the return that gold cannot provide.
Richmond Fed President Tom Barkin said on Tuesday that spending and investment remain strong while inflation poses greater risk than unemployment. He left the need for further hikes open.
This means that strong stocks may keep demand healthy and give the Fed reason to stay cautious. But the demand for gold remains strong. The World Gold Council reported positive gold ETF flows across regions last week. The question is now whether gold can regain ground relative to stocks despite the pressure from interest rates.
Gold Price Forecast
Every new Gold analysis as it publishes, today's technical signal and key levels, live price — on one page.
See all Gold forecastsGold vs. S&P 500 Ratio: 0.70 Breakout Still Unconfirmed
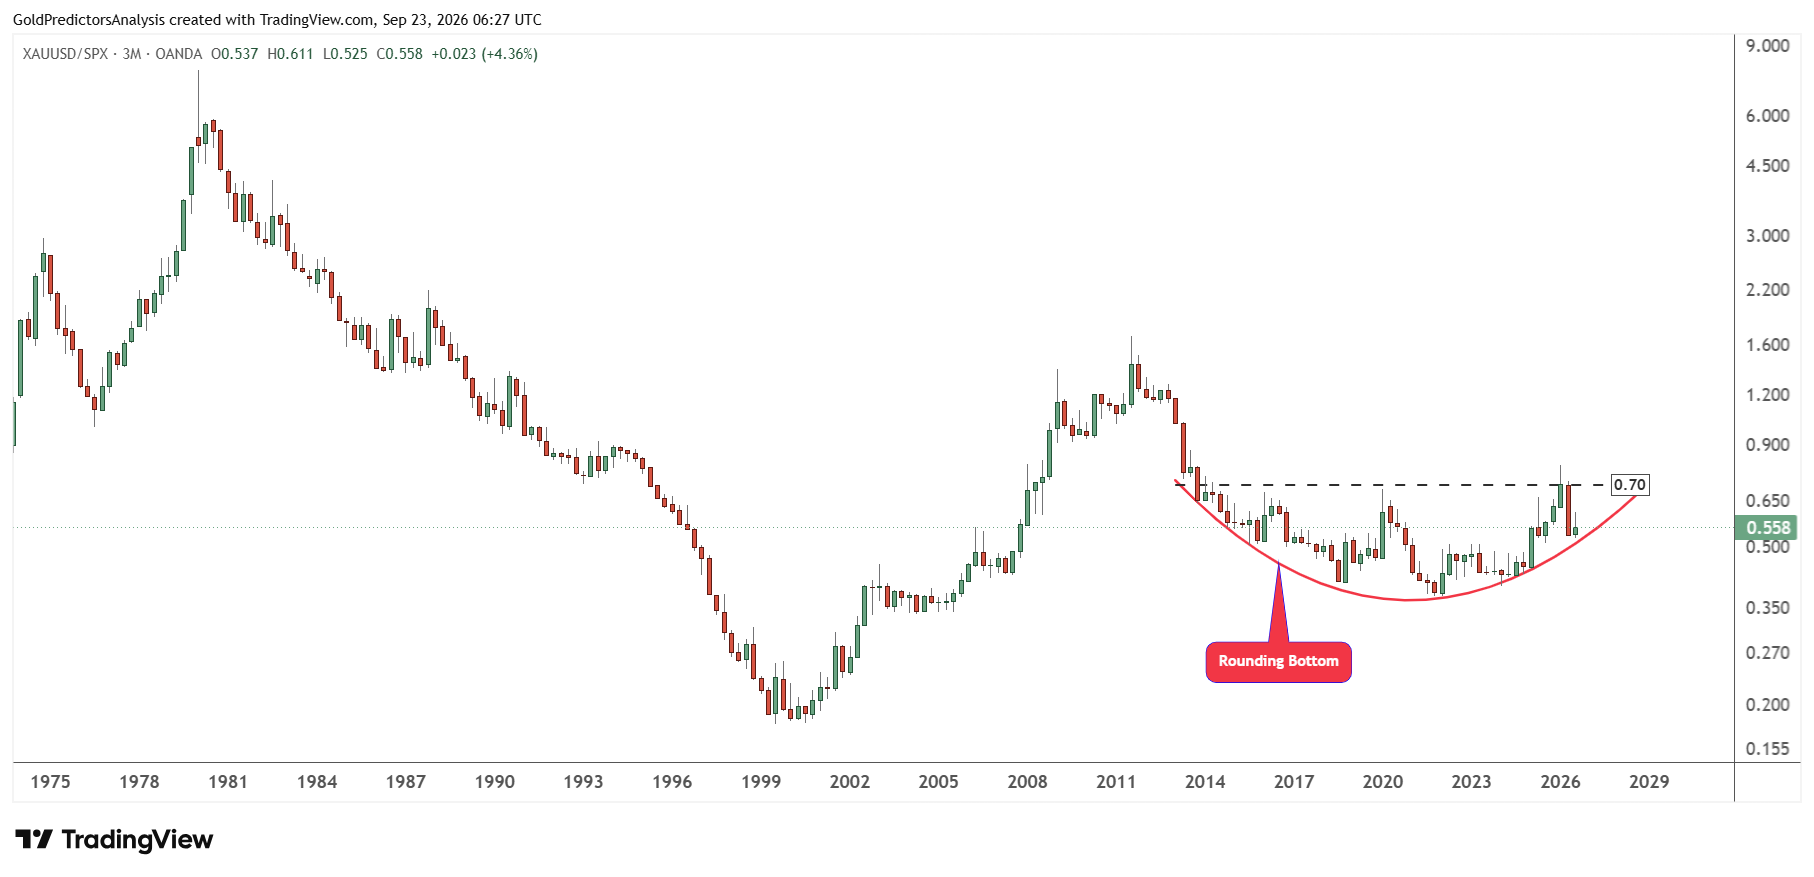
The gold to S&P 500 ratio helps show which market is gaining ground. The ratio chart below shows that it trades near 0.558 after hitting the key level of 0.70. A broad rounding bottom has formed since 2014 but gold needs a sustained move above 0.70 to confirm a positive shift.
The recent rebound in stocks has kept the ratio below 0.70 so Gold has yet to confirm that it is gaining ground against the S&P 500.
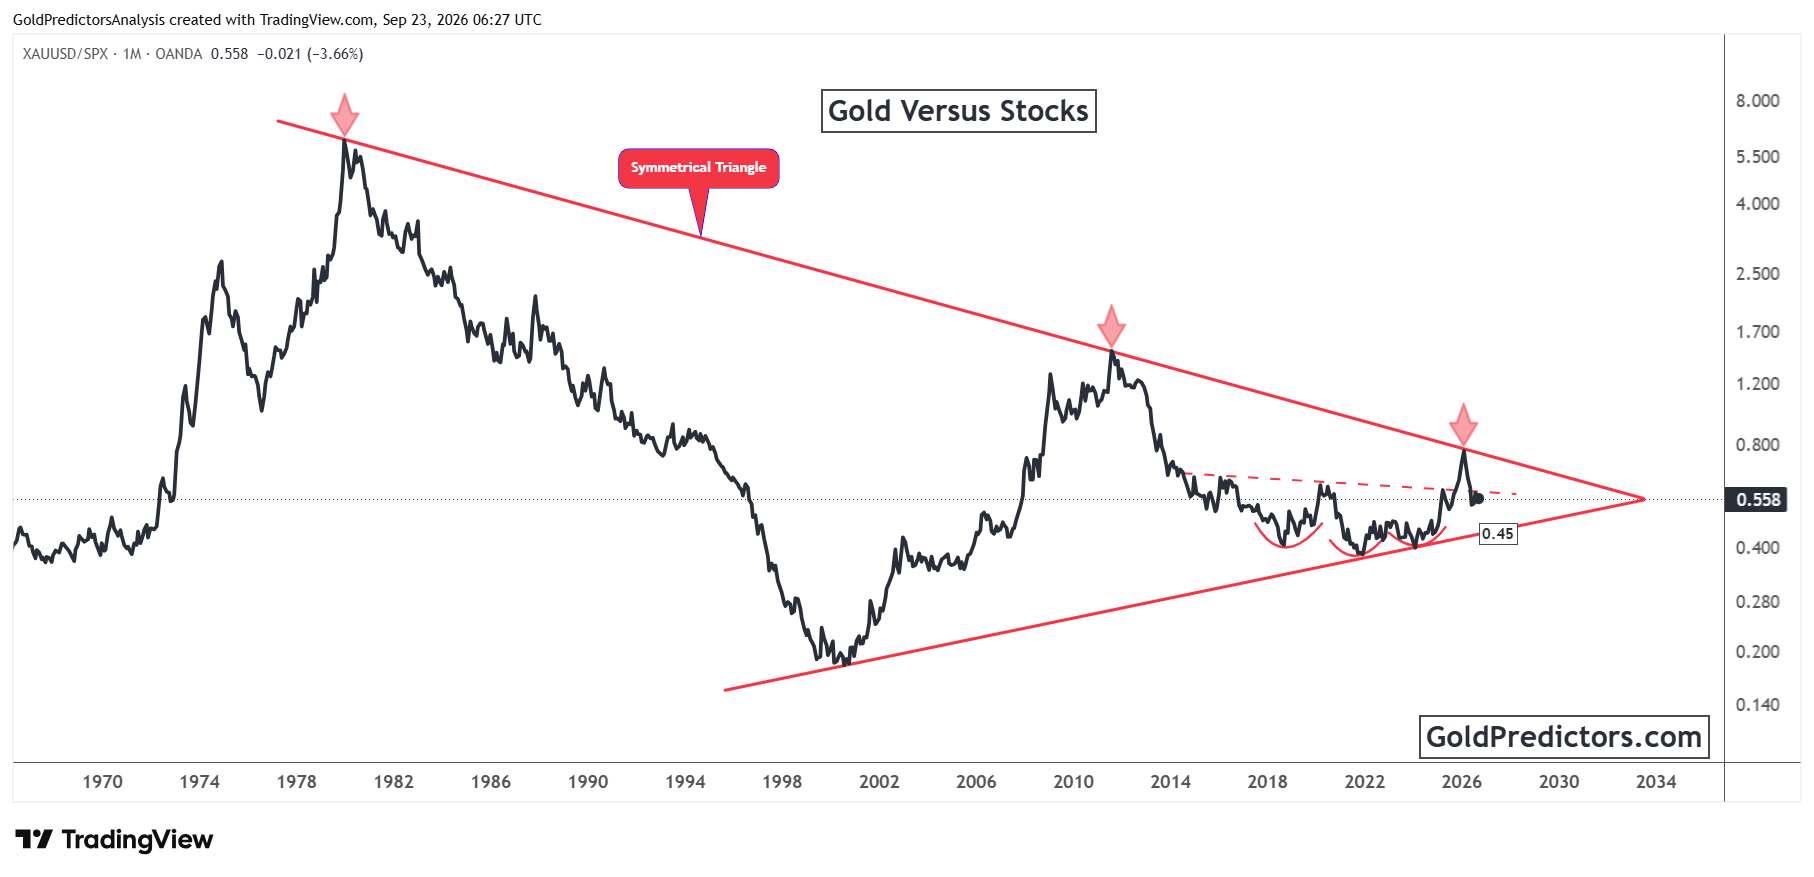
The monthly chart for gold to S&P 500 also shows the importance of 0.70, but it also calls for patience. The ratio sits within a much longer triangle between a falling upper trendline and rising support near 0.45.
The recent rally in the ratio stopped below the upper trendline. A break above 0.70 would strengthen the outlook in the short term. Gold would still need to clear the longer trendline to confirm broader shift against stocks.
For now, gold has held above the rising support line of the triangle but it has not reclaimed clear leadership. A drop below 0.45 would favor the S&P 500 in relative terms but a break above 0.70 would favor gold.
Dow Jones-to-Gold Ratio: Why 14.50 Matters
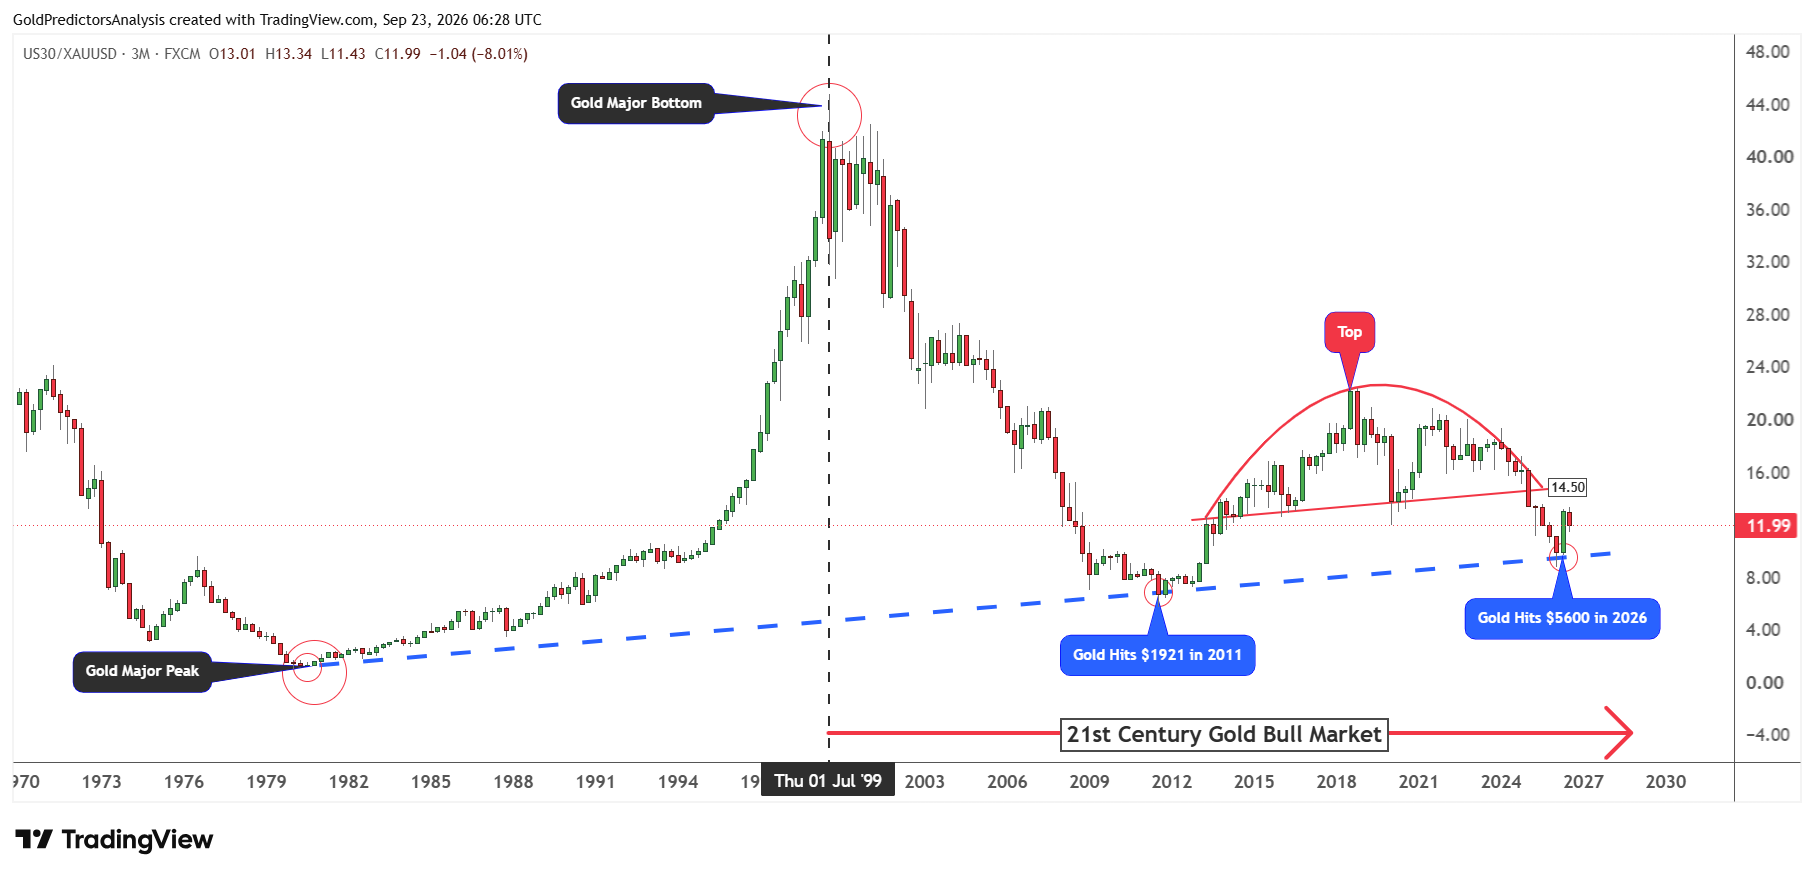
The Dow Jones to gold ratio gives another view of how stocks are performing against gold. The chart below shows that the ratio broke below the neckline support of a broader rounded top near 14.50.
The ratio has since bounced to 13.34 in September. This shows that the Dow has regained some ground against gold as the price pulled back from the record high.
The rebound in the ratio from the long term support does not mean that the Dow will continue to gain strength. The ratio can also rise when the gold price falls faster than stocks. The key level for the ratio is 14.50, whereby a break above this level will suggest that the Dow has stronger relative performance.
The chart below confirms that the bottom in the ratio is formed when the gold price produced a major peak. These bottoms are observed in 1980 and 2011 in the ratio. These bottoms are formed at the same rising trend line.
The recent low in the ratio has similar shape to those of 1980 and 2011. But that history cannot confirm whether gold has reached lasting peak. A sustained move above 14.50 would favor Dow over gold. Another turn down to the blue trendline would favor gold.
Gold Price Forecast: $4,000 Support and $5,600 Resistance
The stock market ratio shows that gold has lost some ground against the stock market, but the price structure for gold remains strongly bullish in the long term.
The monthly chart for spot gold shows that the price hit a record high at $5,600 and corrected lower on profit-taking toward the support zone around $4,000. This resistance at $5,600 was defined by the ascending channel pattern that stretches back to 2011.
It is interesting to note that the record high at $5,600 in spot gold occurred when the Dow to gold ratio hit long term support at the 8.81 level. The correction in gold from long-term resistance has pushed the Dow to gold ratio higher.
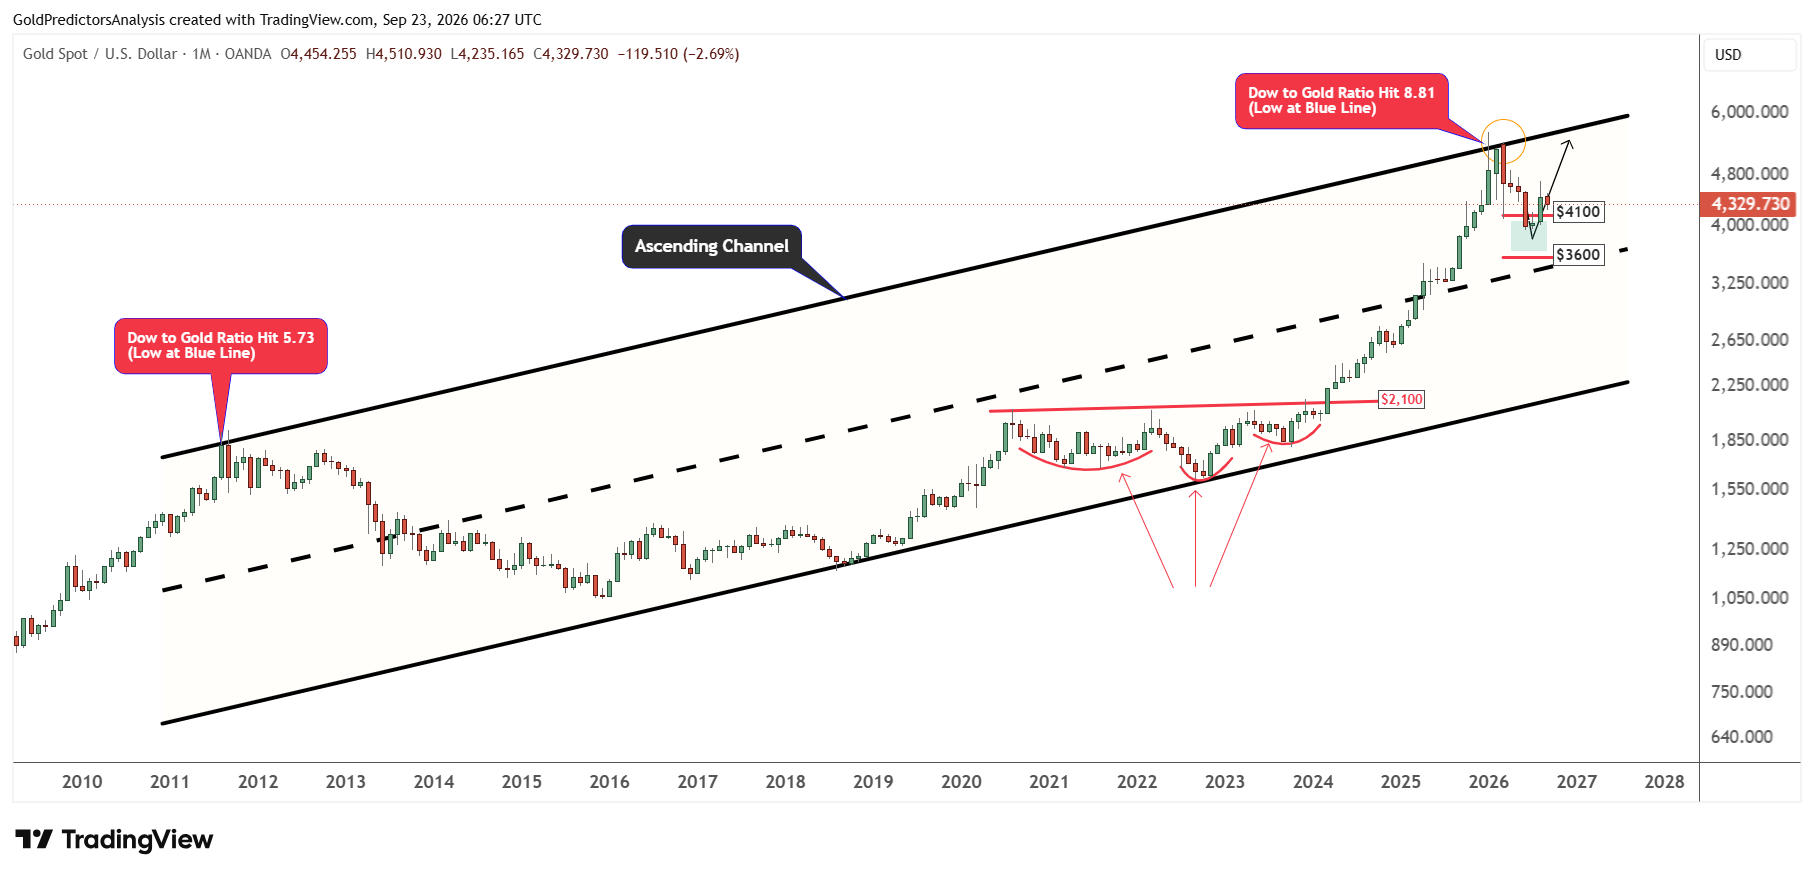
The ascending channel highlights the long-term resistance for gold. The price must break above this area to open the way for higher levels.
A break below $4,000 will offer further downside for gold. The long-term support zone remains between $3,600 and $4,000. A break below $4,000 in spot gold will likely push prices further down towards $3,600.
But the formation of an inverted head and shoulders pattern from November 2020 to January 2024 suggests strong bullish price action in the long term. Therefore, this correction will likely offer a strong pivot point for long-term investors.
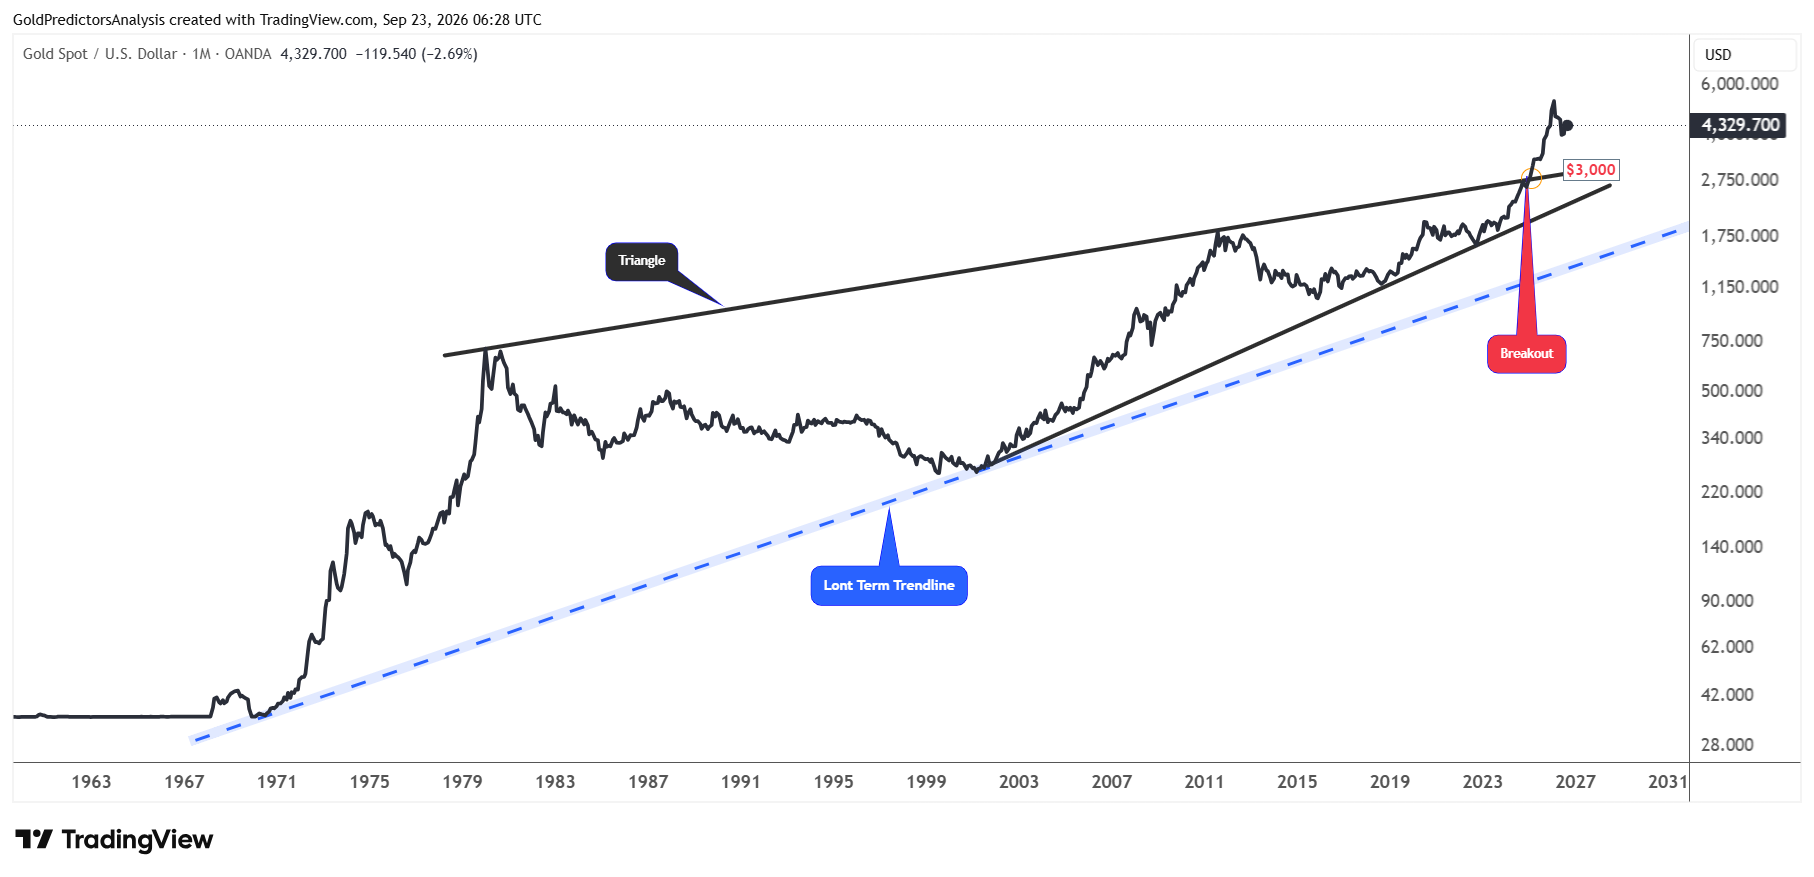
This bullish price structure in spot gold is also evident on another chart below. The chart shows that the price broke out of the triangle pattern in 2025 and sparked a strong surge higher.
Now the price is stabilizing before the next move. Once this correction is over, the next move in the gold market will likely be higher, towards the $6,000 and $7,000 levels.
What to Watch Next
The PCE inflation report for August will be delivered on September 30. The jobs report for September will arrive on October 2. Both reports could change expectations for interest rates at the October 27-28 meeting.
Strong inflation or hiring could keep real yields high and increase pressure on gold. But the softer data could ease that pressure. Oil prices and events in the Middle East also matter because fresh supply shock could renew fears of inflation.
The ratio charts will show whether gold is gaining ground against stocks. A sustained move above 0.70 in the gold to S&P 500 ratio would favor gold. A falling Dow to gold ratio would point the same way. If the Dow to gold ratio rises above 14.50, the Dow would regain ground instead.
Gold shows uncertainty in the short term as the price consolidates in a tight range between $4,300 and $4,530. A break below $4,300 will indicate a further drop to $4,000. However, a break below $4,000 will indicate further downside towards $3,600. A break above $5,600 is needed to push gold prices toward the $7,000 level in the long term.
Read more: Fed Hike Bets Cap Gains in Gold and Silver as Oil Falls