
Oracle Slides as 2007-Era Yields Put the AI Trade Under Pressure
Oracle dropped more than 5% Thursday after Bloomberg reported the company invoked a force majeure clause on a data center project in New Mexico. Oracle said the project remains on schedule. The stock sold off anyway. The 10-year Treasury yield is near 5.15%, the highest since July 2007. The 30-year reached 5.446%, a level last seen in 2004. October rate-hike odds are above 70%. Oracle gave sellers a company-specific reason to hit the AI trade. The yield market was already giving them a market-wide one.
At 15:02 GMT, the Nasdaq Composite Index is trading 26,777.42, down 158.61 points or 0.59%. The session high is 26,820.64 and the low is 26,717.17. At 14:57 GMT, Oracle is trading $137.14, down $7.42 or 5.13%. The session high is $139.30 and the low is $133.48.

Daily Nasdaq Composite (IXIC) Technical Analysis
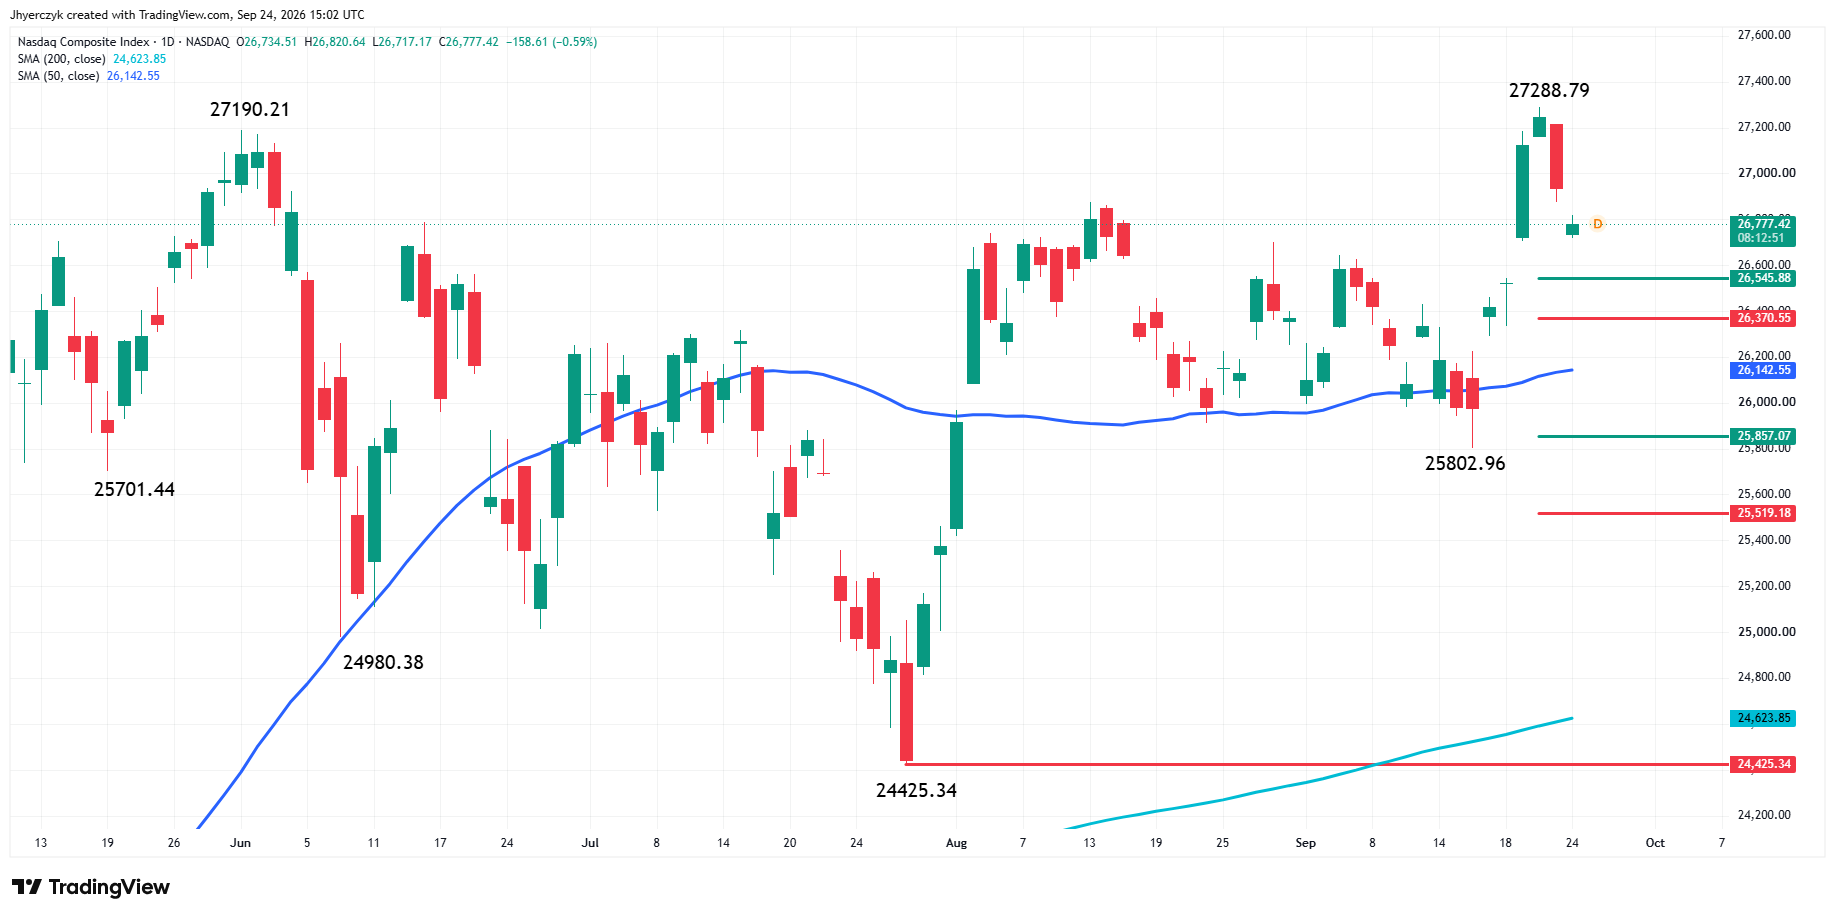
The Nasdaq Composite is edging lower as we approach the mid-session on Thursday. The main trend is up according to the daily swing chart. A trade through 27288.79 will signal a resumption of the uptrend. The main trend will turn down on a break through 25802.96.
The new short-term range is 25802.96 to 27288.79. The next downside target is its retracement zone at 26545.88 to 26370.55. Trader reaction to this zone is likely to determine the next major move.
Since the main trend is up and the index is trading on the strong side of the 50-day moving average at 26141.74, buyers could show up on a pullback into the retracement zone. If this move creates enough upside momentum, we could see a possible retest of the all-time high at 27288.79.
If buyers fail to emerge and sellers continue to press the index, the 61.8% level at 26370.55 could fail. This could help extend the break into the 50-day moving average at 26141.92.
Dow Jones Price Forecast
Every new Dow Jones analysis as it publishes, today's technical signal and key levels, live price — on one page.
See all Dow Jones forecastsOracle Put a Question Mark on the Data-Center Spending Story
The New Mexico project is being developed by a Blue Owl Capital unit. Bloomberg reported that Oracle sent a letter citing force majeure protection if the project is delayed. Oracle is not trying to leave the project. The stock dropped 5% on the distinction between a delay and a cancellation.
The AI trade has had to answer valuation questions all year. Oracle became one of the names traders bought for data-center exposure. A possible project delay gives holders a reason to lighten up when the 10-year is trading near 5.15%.
The stock does not have to lose the project. Buyers who took offers on the AI story need completed facilities, power supply, chips, servers, and cloud revenue. A delay is not a cancellation. It is still a reason to reduce exposure with the 10-year at 5.15%.
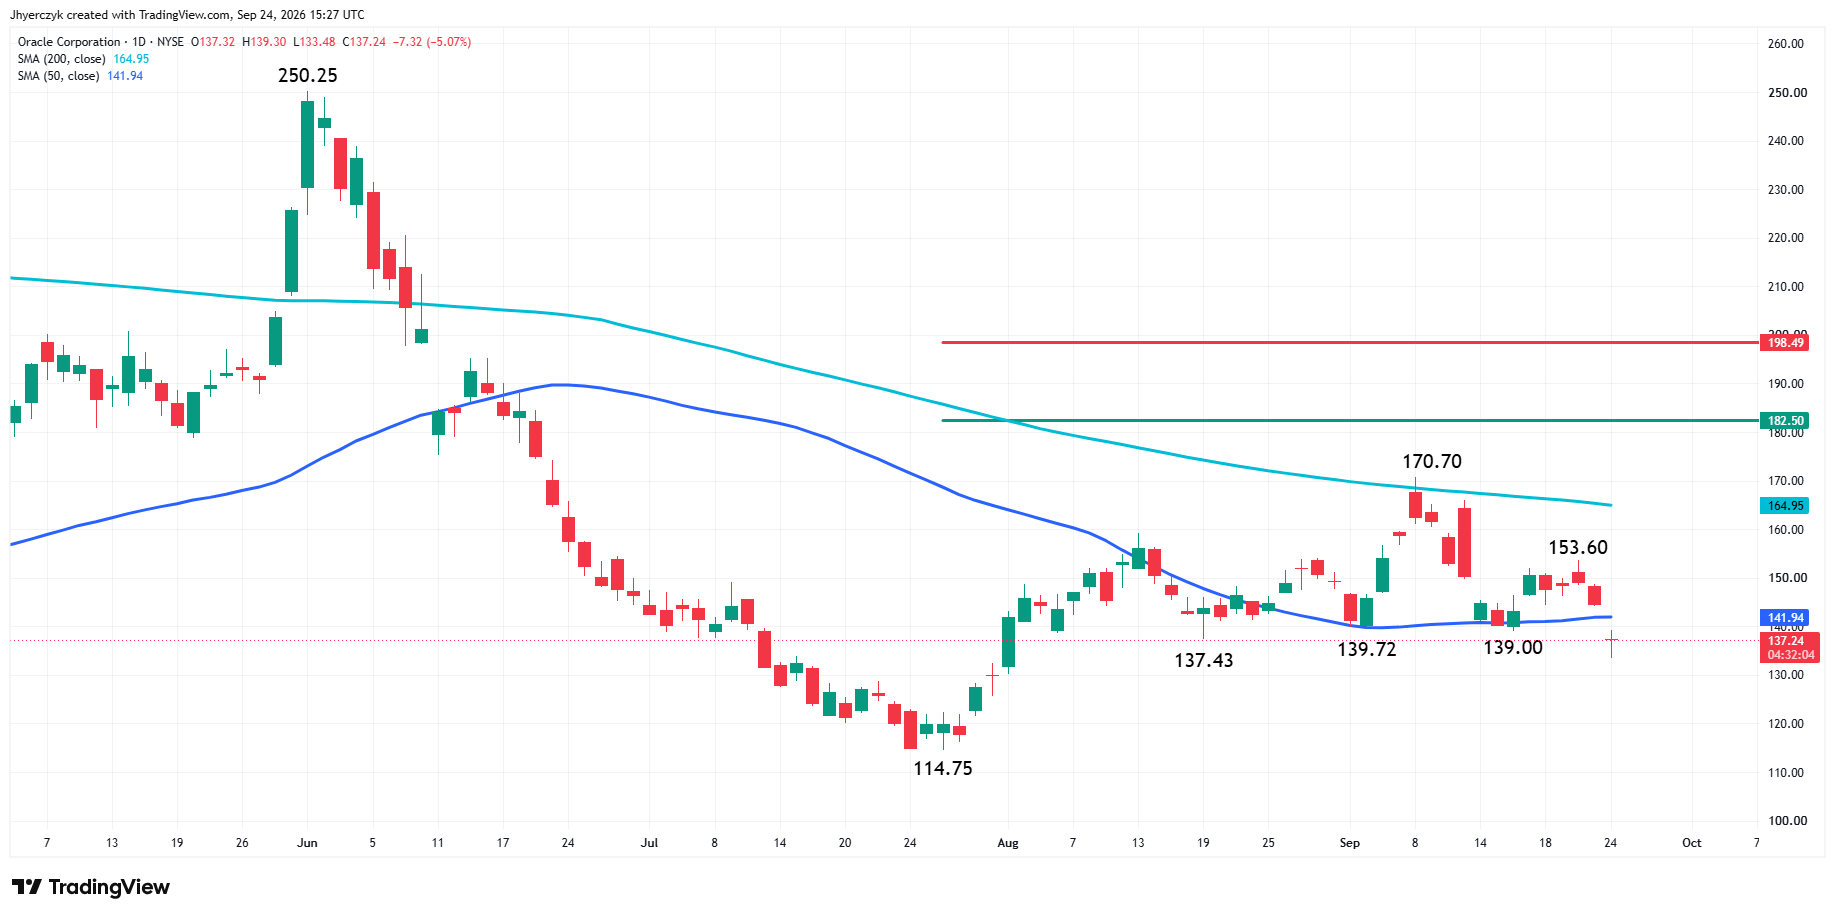
Oracle is under pressure shortly before the mid-session after gapping below the 50-day moving average at $141.94 and below three swing bottoms at $139.72, $139.00 and $137.43.
The lower top at $153.60 and the new lower low confirm the downtrend on the swing chart. The selling began on September 8 at $170.70 when buyers were essentially rejected by the 200-day moving average, currently at $164.95. This is new resistance along with the main top at $170.70.
The new swing top is $153.60. A trade through this level will change the main trend to up. However, buyers are going to have to overcome the 50-day moving average at $141.94, which is new resistance, before we can even consider a change in trend on the swing chart.
If the downside momentum continues, then traders will set their sights on the July 28 main bottom at $114.75. Recapturing the 50-day moving average will weaken the bearish outlook for a test of $114.75.
Yields at Levels Last Seen in 2004 and 2007
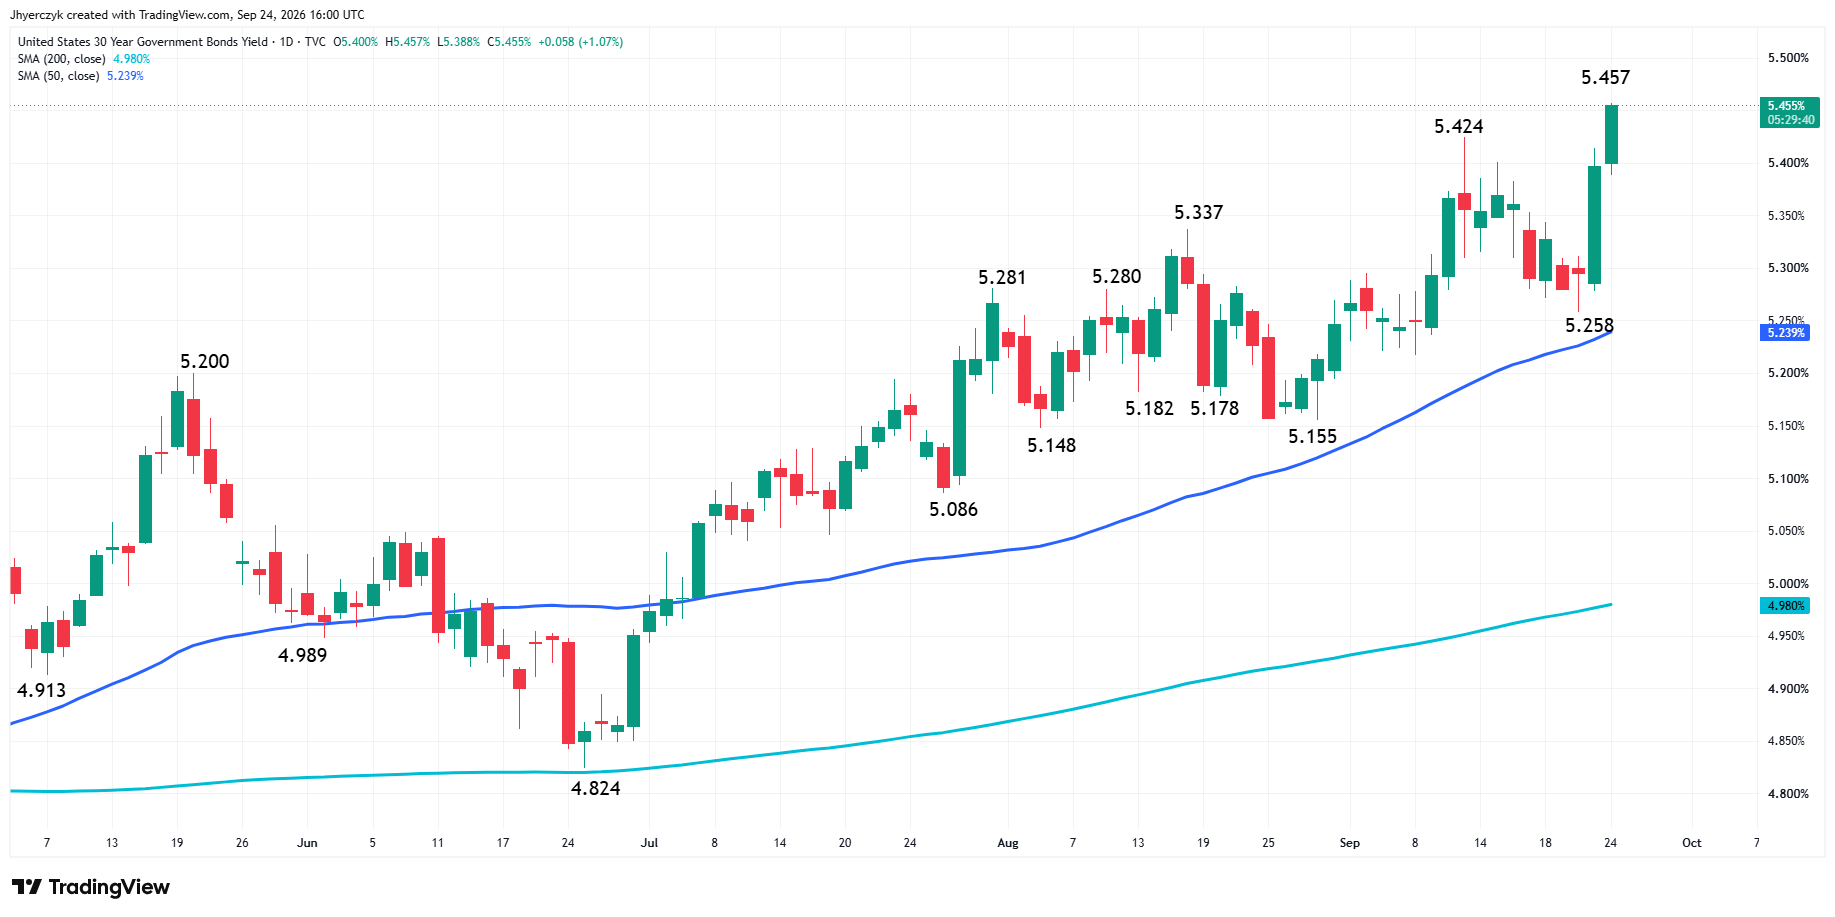
The 30-year Treasury yield reached 5.446% Thursday. The 10-year pushed near 5.15%. The two-year hit its highest level since 2023 earlier in the week. Strong PMI data, hawkish Fed comments, and another rally in crude oil are all feeding the move.
Fed funds futures have October rate-hike odds above 70%, up from roughly 55% a week ago. The rate market has already moved ahead of the meeting.
UBS sees limited energy disruption and an inflation shock that is not broad enough to derail growth. The firm still favors equity upside. It also sees geopolitical risk, inflation, government debt and AI spending as reasons for volatility to stay high.
The Nasdaq Composite Index is correcting from the 27,288.79 record with the entire curve repricing above it. Strong growth helps revenue. It also gives the Fed room to stay tight. The rate market is winning that argument Thursday.
PMI and Oil Are Not Letting the Rate Trade Ease
S&P Global’s manufacturing and services reports showed U.S. activity remains strong. BMO said the numbers leave room for policy rates and Treasury yields to move higher with supply bottlenecks and higher fuel and transport costs still feeding inflation.
Brent crude oil futures are trading around $105 per barrel. West Texas Intermediate crude oil futures are near $93. Higher energy is adding to the rate case. The Nasdaq Composite Index is weaker even though the economic data is solid. That is the trade Thursday. Hot data keeps the Fed in play and hot data keeps yields climbing.
What to Watch
Oracle needs to explain what force majeure means for the New Mexico project. The stock opened lower, fell through its 50-day moving average and reached $133.48. If sellers keep Oracle under $141.94, the market will keep treating this as more than a one-day headline.
The Nasdaq is backing away from 27,288.79. First support is 26,545.88 to 26,370.55. The 10-year is near 5.15%. Brent is around $105. Fed funds futures are carrying October hike odds above 70%. That is why the bid is not following through in technology Thursday.
More Information in our Economic Calendar.