
Gold Is Losing the Bid as the Rate Trade Gets Bigger
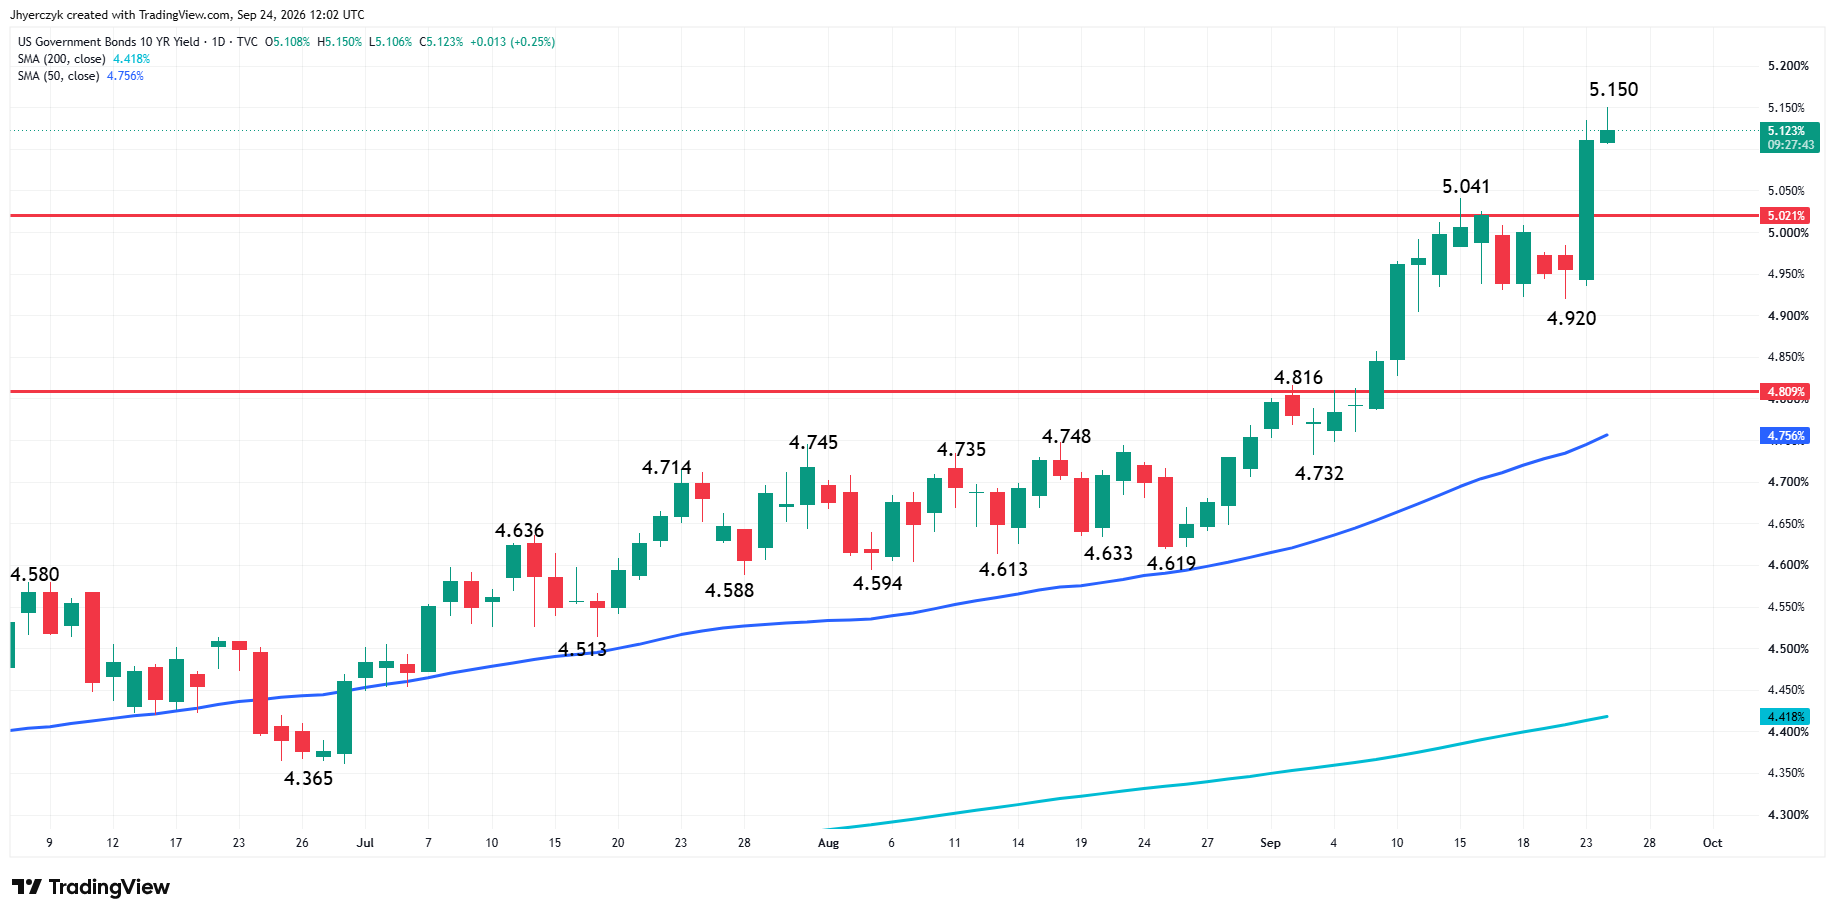
The 10-year Treasury yield reached 5.139% Thursday, the highest since July 2007. The 30-year hit 5.438%, the highest since 2004. The two-year reached 4.897%. Gold had already crossed below its 50-day moving average. Thursday’s yield move is giving sellers another reason to press it.
Hot PMI data pushed October hike odds from 53% Wednesday to 77.5% Thursday. A week ago that number was below 50%. Gold is not getting an inflation bid from higher crude. It is getting sold against the return available in Treasuries.
At 11:34 GMT, Spot Gold is trading $4,261.73, down $25.68 or -0.60%. The session high is $4,303.40 and the low is $4,244.27.

The PMI Reports Pushed October Hike Odds to 77.5%
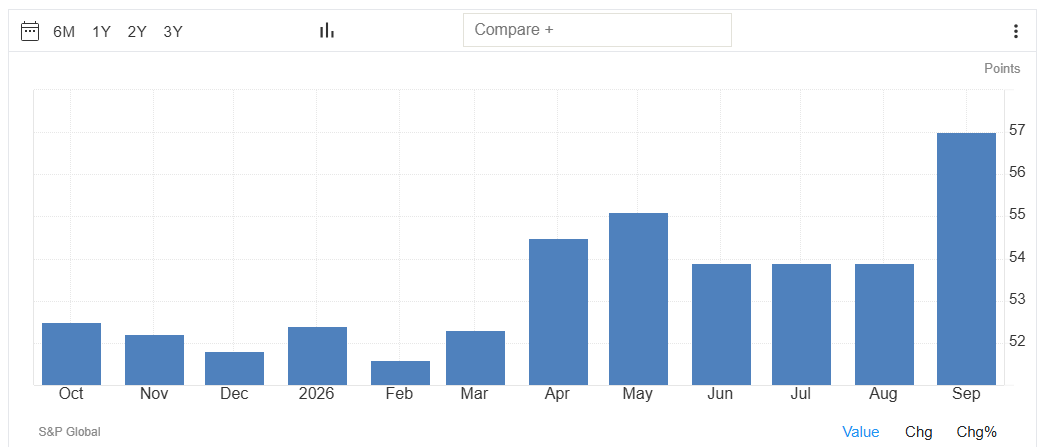
S&P Global’s September services PMI rose to 58.7, the highest in nearly five years. Manufacturing PMI climbed to 56.7, the strongest reading in more than four years. CME FedWatch had the probability of an October rate hike near 77.5% Thursday. That was around 53% Wednesday.
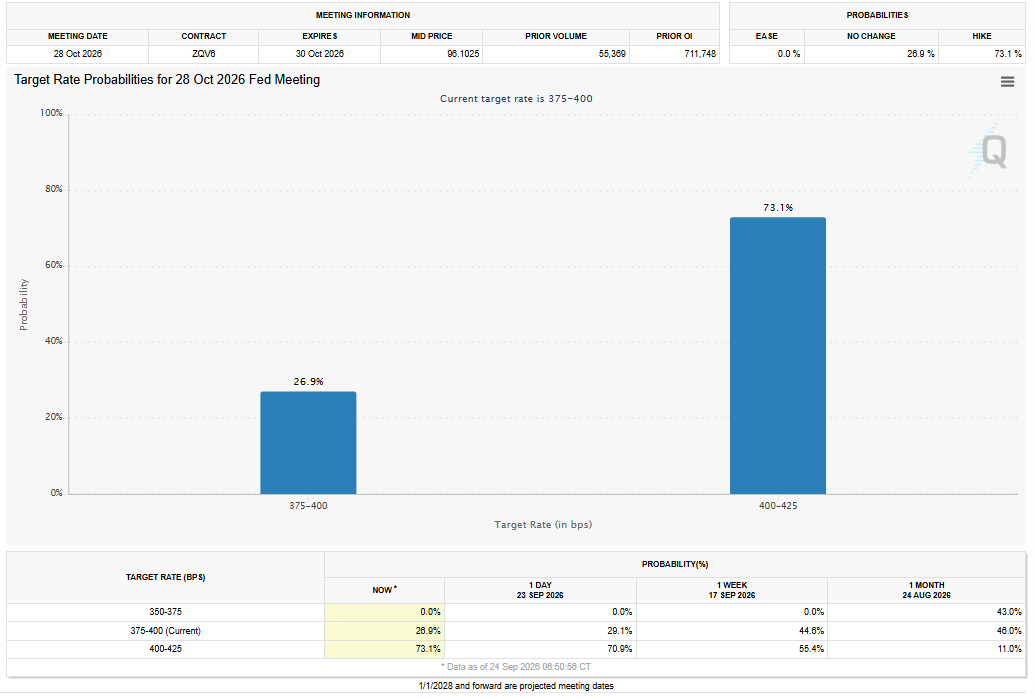
Gold had been trying to stabilize after the September break. Buyers had the Middle East and higher energy prices working for them. The PMI numbers changed what the market was trading. Services PMI at a nearly five-year high with manufacturing running alongside it is not the data that makes the Fed pause. October went from a coin flip to a three-in-four shot in 24 hours. Gold felt every point of that repricing Thursday morning.
Three Fed Officials Confirmed What the PMI Data Was Already Saying
Federal Reserve Governor Michael Barr said further policy adjustments are likely needed to bring inflation to target. Boston Fed President Susan Collins warned that inflation has a greater chance of staying notably above the 2% target. Barr and Collins both spoke Wednesday. New York Fed President John Williams said Thursday it would be reasonable to expect another rate hike by year-end.
Gold Price Forecast
Every new Gold analysis as it publishes, today's technical signal and key levels, live price — on one page.
See all Gold forecastsThe Fed raised 25 basis points earlier this month to 3.75%-4.00%. The PMI data made the case for October. None of the three pushed back on the rate market. Jobless claims and August new home sales are due later Thursday. The 77.5% odds came from PMI data at nearly five-year highs. The employment and housing numbers either confirm that picture or they do not. Gold is trading Thursday morning as if they will.
Oil Rallied and Gold Went Down With It
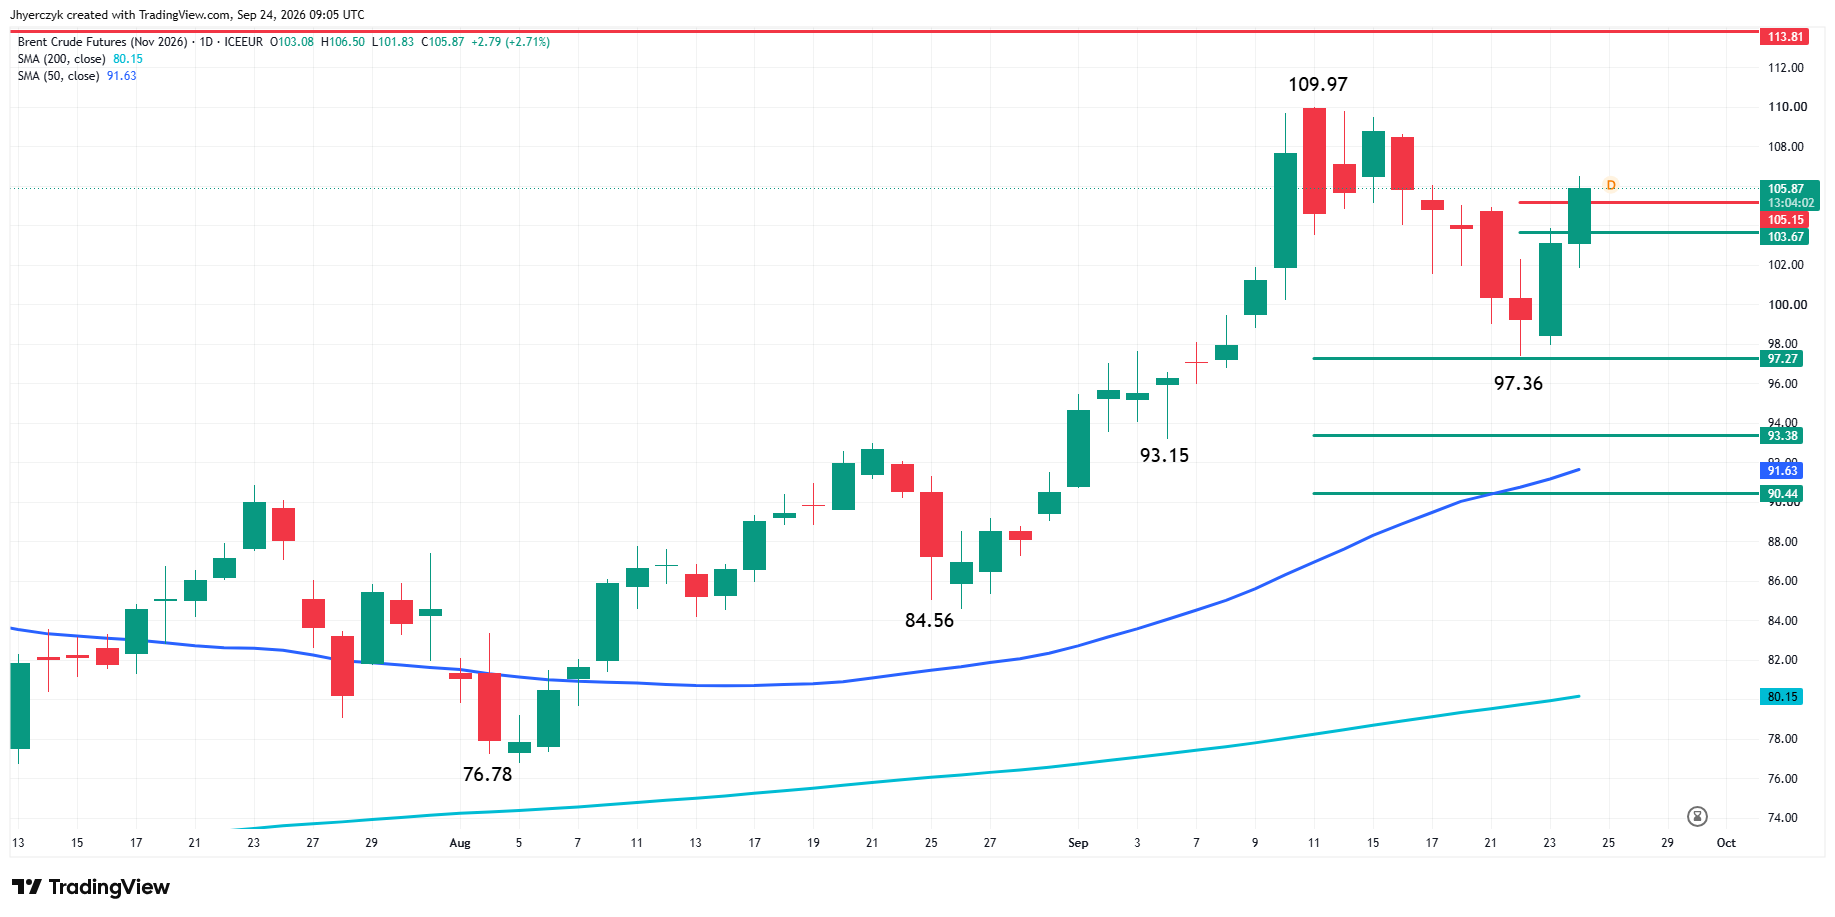
November Brent crude oil futures rose about 2.8% Thursday to $105.95 per barrel. November WTI crude oil futures gained about 2.2% to $94.40. Oil rallied 4% the previous session after U.S.-Iran talks showed no concrete progress. The Strait of Hormuz is not trading as a resolved issue.
The geopolitical premium is back in crude. Gold is going down anyway. Higher crude on top of PMI data at five-year highs on top of a 10-year yield at 5.139% is what is running the session. The crude rally is adding to the inflation pressure that is pushing yields higher. Gold is on the wrong side of that chain Thursday.
The crude trade shifts when the Iran talks shift. A real diplomatic step would take energy pressure down. A failed meeting or another Strait disruption sends crude higher and gives the inflation argument more ammunition. Gold is not going to trade the crude headlines as a safe-haven bid while yields sit at levels last seen in 2007. The yield market has taken that option away.
Daily Spot Gold (XAUUSD) Technical Analysis
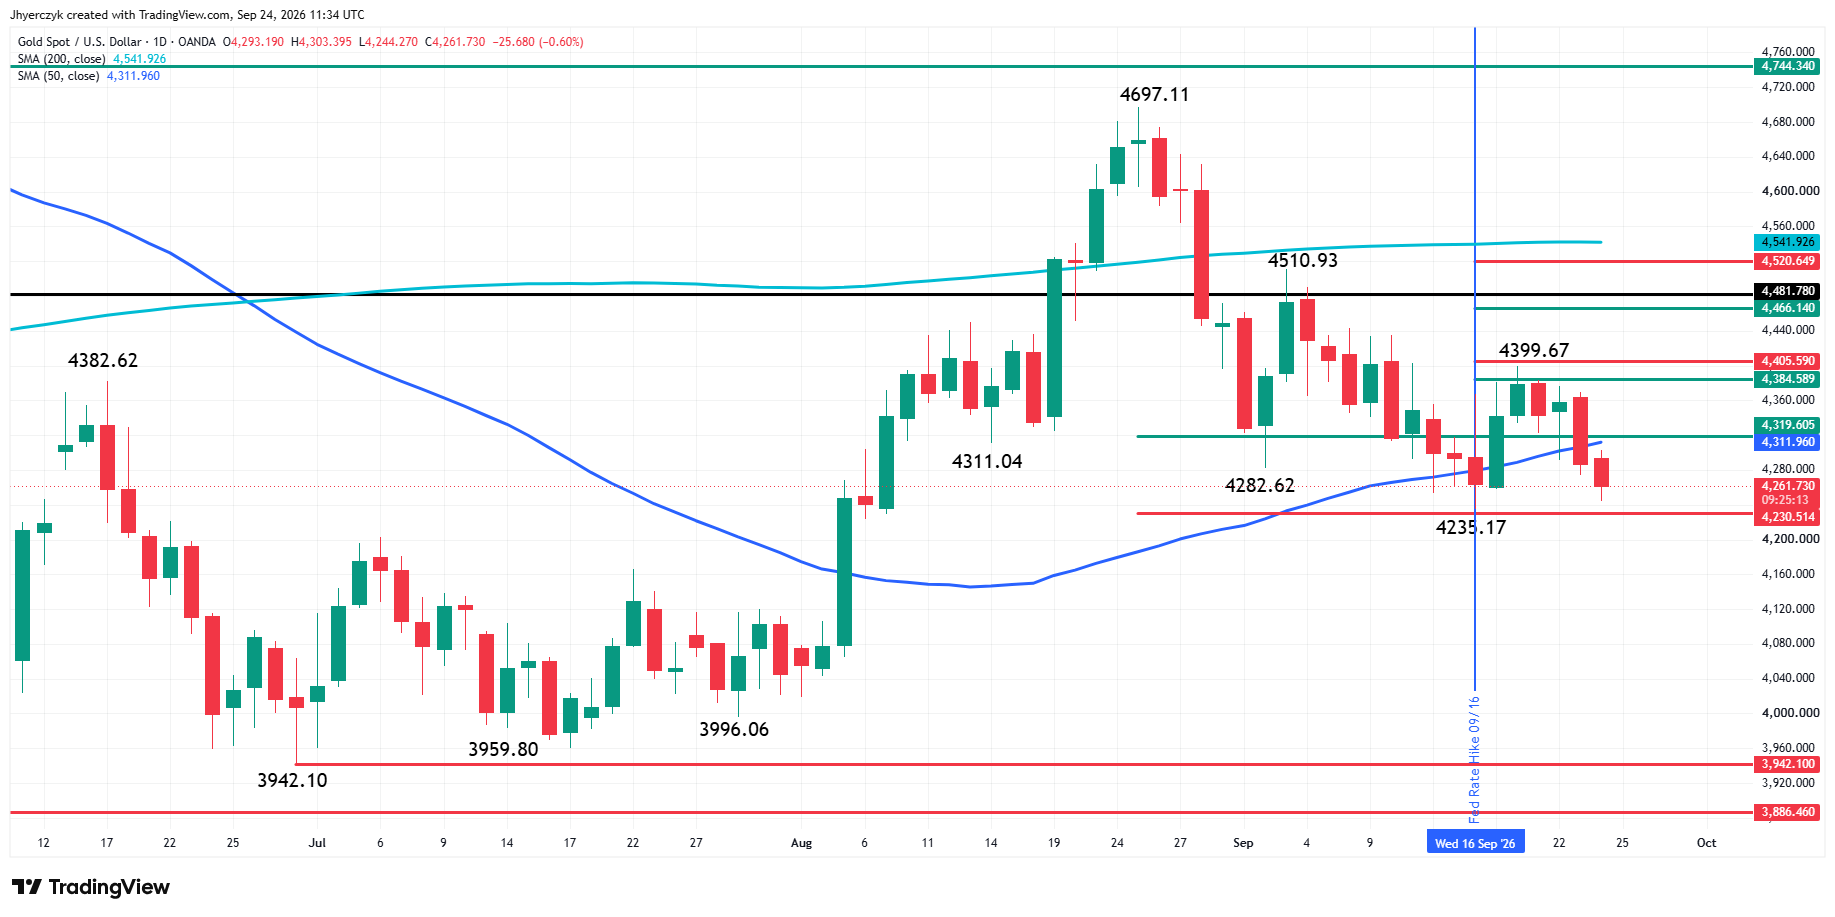
Spot gold is edging lower on Thursday after crossing to the weak side of the 50-day moving average at $4,312.07 the previous session.
The main trend is down according to the daily swing chart. A trade through $4,399.67 will change the main trend to up. Taking out the swing bottom at $4,235.17 will reaffirm the downtrend.
The nearly three-month range is $3,942.10 to $4,697.11. Spot gold is currently trading inside its retracement zone at $4,319.60 to $4,230.51. This area has held as support since early September. However, with the market weakening below the 50-day moving average, the momentum has shifted to the downside, making the swing bottom at $4,235.17 and the 61.8% level at $4,230.51 vulnerable. The latter could be a trigger point for an acceleration to the downside, with $3,996.06 as the next major target.
On the upside, resistance today is the price cluster formed by the 50-day MA at $4,312.07 and the 50% level at $4,319.60.
The downtrend on the swing chart and the break below the 50-day MA are strengthening my downside bias.
What to Watch
The 10-year at 5.139% and October hike odds at 77.5% are running the gold trade Thursday. Barr, Collins, and Williams confirmed the direction. Jobless claims and new home sales later Thursday are the next chance for the data to challenge that pricing. Gold is trading as if the numbers will confirm what the PMI already said.
November Brent crude oil futures at $105.95 and November WTI crude oil futures at $94.40 are keeping the inflation argument alive. The Iran talks have not produced progress. Higher crude on top of hot activity data on top of hawkish Fed talk is what sent the 10-year through 5% and gold through the 50-day. Until one of those three cracks, gold stays on the defensive.
Gold is inside the retracement zone with the 50-day and the 50% level sitting above as resistance and the swing bottom directly below. The chart is compressed between the two. Thursday’s data decides whether sellers get to press through the bottom or whether the rate trade pauses long enough for buyers to make a stand.
If you’d like to know more about how to trade gold, please visit our educational area.