XRP (XRP) could revisit the psychologically important $1 level if an emerging double-top pattern confirms, though bulls still have several support levels to defend before the bearish target comes into play.

XRP Double Top Puts $1 Back in Focus
XRP was trading near $1.48 on Sept. 24, following a sharp recovery from its August low near $1.
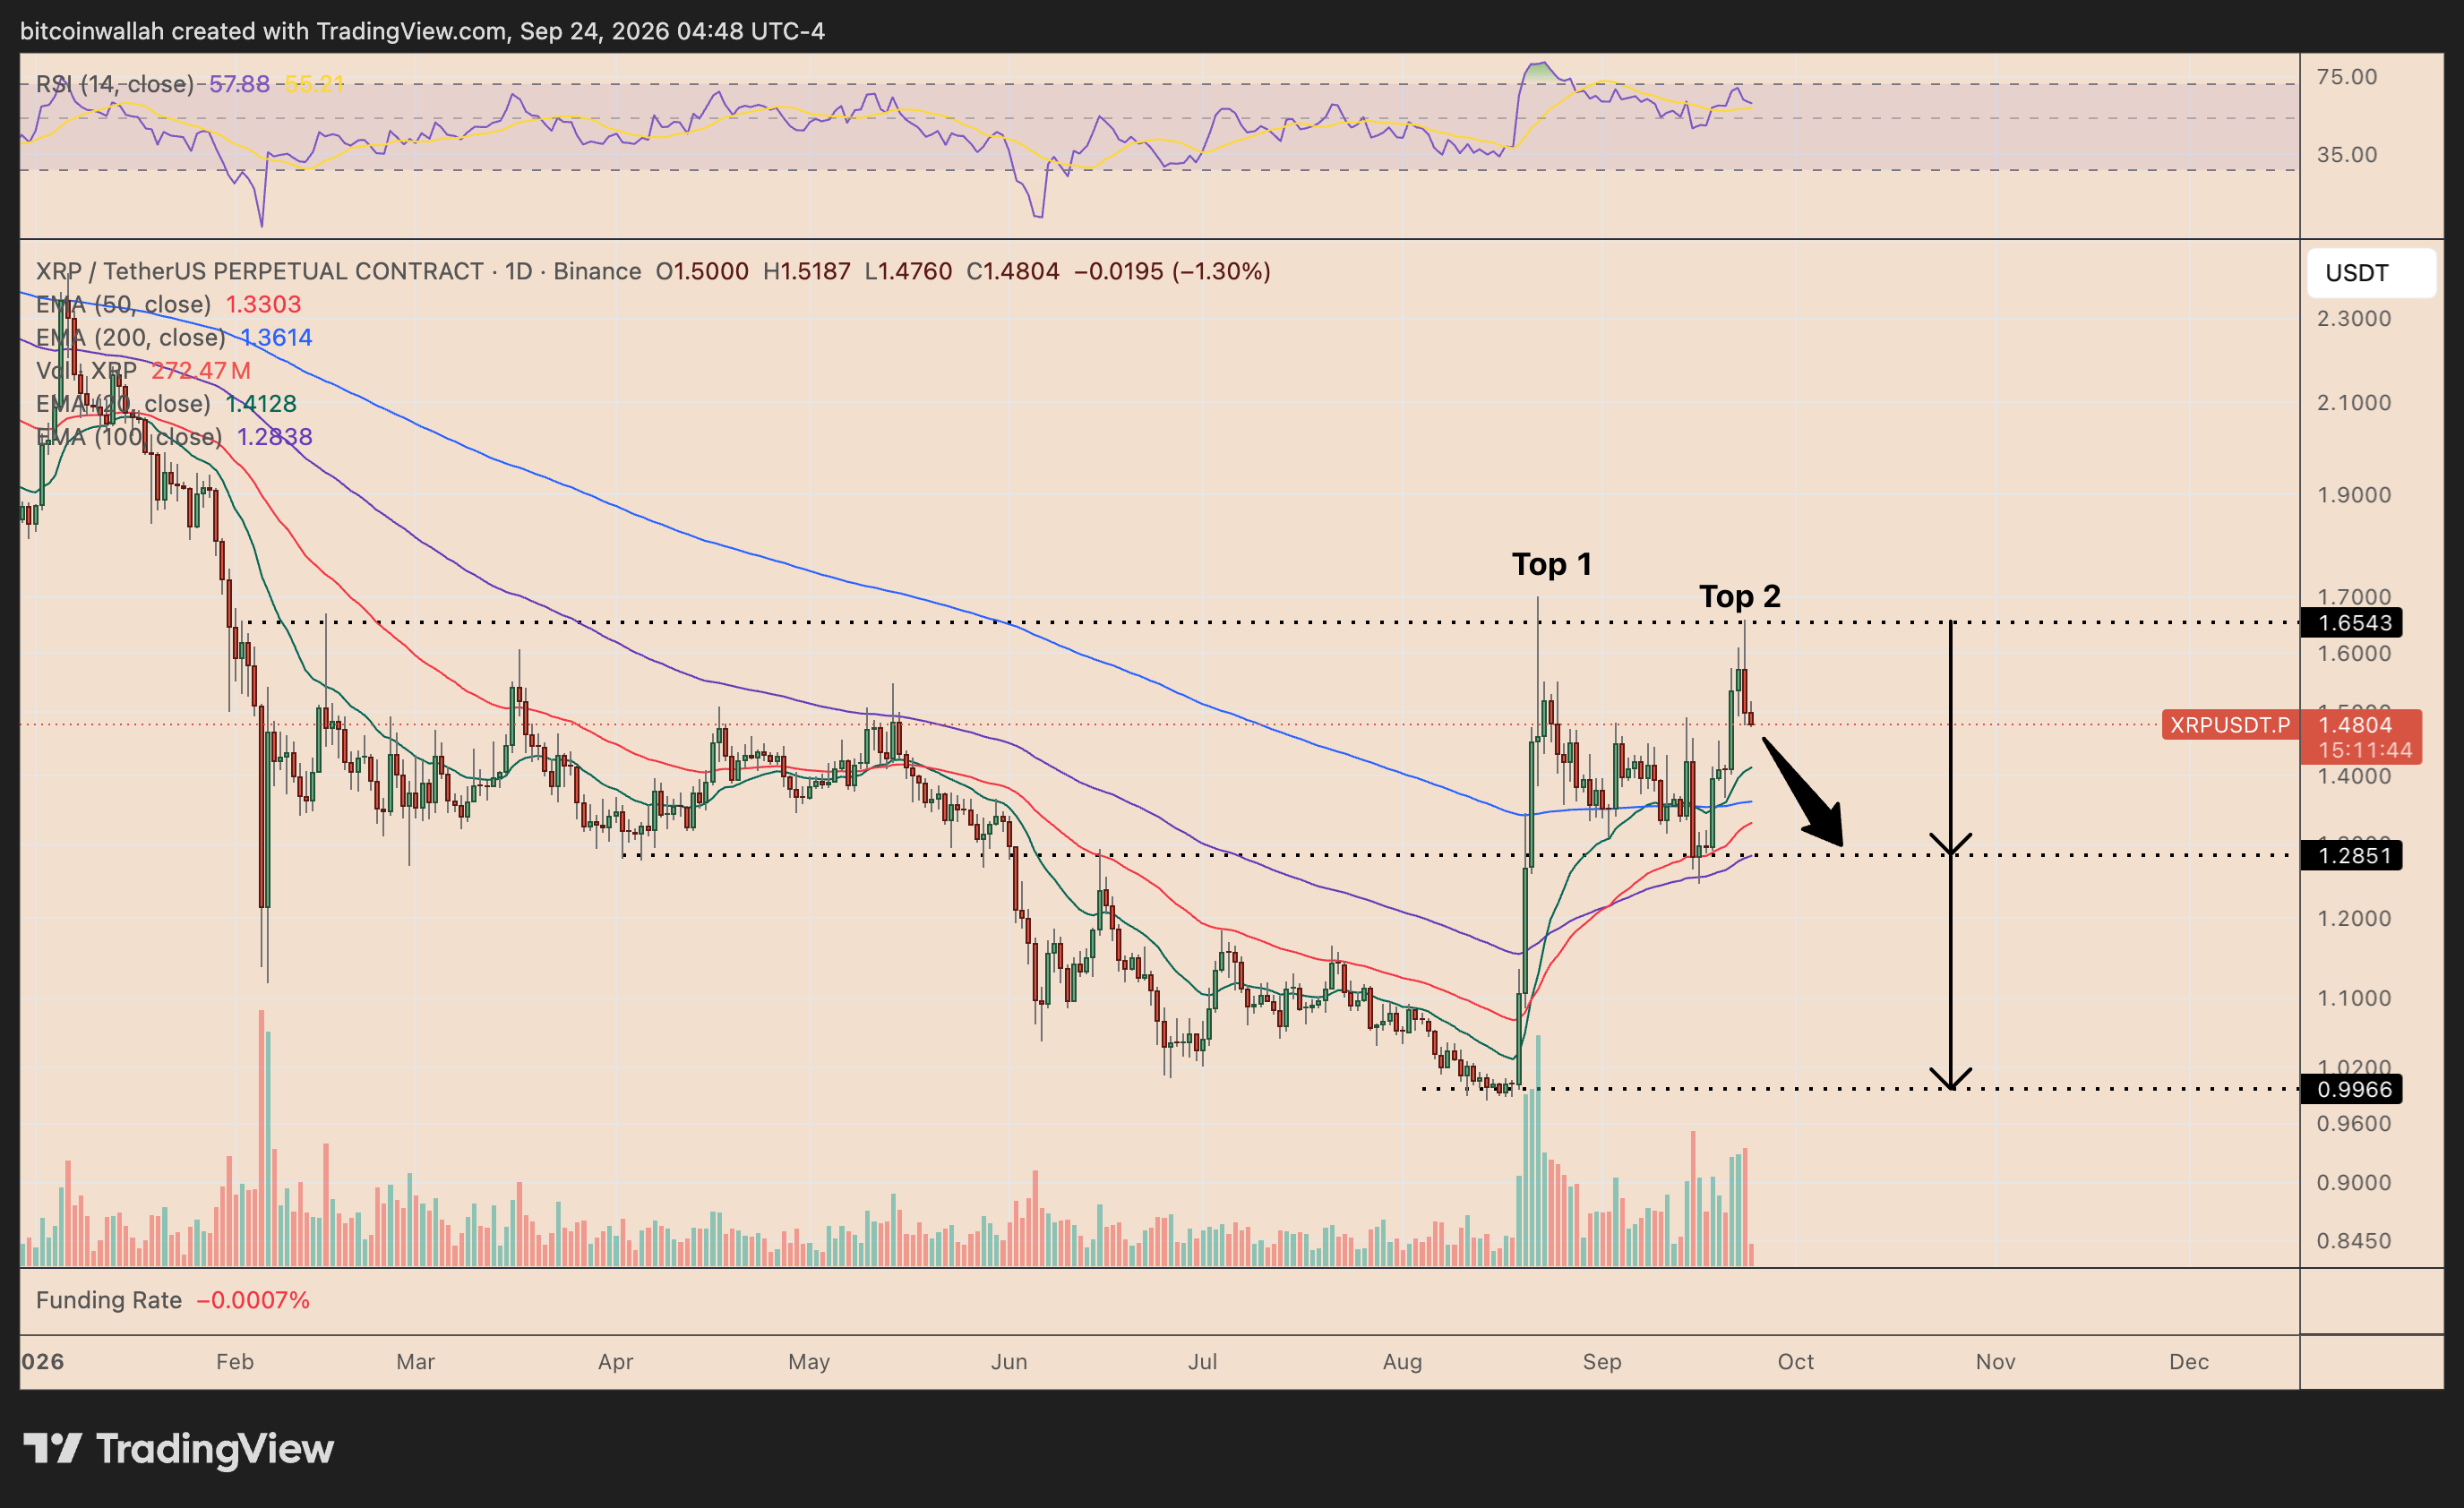
The first peak formed earlier in September when XRP rallied toward roughly $1.55-$1.60 before pulling back. The token subsequently recovered and tested approximately the same resistance area again in late September, forming what could become the pattern’s second top.
Both peaks remain below a broader resistance level near $1.65, where sellers have previously stepped in.
The key level to watch is the double top’s potential neckline around $1.285.
A decisive daily close below this support would confirm the bearish structure. Measuring the distance between the pattern’s peaks and neckline points to a downside target around $1.00, representing a decline of more than 30% from current prices.
That would effectively erase most of XRP’s recovery since August.
Ripple Price Forecast
Every new Ripple analysis as it publishes, today's technical signal and key levels, live price — on one page.
See all Ripple forecastsXRP Must Lose $1.28 Support First
The bearish scenario is not confirmed yet.
XRP remains above its 20-day EMA (green) near $1.41, while its 50-day (red), 100-day (purple) and 200-day (blue) EMAs sit around $1.33, $1.28 and $1.36, respectively. This creates a relatively dense support cluster between approximately $1.28 and $1.40.
Notably, the 100-day EMA near $1.284 almost perfectly overlaps with the double-top neckline, strengthening the importance of the $1.28 area.
Meanwhile, XRP’s daily relative strength index stands near 58, comfortably above the neutral 50 level and showing that bullish momentum has not completely disappeared.
Therefore, XRP could still invalidate the bearish setup by breaking decisively above its September highs. A move above $1.60-$1.65 would weaken the double-top argument and shift attention back toward higher resistance levels.
Until then, however, another rejection followed by a breakdown below $1.285 would substantially increase the risk of XRP falling back toward $1.00.