As of Wednesday, Sept. 23, Zcash (ZEC) bulls were sitting on a potentially dangerous leverage imbalance, with more than $44 million in cumulative long liquidation exposure stacked below the current price.

ZEC Longs Face $44M Liquidation Risk Near $1,488
ZEC was trading near $1,618 on Sept. 23, following a circa 100% rally that pushed the privacy-focused cryptocurrency toward the $1,700 level.
But CoinGlass’s CoinGlass’s Binance ZEC/USDT liquidation heatmap shows that leverage has become heavily skewed toward the long side.
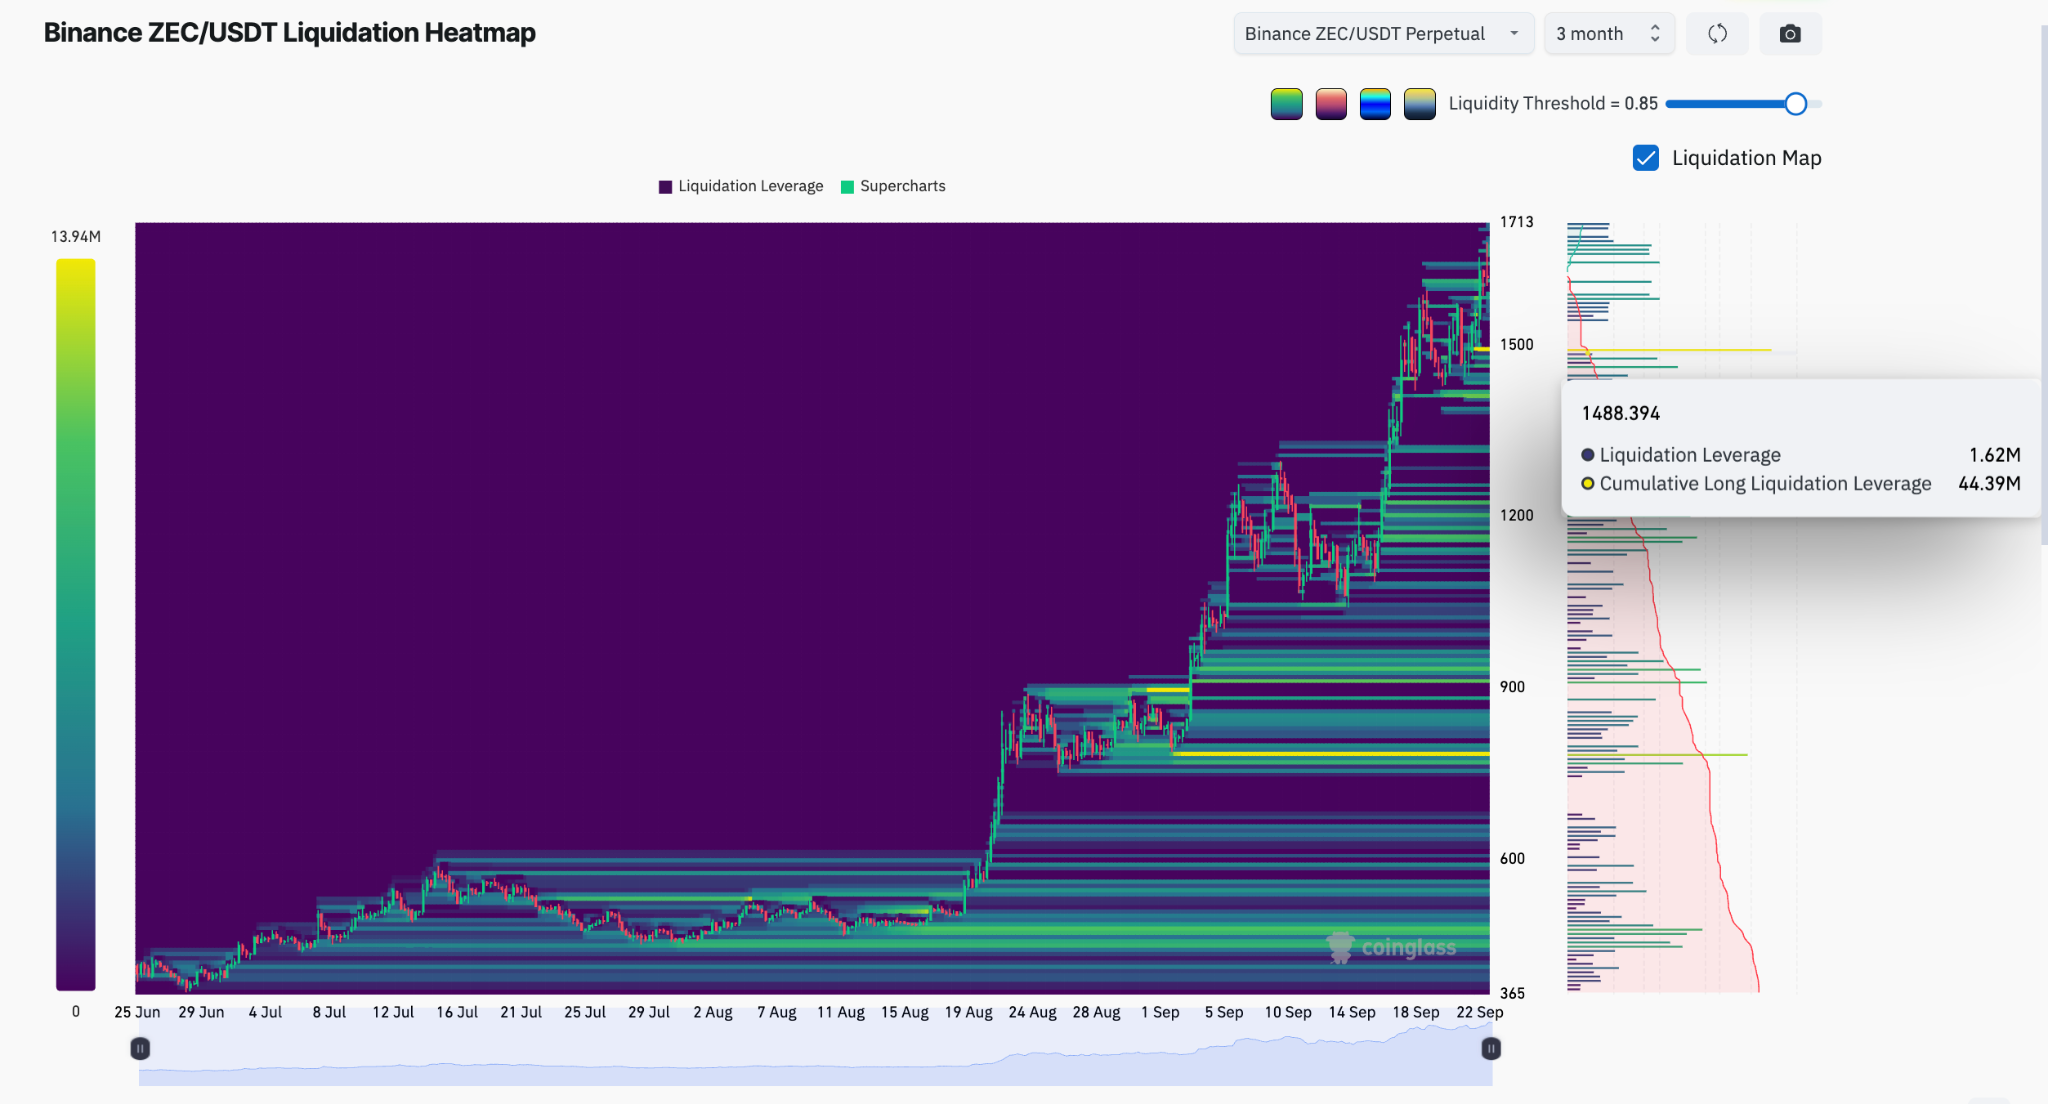
More importantly, the long liquidation exposure sitting below ZEC appears substantially larger than the comparatively thinner short-liquidation clusters above the current price.
That creates a clear imbalance.
Liquidations happen when leveraged positions are forcibly closed as price moves against them. Long liquidations add selling pressure, while short liquidations add buying pressure.
ZEC’s liquidation exposure is heavily skewed toward longs, so a drop toward $1,488 could trigger forced selling and potentially cascade into lower liquidity zones.
Bearish ZEC Divergence Strengthens Pullback Risk
That liquidation risk is appearing alongside a bearish technical signal on Zcash’s daily chart.
ZEC has continued making higher price highs, recently pushing toward the $1,700 region. Its relative strength index (RSI), however, has failed to confirm those highs and is instead producing a lower high.
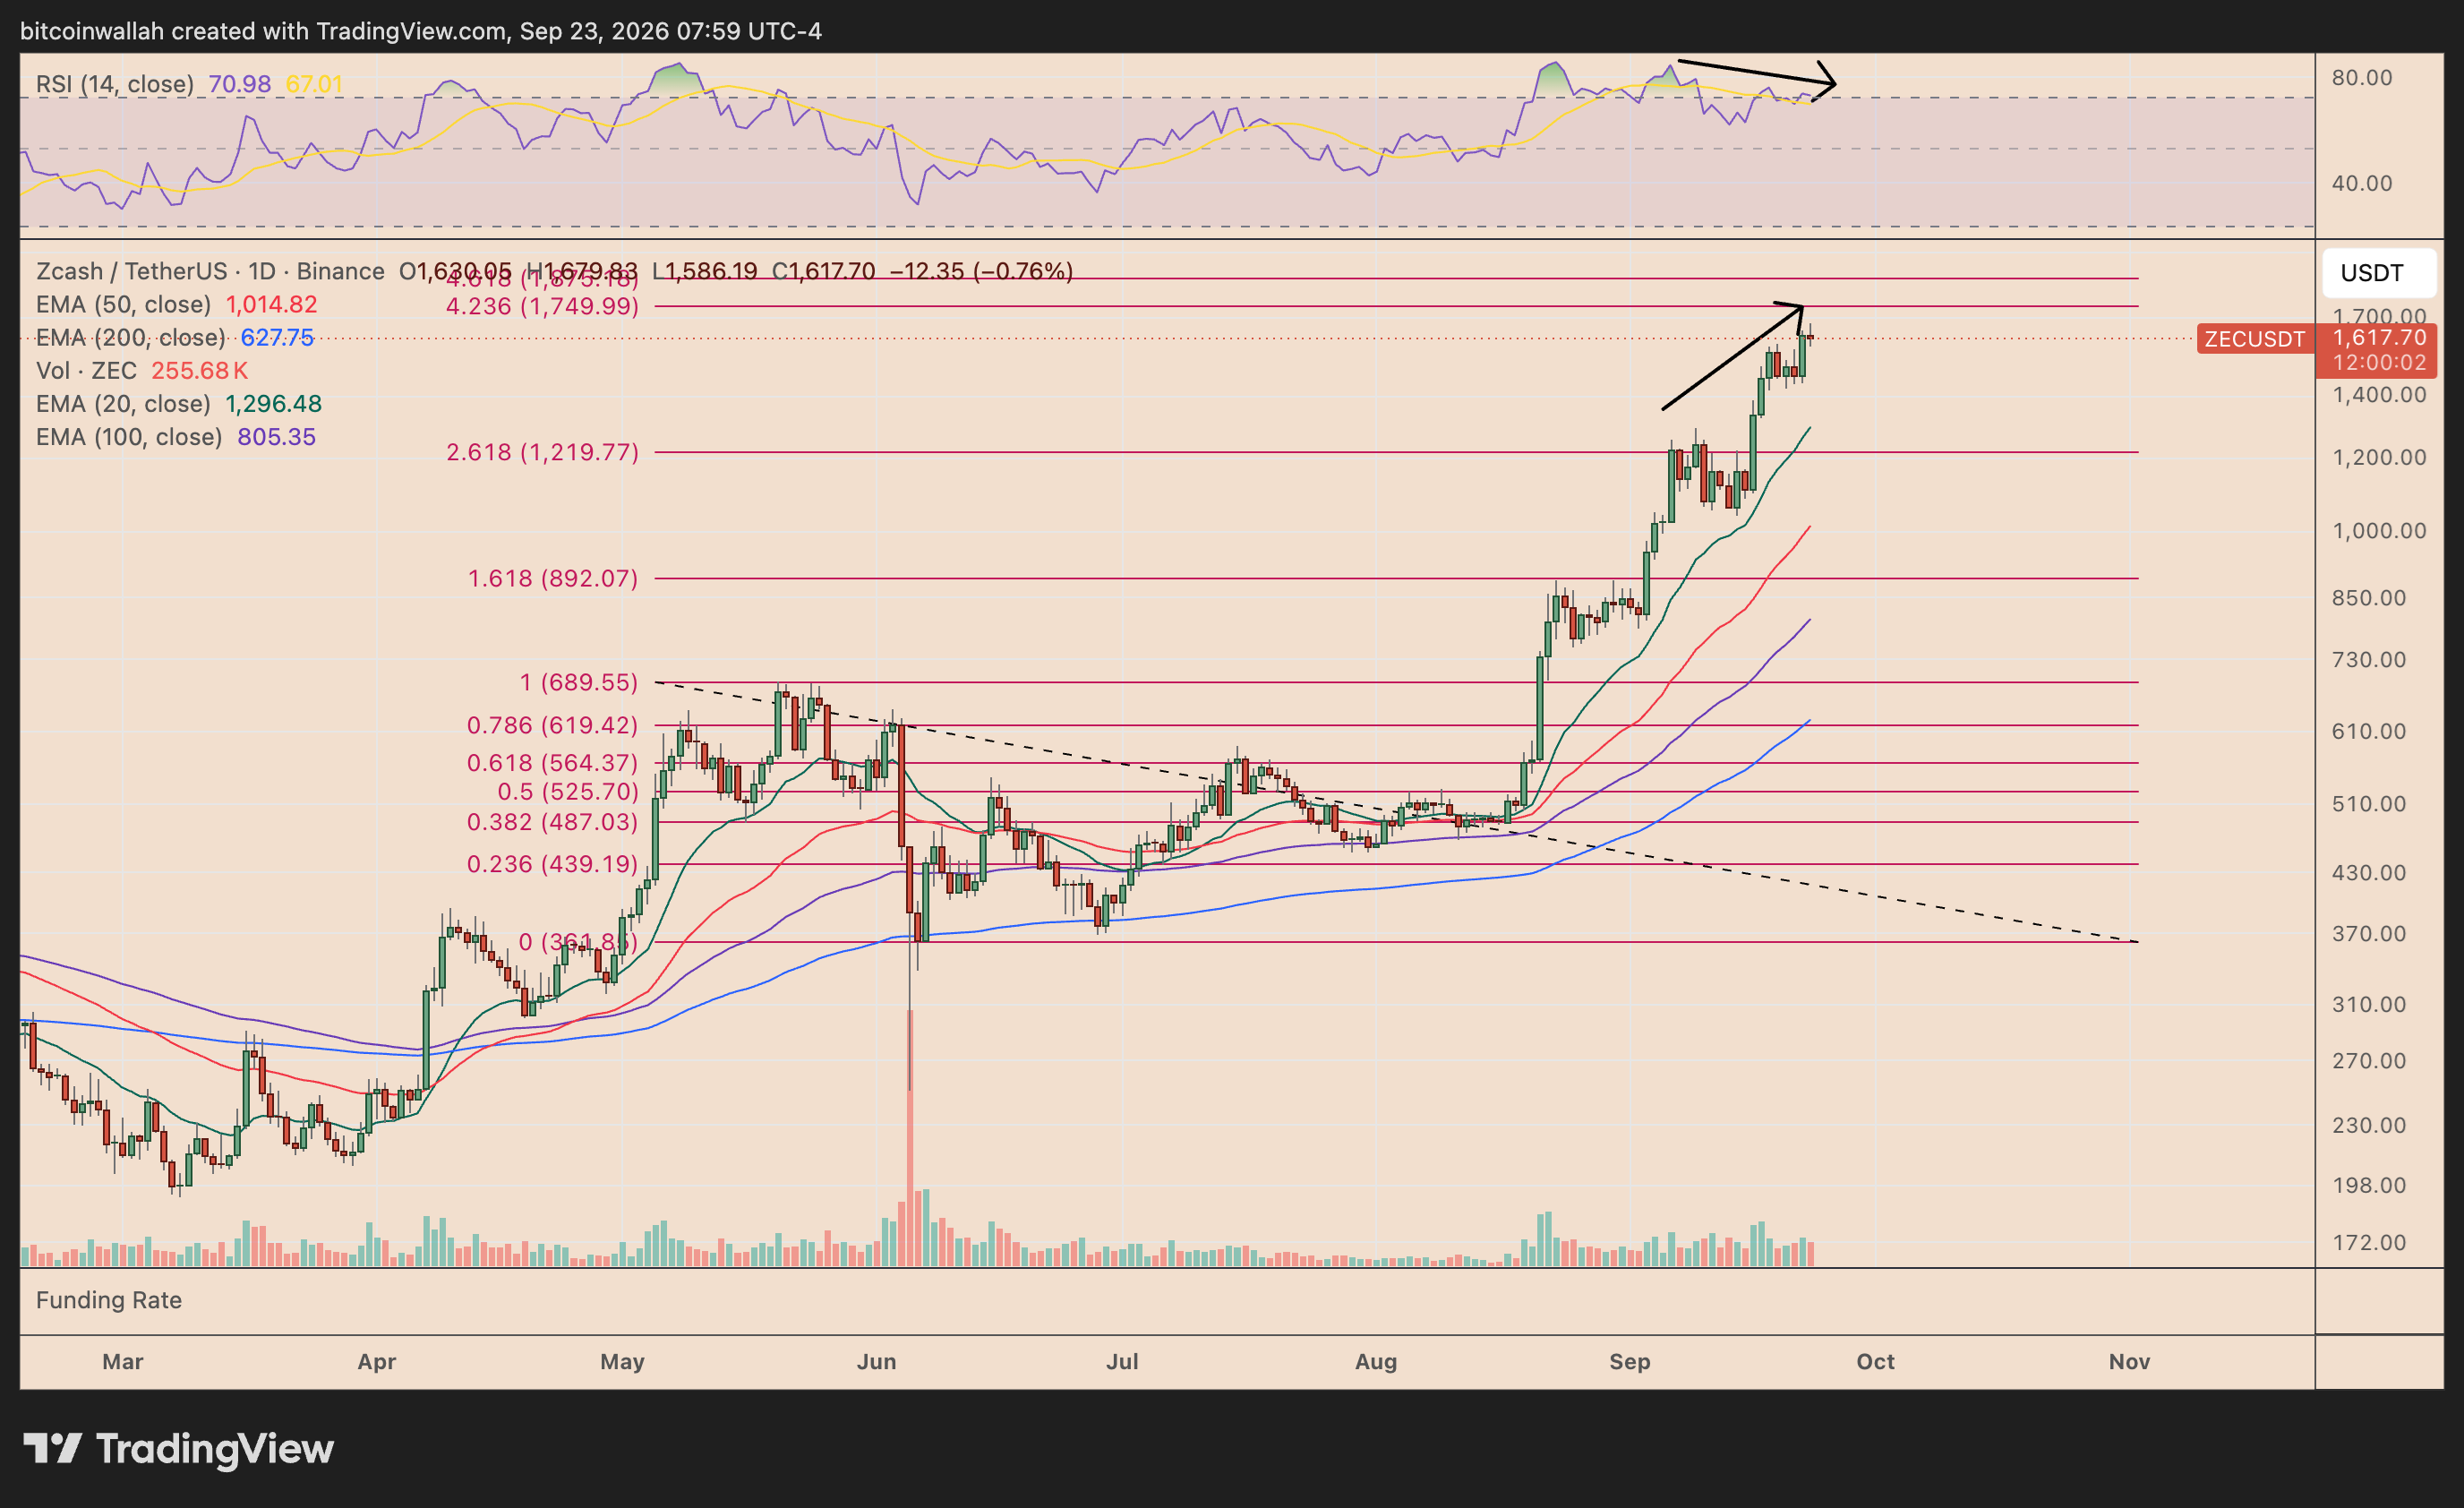
That creates a classic bearish divergence between price and momentum.
The bearish divergence suggests ZEC’s rally is losing momentum even as price continues to push higher. ZEC has been forming higher highs, while its daily RSI has failed to confirm the move and is instead trending lower. The RSI is also hovering near 71, keeping the token close to overbought territory.
At the same time, ZEC is approaching a major resistance zone around $1,700-$1,750, including the 4.236 Fibonacci extension near $1,750. A rejection from this area would strengthen the bearish setup.
If the divergence plays out, ZEC could first retreat toward its 20-day EMA (green) near $1,296, followed by the 2.618 Fib level near $1,220. That puts the main downside target in the $1,220-$1,300 range, roughly 20%-25% below current levels.
A move toward this zone could also sweep through large long-liquidation clusters, potentially accelerating the correction.