
Ethereum Targets Ideally $3,000, but Bullish Momentum Is Fading
Since our July 2 update, we have been bullish on Ethereum (ETH) based on the Elliott Wave Principle and technical analysis. Our latest August 21 piece tracked five gray waves within green Wave 3, targeting $2,575–$2,755, contingent on holding $2,145. That call worked as green W-3 topped $2,661 on September 11. Afterward, ETH fell back into its sideways consolidation range ($2,360–$2,520), coiled in a bull flag (black box), pushed through it last week, and is now working on the next, and likely final, leg higher of this impulse (red W-i).
Figure 1: short-term Elliott Wave count for ETH with several technical indicators
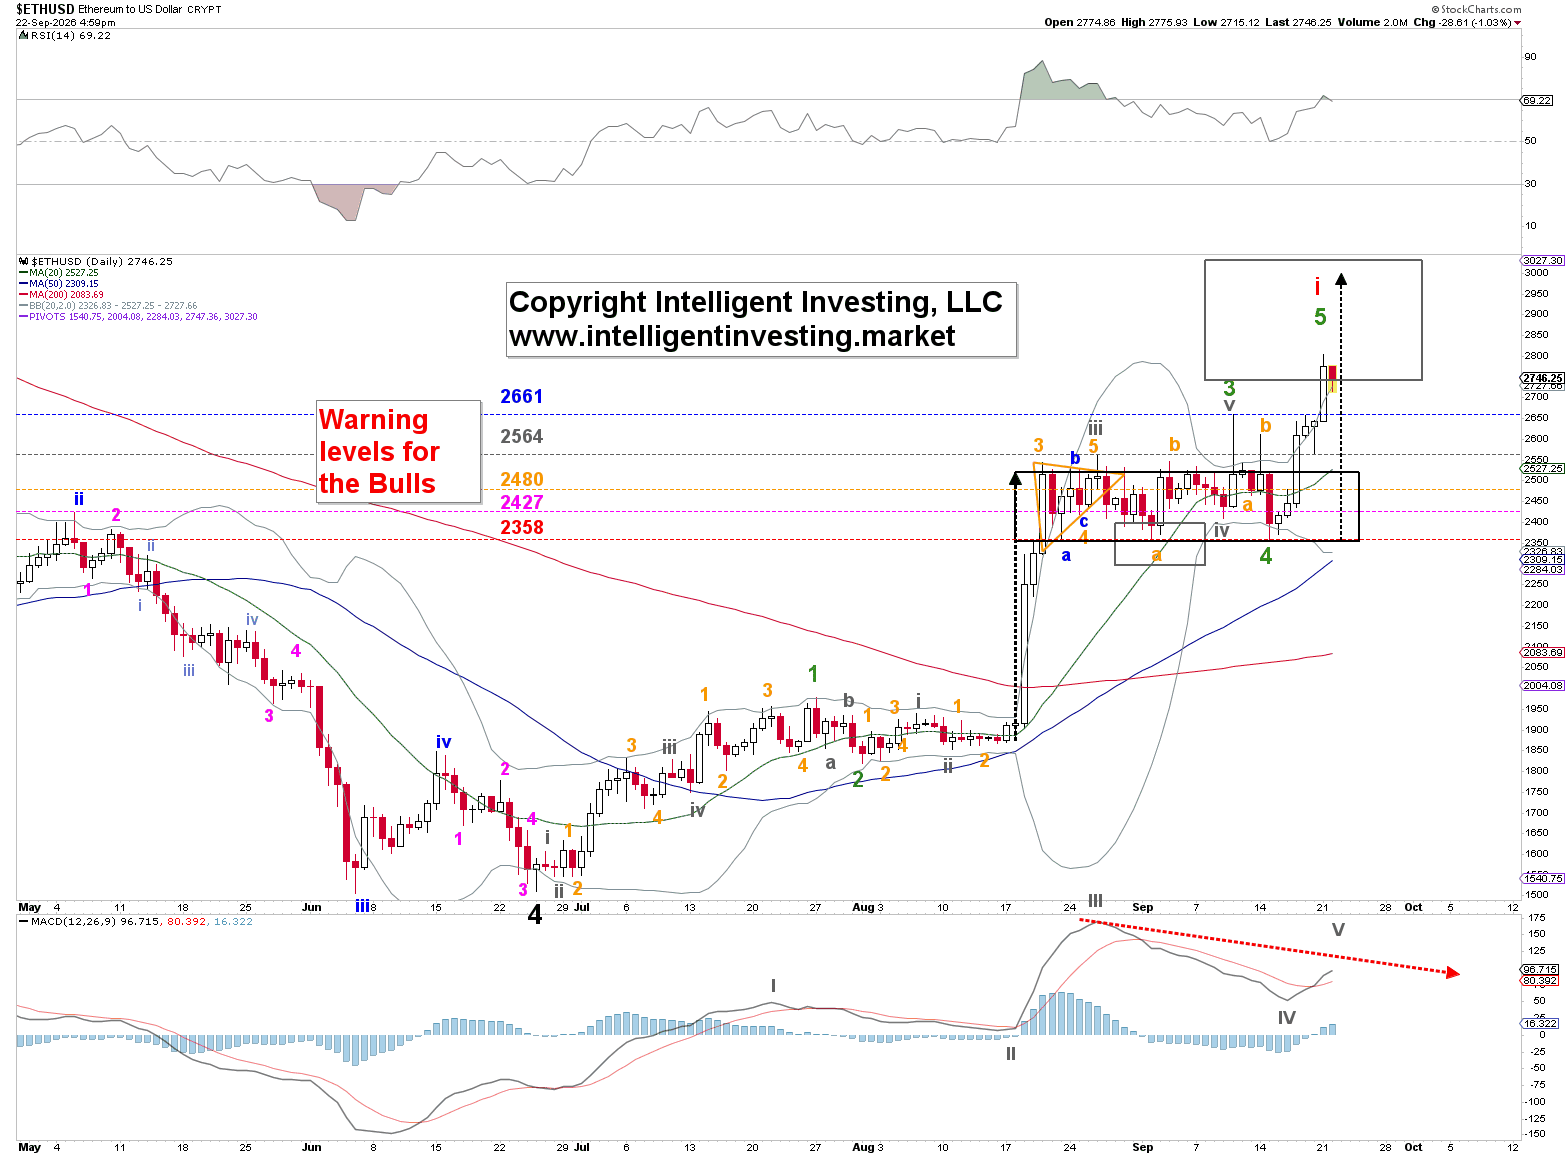
Both the measured move and the impulse projection point to ~$3,000 as the ideal short-term target for green wave 5 of red W-i. The RSI(14) is at 68.29, and price remains above the 20-day, 50-day, and 200-day simple moving averages, providing a constructive backdrop. However, although the MACD is positive, it is flattening and shows possible negative divergence (red dotted arrow), typical of a 4th-wave pause followed by a 5th-wave rally.
The warning levels for the bulls are now $2,661, $2,564, $2,480, $2,427, and $2,358. Hold $2,480, and the path of least resistance remains toward ~$3,000. A break below $2,427–$2,358 would suggest the five-wave impulse is over and that a deeper retrace (a 2nd wave) to ideally $1900 +/-100 is underway, before a 3rd wave can rally price to new all-time highs.
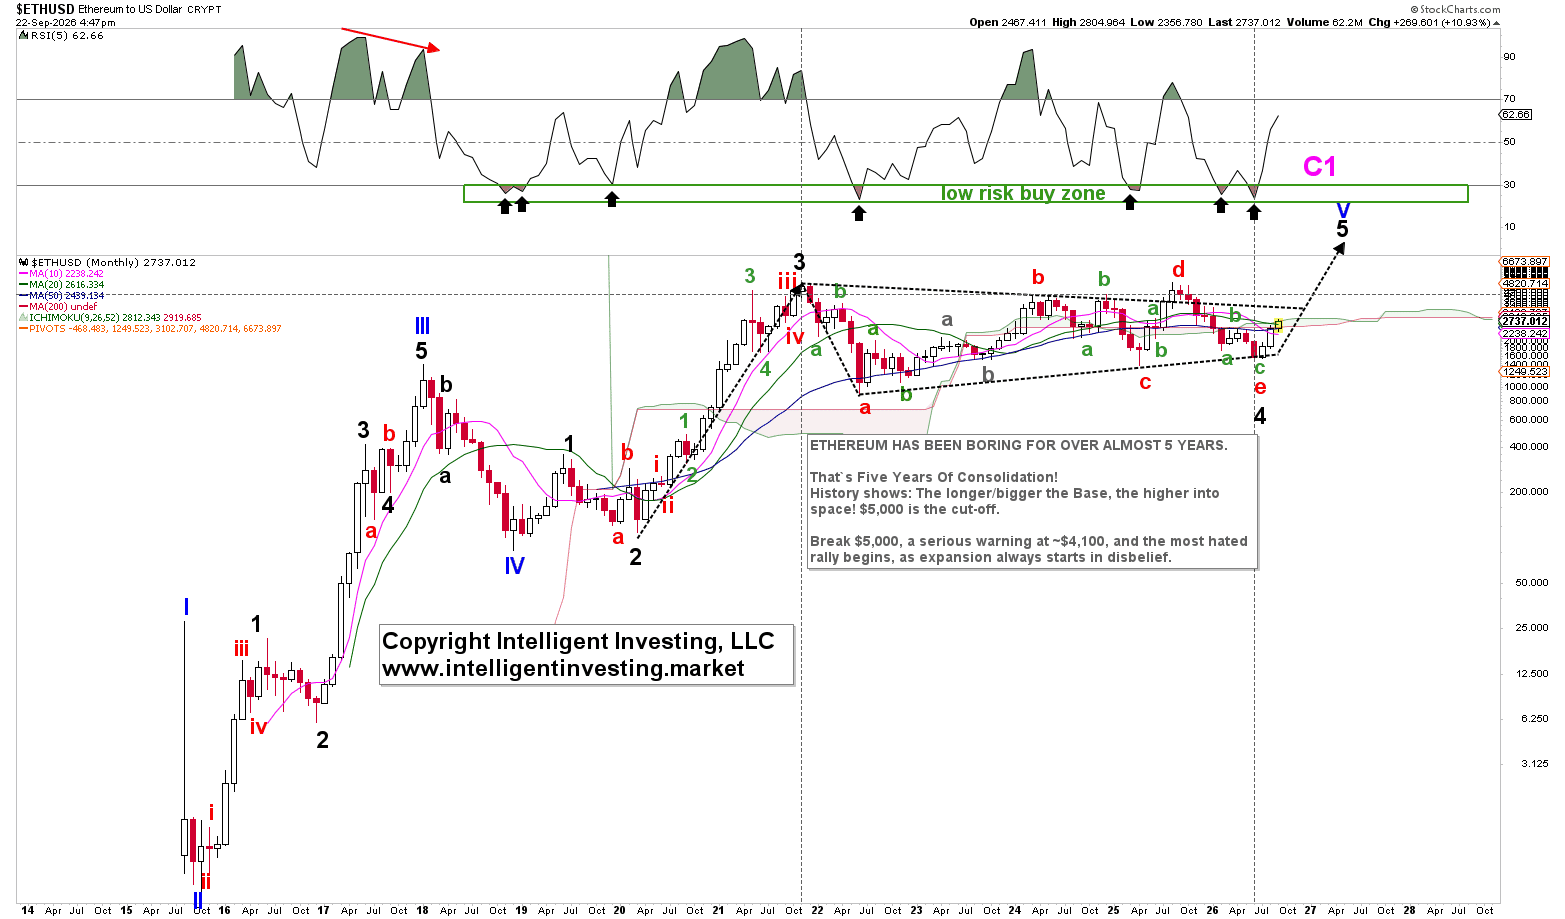
Figure 2: long-term Elliott Wave count for Ethereum

Long-Term Ethereum Outlook Points to at least $6,250
The bigger picture has not changed. Ethereum has spent almost five years in a complex black wave-4 consolidation that evolved into a multi-year bull flag/triangle. History supports the simple rule on the chart: the longer and larger the base, the larger the eventual expansion. Monthly RSI has again moved out of the green “low risk buy zone,” the same area that marked prior cycle turns.
As noted in previous updates, we continue to view the larger 4th wave as complete. If the current five-wave advance from the July 1 low finishes as projected — in the low $3,000s — it would confirm that an important low has been reached. The next major target remains at least $6,250 for black W-5 of blue wave V.
The monthly chart also keeps the upside roadmap honest:
Ethereum Price Forecast
Every new Ethereum analysis as it publishes, today's technical signal and key levels, live price — on one page.
See all Ethereum forecasts- $5,000 is the cut-off that would confirm the larger breakout
- ~$4,100 is a serious warning if that breakout later fails
Expansion, if it comes, is likely to start as the “most hated rally,” because this base has lasted long enough for disbelief to become the consensus.