



Ethereum Extends Bullish Elliott Wave Setup
Since our July 2 update, we have been Bullish on Ethereum (ETHUSD) using the Elliott Wave Principle (EWP) and Technical Analysis (TA). In our last update (see here), we showed that we were tracking a five-wave advance higher, and that therefore Ethereum was
“most likely in a short-term corrective [2nd wave] pullback to ideally $1,700+/-25 from where the next rally to approximately $2,450+/-50 can start.”
Fast-forward four weeks and ETH bottomed on August 1 at $1,820 and is now trading at around $2,420 for a 3rd-of-a-3rd wave rally. See Figure 1 below.
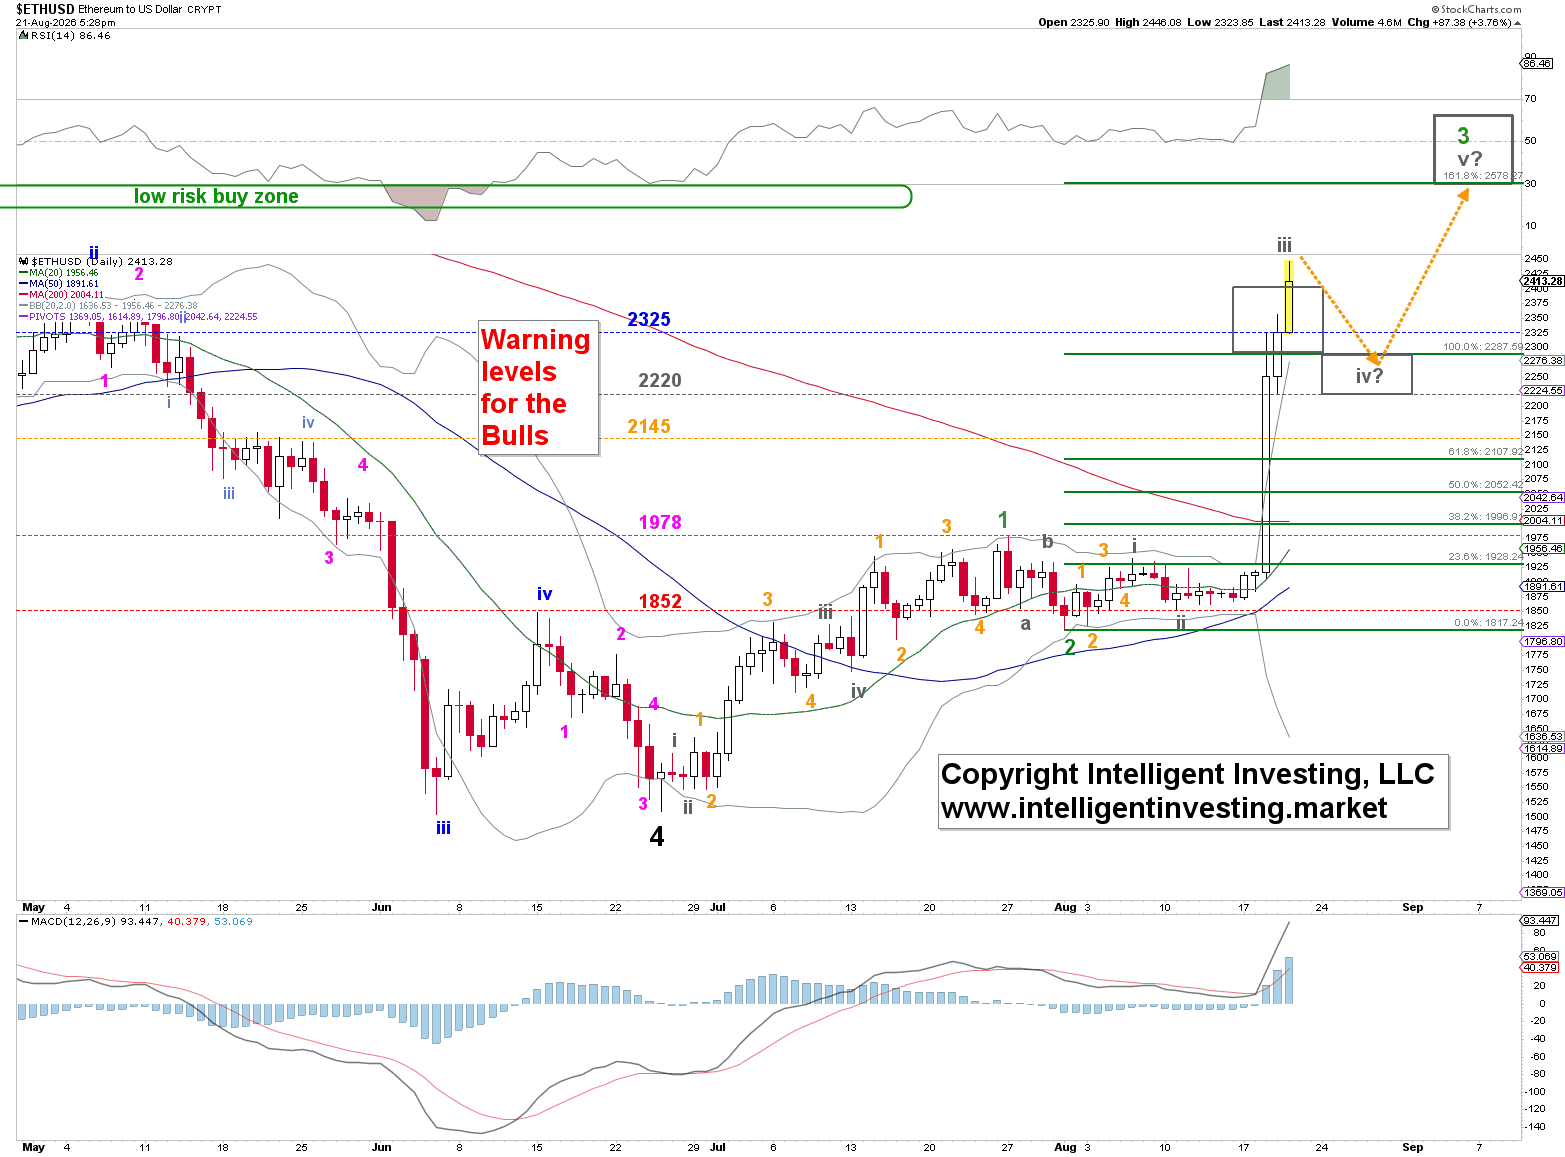
Ethereum short-term Elliott Wave chart shows ETH advancing from the August 1 low, with $2,145 as a key warning level and $2,575-$2,755 as the target zone. Source: Intelligent Investing, LLC.
Upside Targets Remain in Focus Above Key Support
Thus, our previous calls for higher prices were correct. We continue to track the potential for five (gray) waves (i, ii, iii, iv, v) higher within the green W-3, ideally around $2,575-2755, contingent on ETH staying above at least $2,145, which is our 3rd warning level for the Bulls. Below that level, there is a >60% chance the current uptrend is over.
Long-Term Bull Flag Supports a Major Breakout
Given the ongoing bullish price action and as stated previously, we continue to view the larger (black) 4th wave as complete. It morphed into a complex, multi-year bull flag pattern, holding the lower trend line elegantly. Ethereum continues to move impulsively, so we continue to track a potential five-wave advance from the July 1 low. If it materializes, we can be certain that an important low has been struck and that at least $6250K will be the next major target for the black W-5, of the blue W-V etc. See Figure 2 below.
Ethereum Price Forecast
Every new Ethereum analysis as it publishes, today's technical signal and key levels, live price — on one page.
See all Ethereum forecasts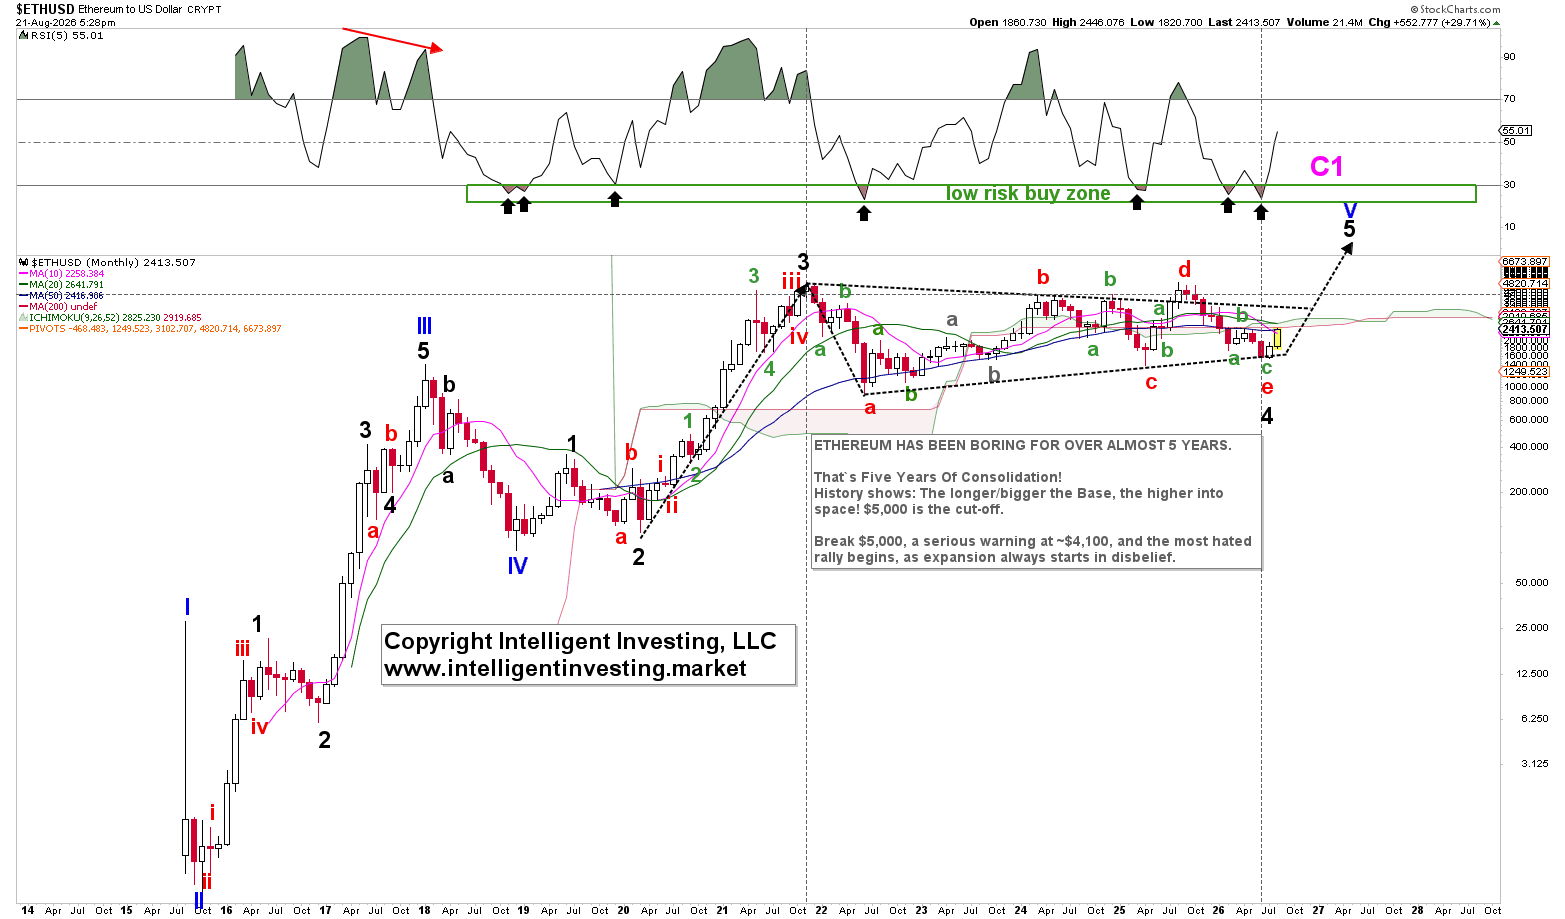
Ethereum long-term Elliott Wave chart shows a multi-year bull flag and a potential five-wave advance supporting a major breakout scenario. Source: Intelligent Investing, LLC.