


Silver Is Back Near $70 and Fresh Money Is Entering the Trade
Spot Silver pushed to its strongest level in about two months Friday as the Treasury buyback trade continued to pull yields lower and the dollar toward a three-month low. The metal is up more than 5% on the week. Futures traded above $70 during the session. The supply deficit, rising open interest and steady industrial demand are keeping the bid underneath the move after the Treasury announcement got it started.
The rally is approaching resistance that has held since June. The market has momentum heading into the close but the bond market still decides whether it carries into next week.
At 16:10 GMT, Spot Silver (XAGUSD) was trading at $69.82, up $1.72 or 2.53%.
Daily Spot Silver (XAGUSD) Technical Analysis
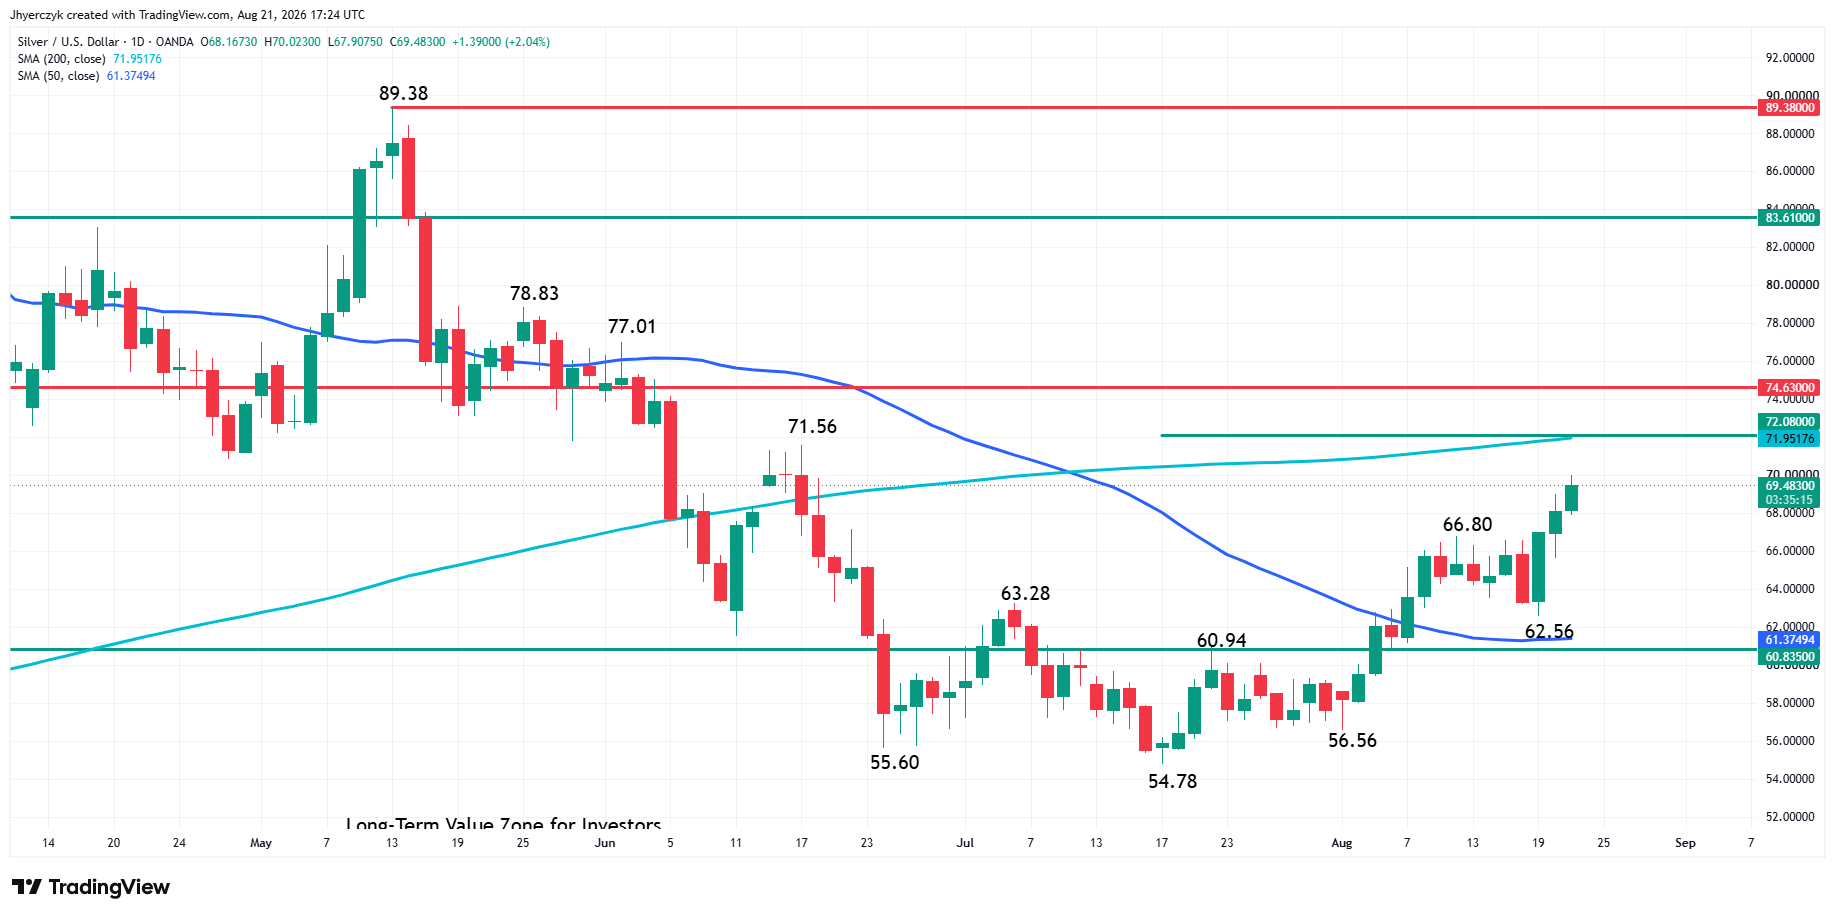
Spot Silver is edging higher late in the session on Friday for a third straight day. The rally has put the market within striking distance of the June 17 main top at $71.56. But that is not the objective. The focus is on a possible extension into the price cluster formed by the 200-day moving average at $71.95 and the intermediate 50% level at $72.08.
Silver may follow the blueprint laid out by spot gold earlier in the week. It could rally into the 200-day moving average, pause for a few days, then resume the move into the long-term retracement zone at $74.63 to $83.61.
This is a pure momentum play at this time. We will follow the price action with a trailing 50% level. If traders stop taking out offers, momentum is likely to stall and shift to value-zone buying or passive bidding. The current momentum rally is $62.56 to $70.02, making $66.29 the trailing 50% level.
The Rate Trade Started the Rally and Crude Oil Could End It
Treasury will at least double its buyback operations for government bonds maturing in 10 to 30 years. The program begins in early September with operations of at least $4 billion each. Secretary Bessent left the door open to larger purchases. The announcement came after the 30-year yield reached levels not seen since 2001. Long-dated yields fell hard on the news earlier in the week. They recovered some ground Thursday. The dollar kept sliding toward a three-month low Friday and silver responded.
Silver Price Forecast
Every new Silver analysis as it publishes, today's technical signal and key levels, live price — on one page.
See all Silver forecasts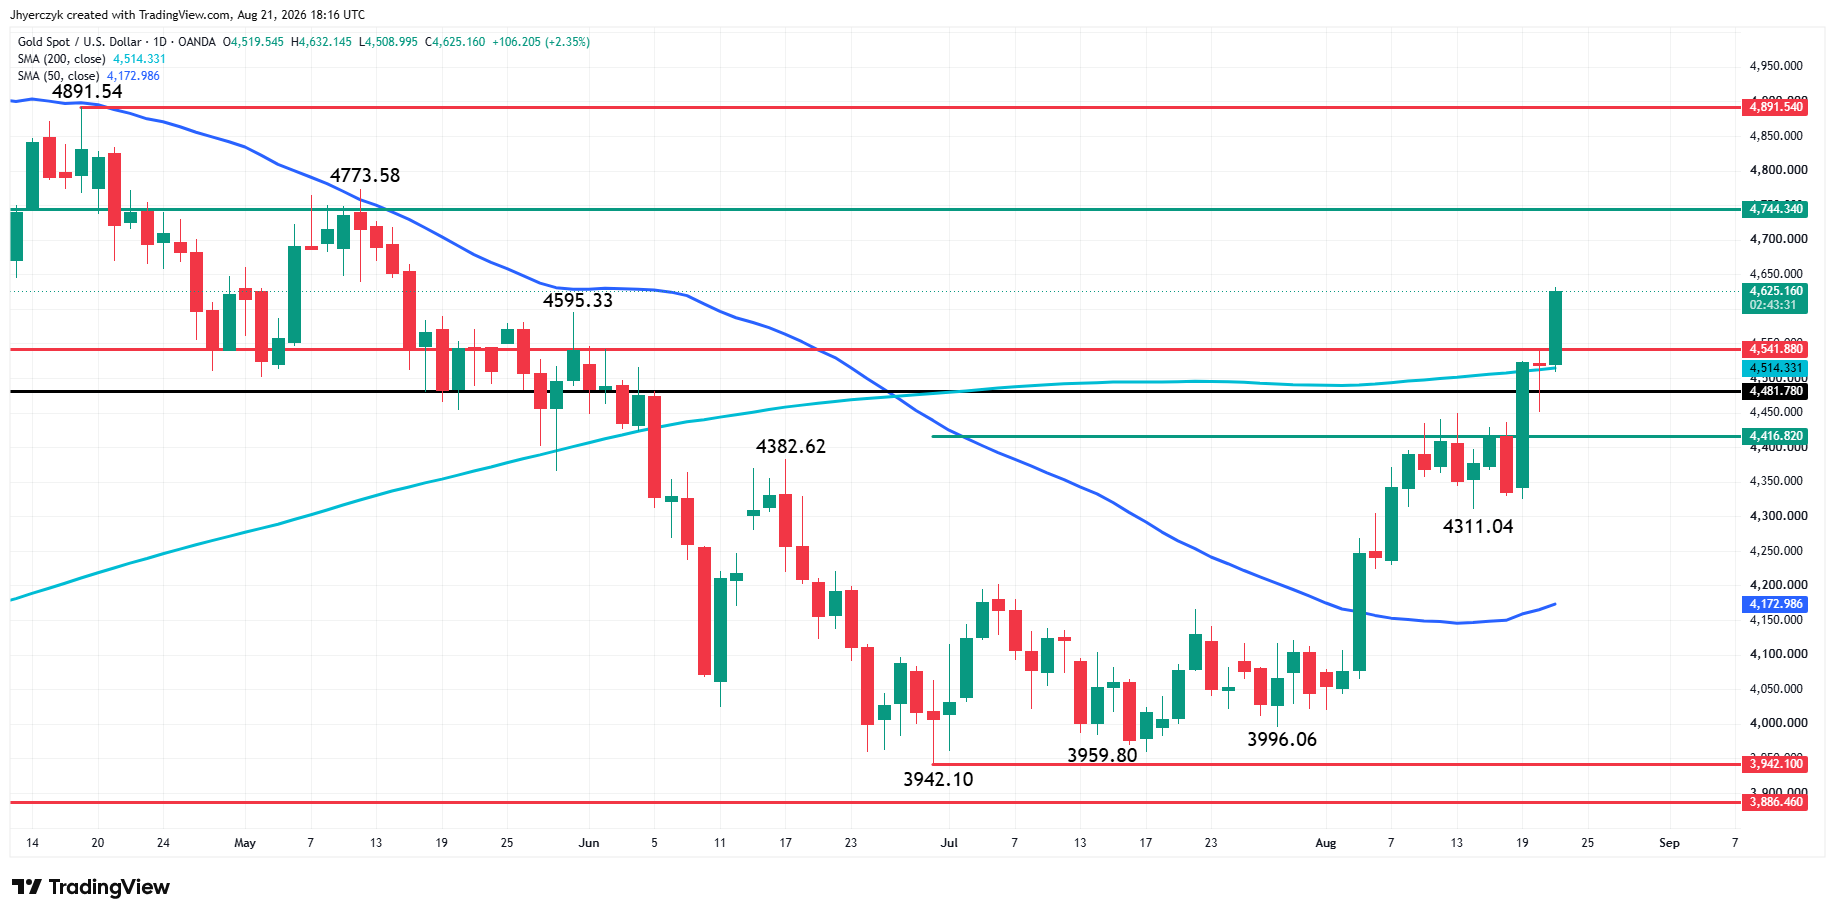
Gold also broke above its 200-day moving average Friday and climbed to a more than three-month high as the dollar kept sliding on the Treasury buyback trade. Both metals are running. Silver held together better through the back half of the week because the physical market underneath it is tighter. The buyback gave both metals the opening. Silver is the one that never gave it back.
Washington still has to sell new debt to cover deficits and future spending. The buyback gave the long end a buyer. It did not eliminate the borrowing problem that pushed the 30-year to a 19-year high earlier in the week.
Crude oil is the other side of the trade. Brent remains elevated after the Iran conflict restricted shipping through the Strait of Hormuz. Washington is preparing new sanctions against Tehran. Higher energy costs are keeping inflation concerns in front of the Fed and the bond market. Crude staying elevated can rebuild the rate-hike argument fast enough to push yields and the dollar higher again. Silver is running on the rate relief. Oil is the force that can take it away.
The Physical Market and the Futures Market Are Both Saying the Same Thing
The silver market is heading for a sixth consecutive annual deficit in 2026. The projected shortfall is about 46 million ounces. Global mine output has not kept pace with demand. Most of the world’s silver comes out of the ground as a byproduct of copper, lead, zinc and gold mining. Industrial consumption from electronics and advanced manufacturing continues to pull metal into production lines. The demand is broad and it is steady.
Open interest rose more than 3,000 contracts to about 115,000 through mid-August. Managed-money traders are net long roughly 11,000 contracts. Smaller traders are also long. Commercial hedging increased on the other side as prices moved higher. That is new money entering the trade, not the same summer positions getting recycled.
What to Watch
The price cluster at the 200-day moving average near $71.95 and the 50% level at $72.08 is where the rally gets its next test. Gold cleared its own 200-day Friday and is at a three-month high. Silver is approaching the same level with momentum from the physical side. The trailing 50% level at $66.29 is where the market finds out whether pullbacks are still attracting buyers.
Next week’s PCE inflation report and Warsh’s Jackson Hole speech will move yields and the dollar. Those two forces started the silver rally and they can stop it. Crude above $93 Brent is the wildcard that can shift the rate debate back toward tightening before the data even lands. Silver has the deficit, expanding open interest and a dollar at three-month lows heading into the weekend. The bond market decides whether those conditions hold on Monday.
More Information in our Economic Calendar.



