WTI Crude Oil Technical Analysis
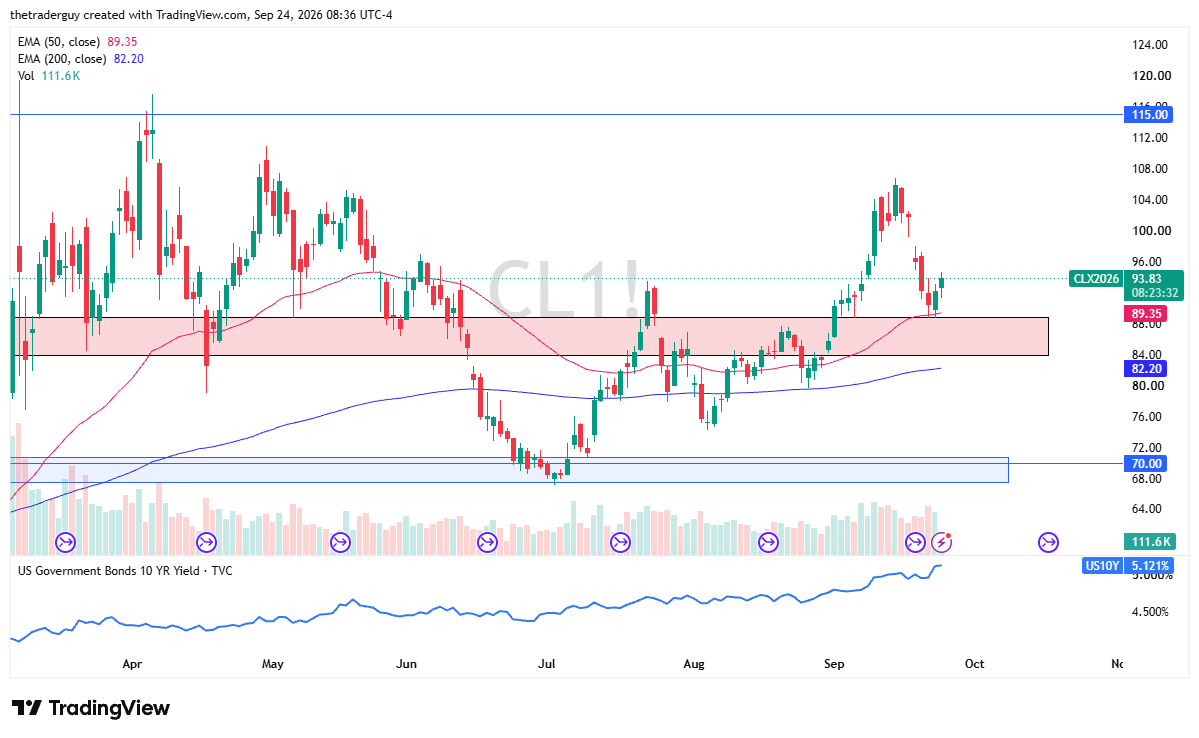
The WTI Crude Oil market is recovering from a pretty significant sell-off to test the 50-day EMA. The WTI crude oil market has gapped higher, only to pull back and bounce, showing signs of life. The 50-day EMA is obviously a technical indicator that a lot of people will be watching.
Brent Oil Price Forecast
Every new Brent Oil analysis as it publishes, today's technical signal and key levels, live price — on one page.
See all Brent Oil forecastsIt’s worth noting that the markets have been trying to price in the idea of peace and, I think, are now getting a little bit of a reality check. Therefore, we have seen the markets start to price in the fact that the conflict in the Middle East is not being solved overnight.
With this being said, it makes sense that perhaps traders are looking to try and fill the gap near the $103 level. With all of the damage being done to the oil infrastructure and the lack of supply, it is not a real stretch of the imagination.

Brent Technical Analysis
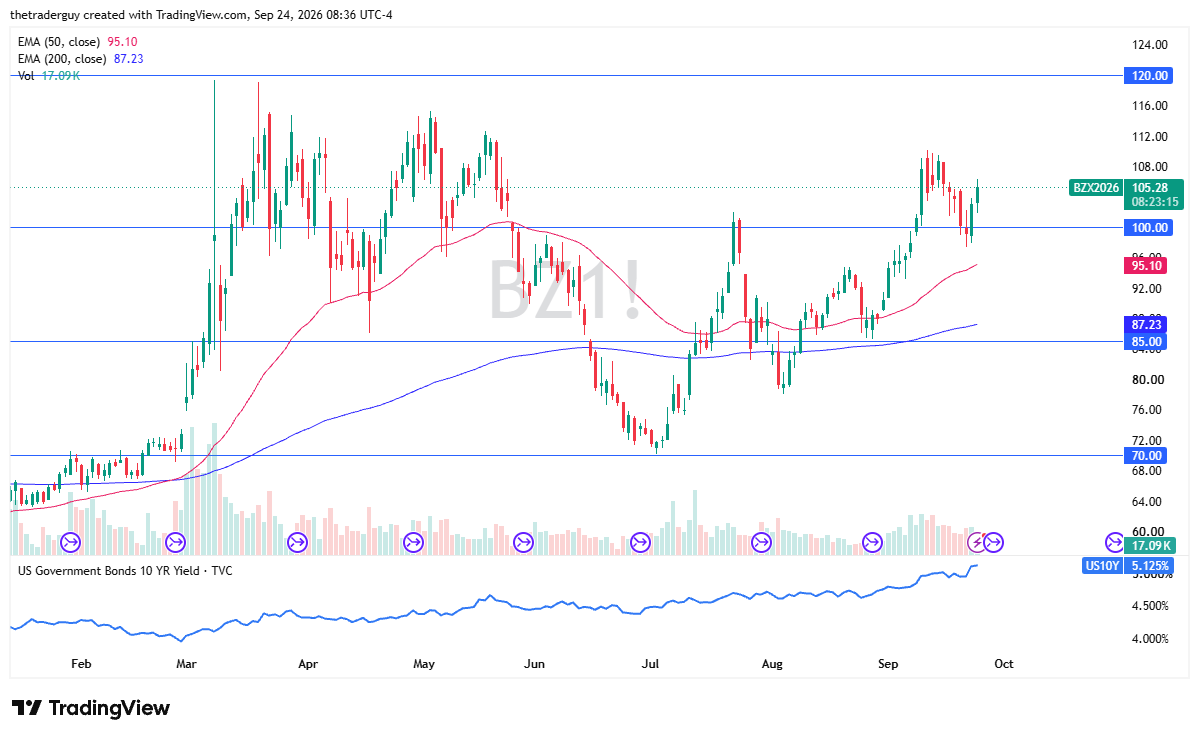
Brent markets look like they are continuing to recover as well. There is some previous resistance at $110, while the $100 level seems to be a bit of support. Ultimately, this is a market that has been very noisy for a while, but again, it is moving on all of the same things.
The fact that there is a lot of concern about the free flow of oil through the Strait of Hormuz and, quite frankly, beyond, I think, continues to be a major driver here. It looks bullish and, in fact, you could even say there is a bullish flag.
If you’d like to know more about how to trade natural gas, please visit our educational area.