Thursday Slide Retests Prior Low
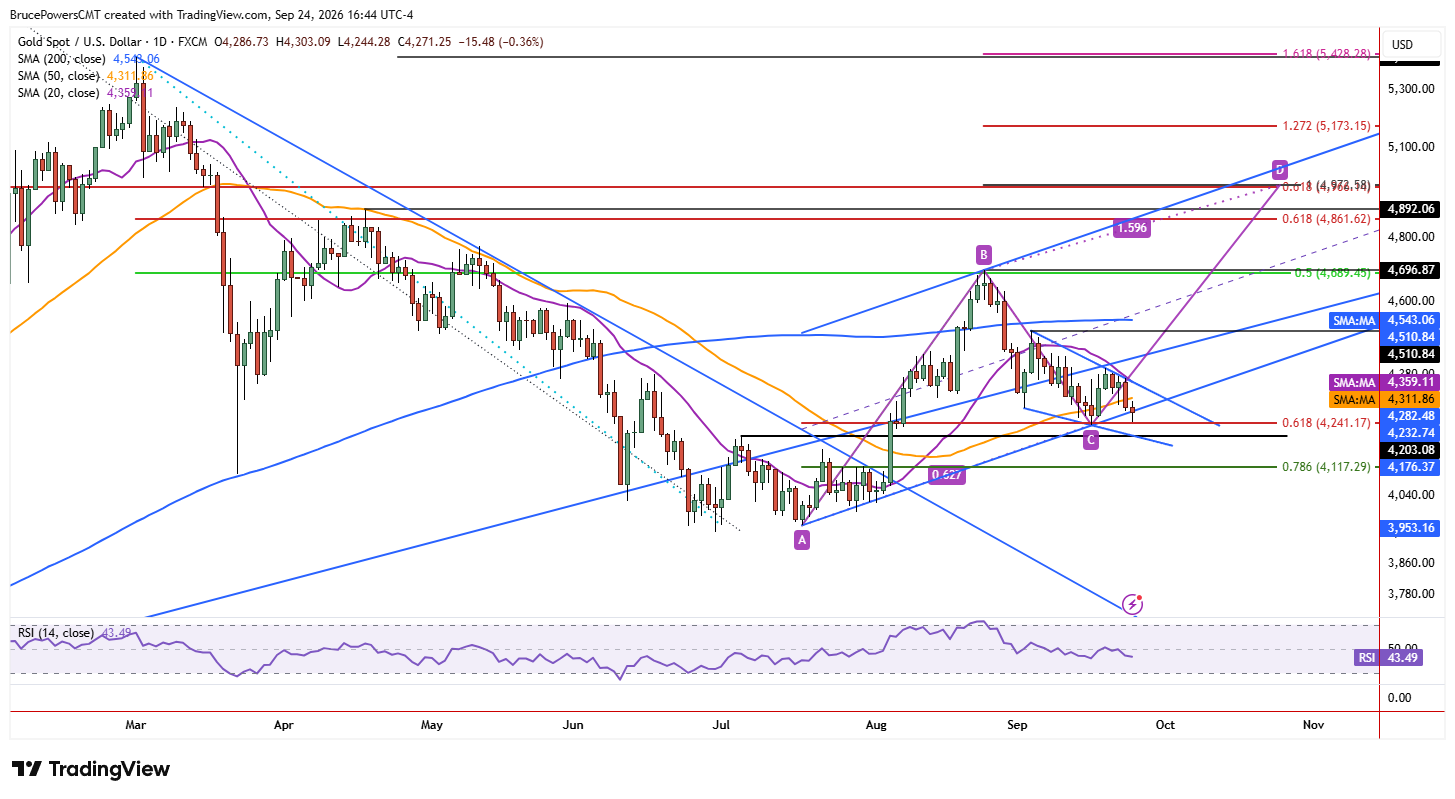
Gold continued to weaken on Thursday, falling to a low of $4,244 and retesting support near the recent low of $4,235 (C) and the 61.8% Fibonacci retracement of the prior advance at $4,241. Support failed to hold at the uptrend line following a failure of support at the 50-day moving average on Wednesday, adding to signs of downward pressure. If the prior low breaks as support, the lower swing high, which previously signaled a bullish reversal on during the recent advance, becomes the next downside target at $4,203.

First 50-Day Test Since August Fails
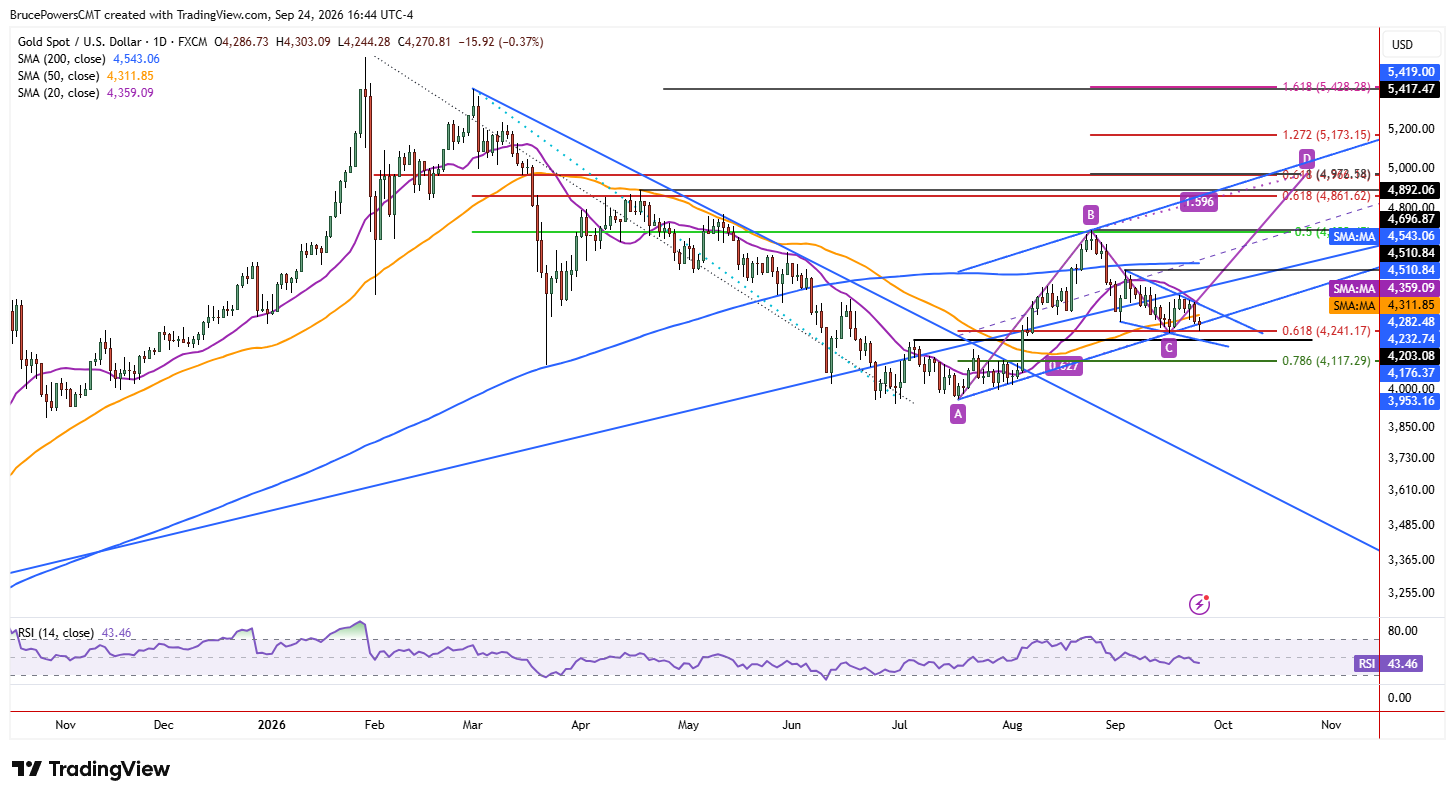
A key indicator for the trend in gold is the 50-day moving average. It was reclaimed decisively and with enthusiasm on August 5 and the current decline is the first test of that indicator as support since then. So far, the test is a failure as support has not been confirmed near that indicator and gold is at risk of dropping further below it. Further down is the 78.6% Fibonacci retracement of the prior advance at $4,117. Since gold recognized the 61.8% retracement zone, it may also recognize the lower level, if it is approached.
Support Remains a Zone
Having said that, the area of support remains, and this is another example of why price levels should be considered as price zones. Another leg up in the advance that followed the July low (A) remains a possibility unless the 78.6% retracement zone fails as support. With current structure, a rally above Thursday’s high of $4,303 would signal a one-day bullish reversal and the potential for support to hold.
Levels Needed to Restore Upside
A reclaim of the 50-day moving average would then need to follow above $4,312 to further confirm strength. Then, a recovery of Wednesday’s high of $4,369 would be needed, followed by a rally above the recent lower swing high of $4,400. That would trigger both a double bottom breakout and an extension of the second notable leg up from the July bottom.
If you’d like to know more about how to trade gold and silver, please visit our educational area.