
November Natural Gas Futures Break Higher as Storage Surplus Shrinks
November natural gas futures ran through four resistance levels Thursday on a 53 bcf EIA build that matched estimates. The five-year average for the week is 76 bcf. Last year the market added 77 bcf. That makes six straight below-normal injections. The surplus narrowed to 2.9% above the five-year average from 3.7% the prior week. Inventories are 4.2% below a year ago. Managed money was carrying a large net-short position and $3.150 was the line. Once November natural gas futures cleared it, the covering started and did not stop until the contract reached $3.377.
At 16:19 GMT, November natural gas futures are trading $3.336, up $0.183 or 5.80%. The session high is $3.377 and the low is $3.124.

Daily November Natural Gas Technical Analysis
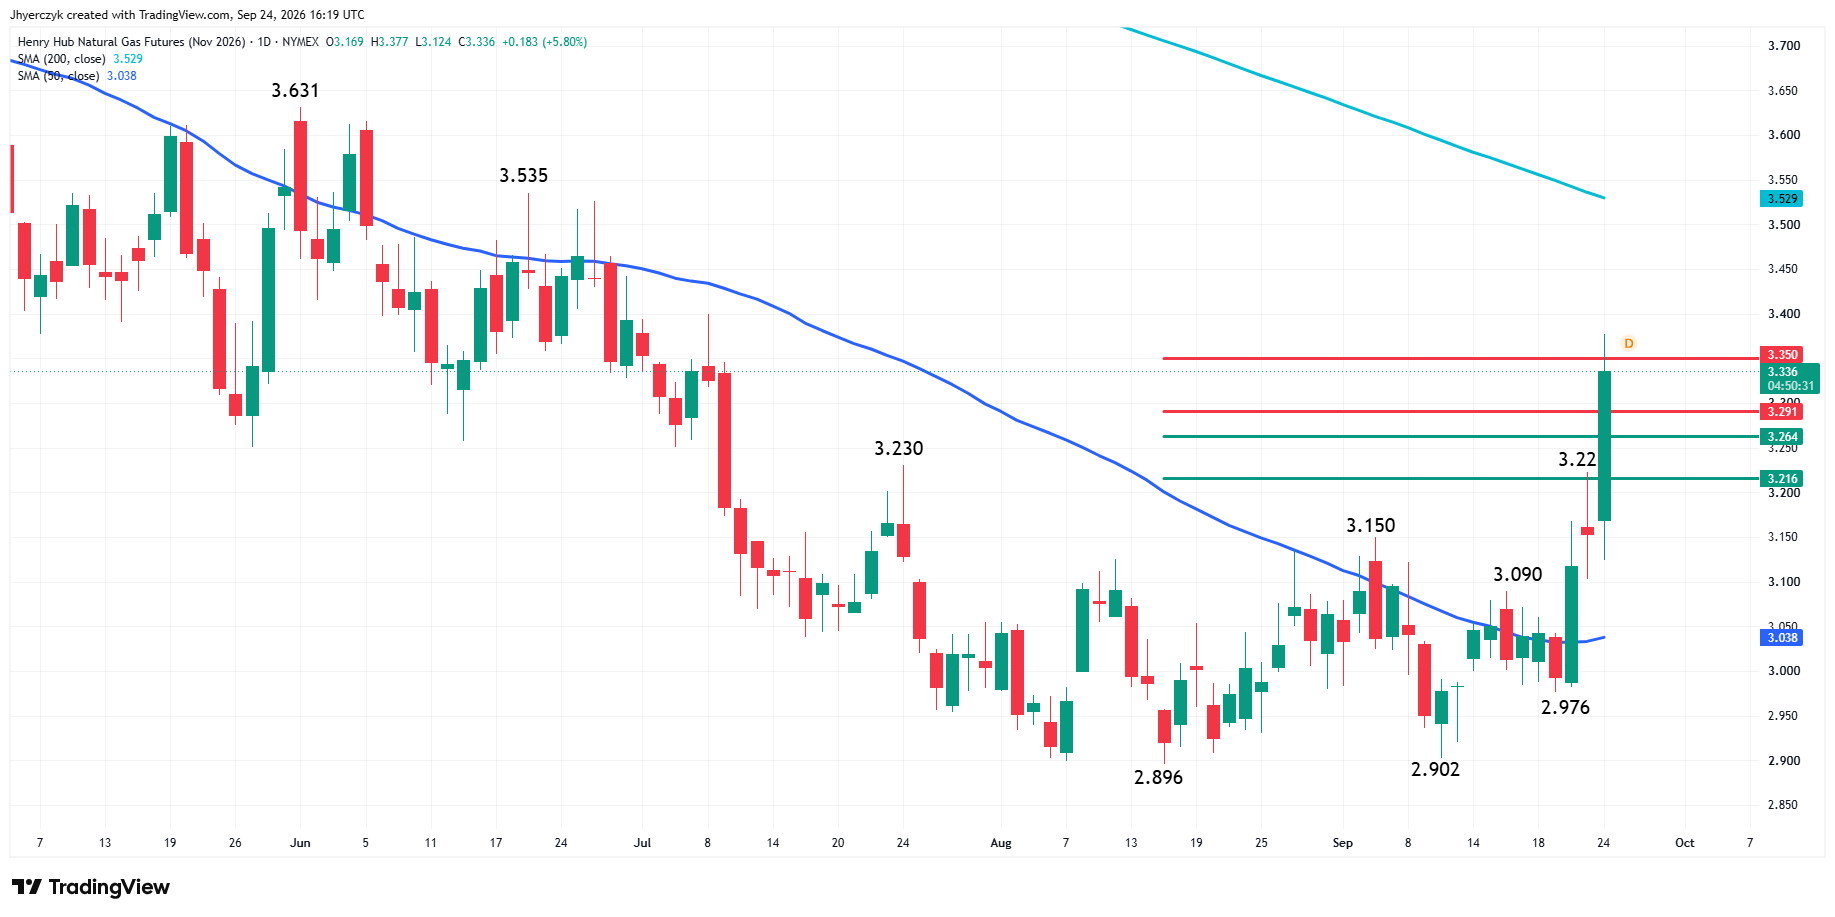
November natural gas futures are trading sharply higher Thursday after taking out the $3.150 main top. The main trend is up according to the daily swing chart. A trade through $3.377 will signal a resumption of the uptrend. A move through the main bottom at $2.976 will change the main trend to down.
The contract is above the 50-day moving average at $3.038. It is still below the 200-day moving average at $3.529. The 50-day is now the first moving-average support if the current rally starts to fade. The 200-day is the major upside target if buyers can keep taking offers.
The new main range is $2.976 to $3.377. Its retracement zone is $3.177 to $3.129. Trader reaction to this zone is likely to determine whether Thursday’s breakout is attracting new buyers or whether it was mostly short-covering ahead of the October contract’s expiration.
On the upside, November took out the retracement levels at $3.216, $3.264, $3.291 and $3.350 during the session. The $3.377 high is now the key level. A sustained move over it puts the 200-day moving average at $3.529 in play. Above that, the June main top at $3.631 becomes the next major target.
The rally does not need to pull back to prove it is real. Strong moves can stay bid when shorts are covering and buyers are taking offers. But if November falls back through $3.350 and fails to hold the $3.177 to $3.129 retracement zone, then Thursday’s surge starts to look more like a squeeze than the start of a larger winter move.
Natural Gas Price Forecast
Every new Natural Gas analysis as it publishes, today's technical signal and key levels, live price — on one page.
See all Natural Gas forecastsThe EIA Build Matched Estimates and the Market Treated It as Bullish
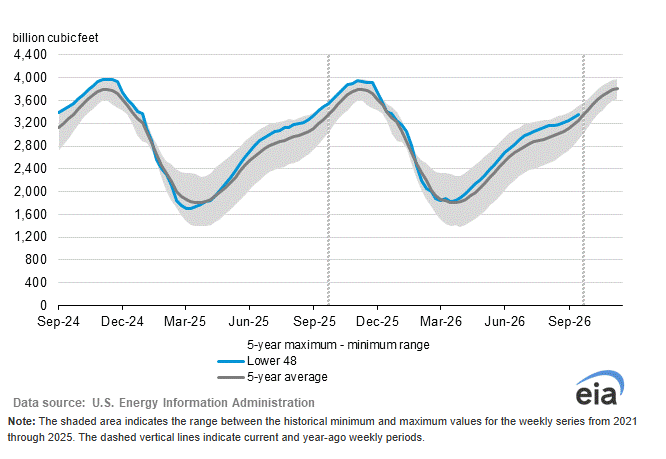
The EIA reported working gas in storage at 3,351 bcf. The 53 bcf injection was 23 bcf below the five-year average and 24 bcf below last year. A 53 bcf build is not a shortage number. The trajectory is what changed. The market had been comfortable with the surplus heading into October. Six weeks of below-normal builds took that comfort away.
Production Fell to an 11-Week Low While LNG Held
Lower-48 dry gas production was tracking near 109.8 bcf per day Thursday, an 11-week low according to BNEF. Louisiana and Pennsylvania led the decline. The September monthly average is still near record levels around 112.9 bcf per day. One daily print is not a supply disruption. It landed on a day when the storage build was already below normal and a large short position was already under pressure.
LNG feedgas flows to the nine major U.S. export terminals have averaged about 18 bcf per day in September, up from 17.2 bcf per day in August. Cove Point maintenance has limited some flows. Europe and Asia are still buying ahead of winter while Persian Gulf disruptions keep LNG supply risk in the market.
Short Covering Ran the Market Through Four Levels
October open interest fell sharply ahead of expiration. November open interest also declined. Prices up with open interest down. Once November natural gas futures cleared $3.150, shorts started covering. The market ran through $3.216, $3.264, $3.291, and $3.350 in one session.
The EIA number was enough to make the short side uncomfortable. The covering turned a modest bullish report into a 5.80% session. The question heading into next week is whether new longs replace the shorts that just left or whether the move fades once the covering runs out.
South-Central Heat Is Keeping Power Burn in the Market
Above-normal heat is lingering across the South-Central United States into early October. Late-season power burn is still active. A Nor’easter is expected to bring cooler conditions to the Southeast.
The weather is not clean enough to sell into this rally and it is not strong enough to drive it alone. The next few EIA reports do the work. If injections keep coming in below normal while production is not making new highs, the surplus keeps shrinking heading into November.
What to Watch
The $3.177 to $3.129 retracement zone is where Thursday’s breakout holds or fails on a pullback. The 200-day at $3.529 is the target if buyers stay with it. Next week’s EIA report is the test. The surplus is at 2.9%. Production dipped. LNG demand held. Thursday squeezed the shorts through four levels. Whether it brought in new longs is the answer the market gives next week.
More Information in our Economic Calendar.