Bullish Breakout Gains Momentum
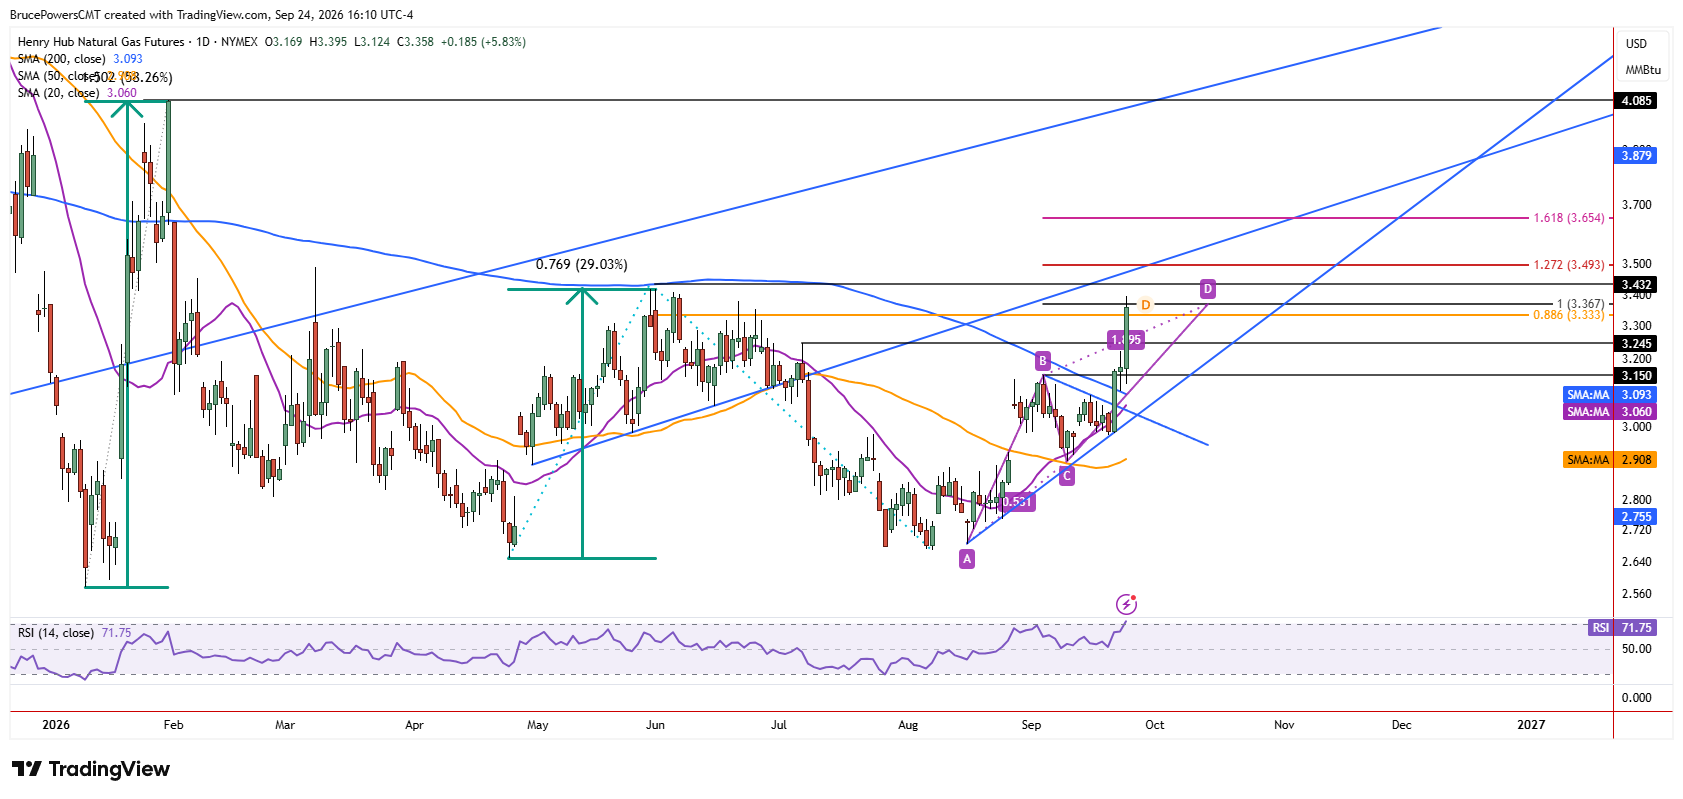
Natural gas extended its bullish breakout above the 200-day moving average to a 13-week high of $3.395 on Thursday, with the move seemingly supported by lean storage expectations as well as the technical recovery. Buyers remain in control at the time of writing, with trading continuing in the upper third of the day’s range. In addition to the surge in buying pressure indicated by a long bullish candle, strength was shown by the recovery of the lower swing high of $3.245 from July.
Since that swing high marked the beginning of a bearish correction triggered by a break below key trend support, including the 50-day moving average, reclaiming that level is a sign of strength. When combined with this week’s sustained reclaim of the 200-day moving average, the intermediate-term bullish outlook for natural gas is improving and supports the potential for further upside.

First Upside Target Reached
In the short-term, natural gas reached its first key upside target on Thursday, defined by the 100% projection of a rising ABCD pattern at $3.367. It is reinforced as a resistance zone by the 88.6% Fibonacci retracement of the prior decline at $3.333. Although natural gas began to weaken from that zone, signs of continued intraday strength and a strong close would increase the potential for higher targets to be approached prior to a notable pullback. A sustained move above this initial resistance zone would therefore strengthen the case for continued upside.
Closing Price Could Confirm Strength
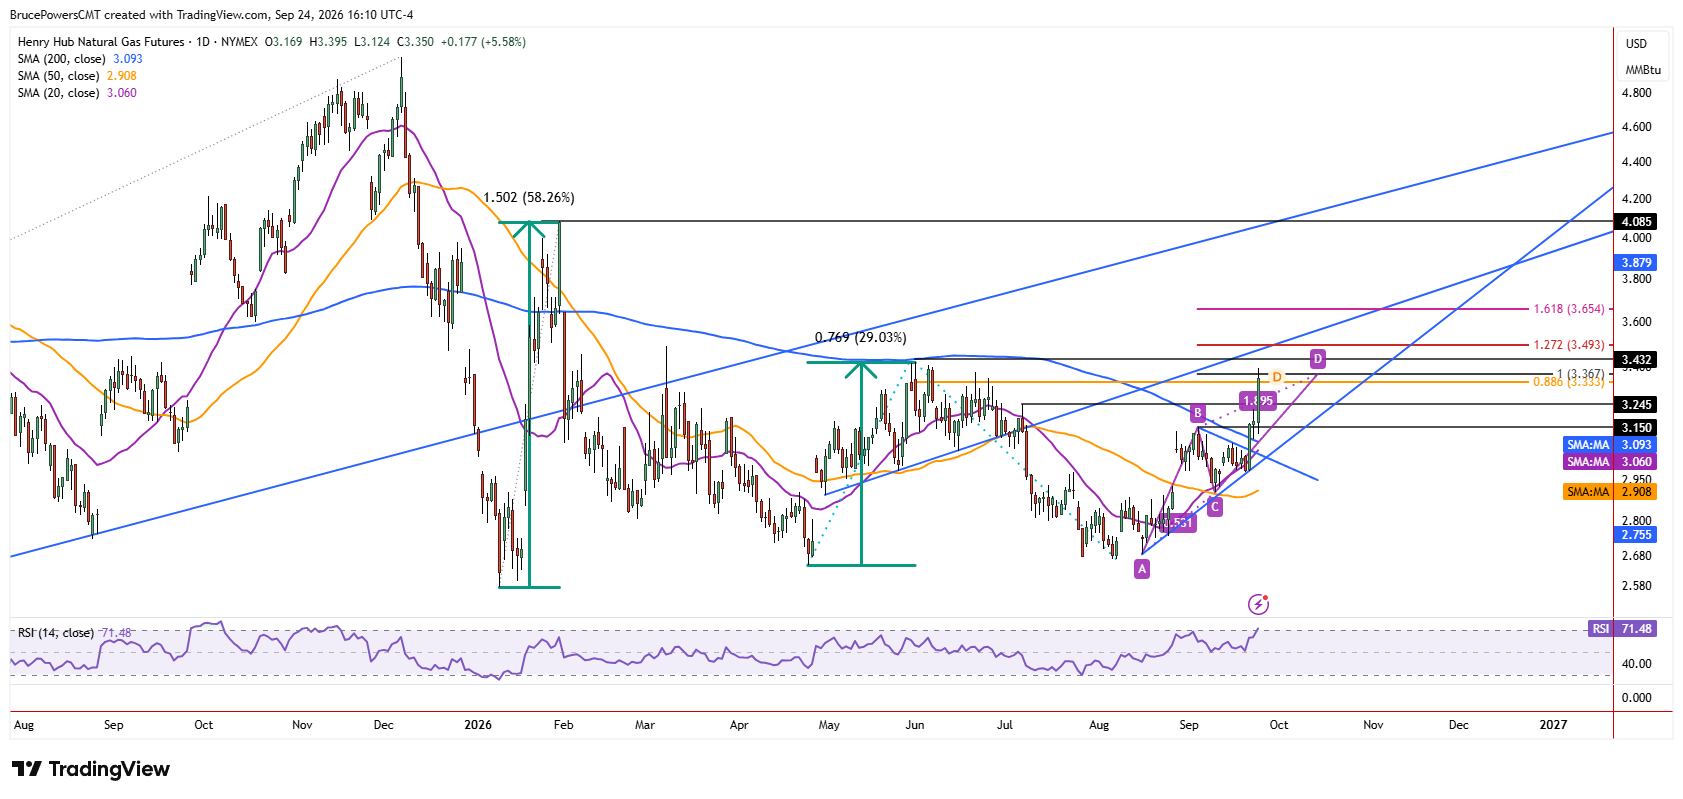
Thursday’s closing price will also send a signal. The highest daily closing price since the April bottom was $3.39 in June, while the second highest was $3.33 in May. This means that Thursday’s session may end at the second-highest closing price since April, providing a further sign of strengthening of demand. A close near or above $3.33 would reinforce the recent improvement in the bullish structure.
Key Resistance, Support Define Next Move
The June 1 high of $3.418 is a lower swing high and the top of a potential resistance zone. Since strength has followed the sustained reclaim of the 200-day moving average, that high could eventually be exceeded and provide a long-term bullish reversal signal. If exceeded to the upside, the 127.2% Fibonacci projection for the rising ABCD pattern points to $3.493.
Nevertheless, traders will be watching pullbacks carefully for evidence of sustainable support that could lead to a bullish continuation. The July swing high at $3.245 and the early September swing high of $3.15 (B) are two additional potential support areas, along with the 200-day moving average, currently near $3.09. A successful pullback into one of these areas would help determine whether Thursday’s breakout can develop into a sustained advance.
Natural Gas Price Forecast
Every new Natural Gas analysis as it publishes, today's technical signal and key levels, live price — on one page.
See all Natural Gas forecastsIf you’d like to know more about how to trade natural gas, please visit our educational area.