The S&P 500 Index Absorbed the Rate Shock but Technology Did Not
The S&P 500 Index is down a tenth of a percent Thursday. XLK is down 0.67%. The broad market is absorbing the 10-year near 5.15% and the 30-year at 5.446%. Technology is not. The split between the index and the sector started when yields broke higher on Wednesday’s PMI data and it widened Thursday. Oracle’s force majeure report on the New Mexico data-center project gave the AI trade a company-specific reason to sell. The yield market gave it a broader one.
At 18:10 GMT, the S&P 500 Index is trading 7,698.25, down 7.78 or 0.10%. The session high is 7,719.01 and the low is 7,662.57. At 18:14 GMT, the Technology Select Sector SPDR Fund is trading $194.03, down $1.31 or 0.67%. The session high is $195.20 and the low is $192.61.
The Bond Market Is Deciding Where the Money Goes
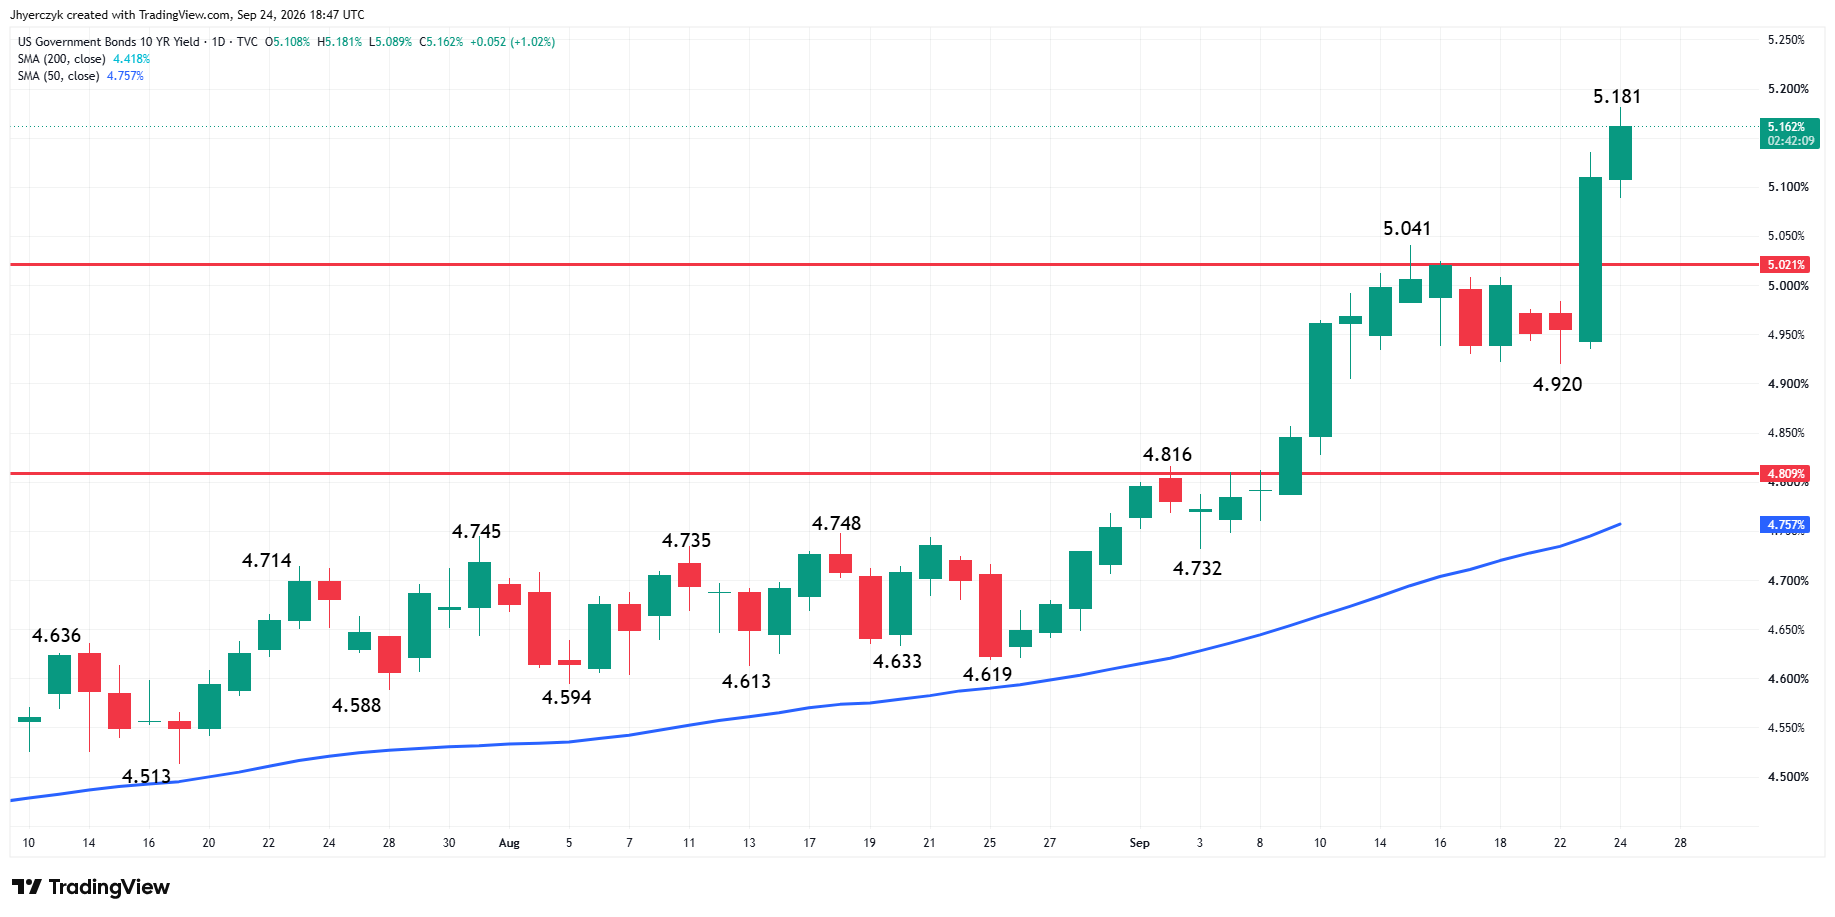
The 10-year Treasury yield is near its highest since July 2007. The 30-year is at a level last seen in 2004. Fed funds futures are carrying about a 66% chance of another rate hike in October, up from roughly 55% a week ago.
Wednesday’s PMI readings from S&P Global gave the bond market the push. Services and manufacturing activity remain strong. Higher crude oil prices are keeping the inflation argument alive. The economy is strong enough to keep corporate revenue expectations intact. The same strength is keeping the Fed in play and that is where the S&P 500 Index and XLK separate.
Energy and refiners are holding the broad index together Thursday. Technology, solar, and AI infrastructure names are taking the selling. XLK is weaker than the S&P 500 Index even after the midday bounce. Oracle gave sellers a reason. The yield market confirmed it.
UBS still sees limited energy disruption and an inflation shock that is not broad enough to derail growth. The firm remains positioned for equity upside but warned that geopolitical risk, inflation, government debt, and the sustainability of AI spending can keep volatility high.
Dow Jones Price Forecast
Every new Dow Jones analysis as it publishes, today's technical signal and key levels, live price — on one page.
See all Dow Jones forecastsThe Hormuz Headline Helped the S&P 500 and Did Nothing for Tech
Reuters reported that U.S. and Iranian negotiators are discussing a phased path to reopen the Strait of Hormuz while the United States lifts its blockade. Not a signed agreement. Not a change in tanker traffic. Not proof that the Strait is open.
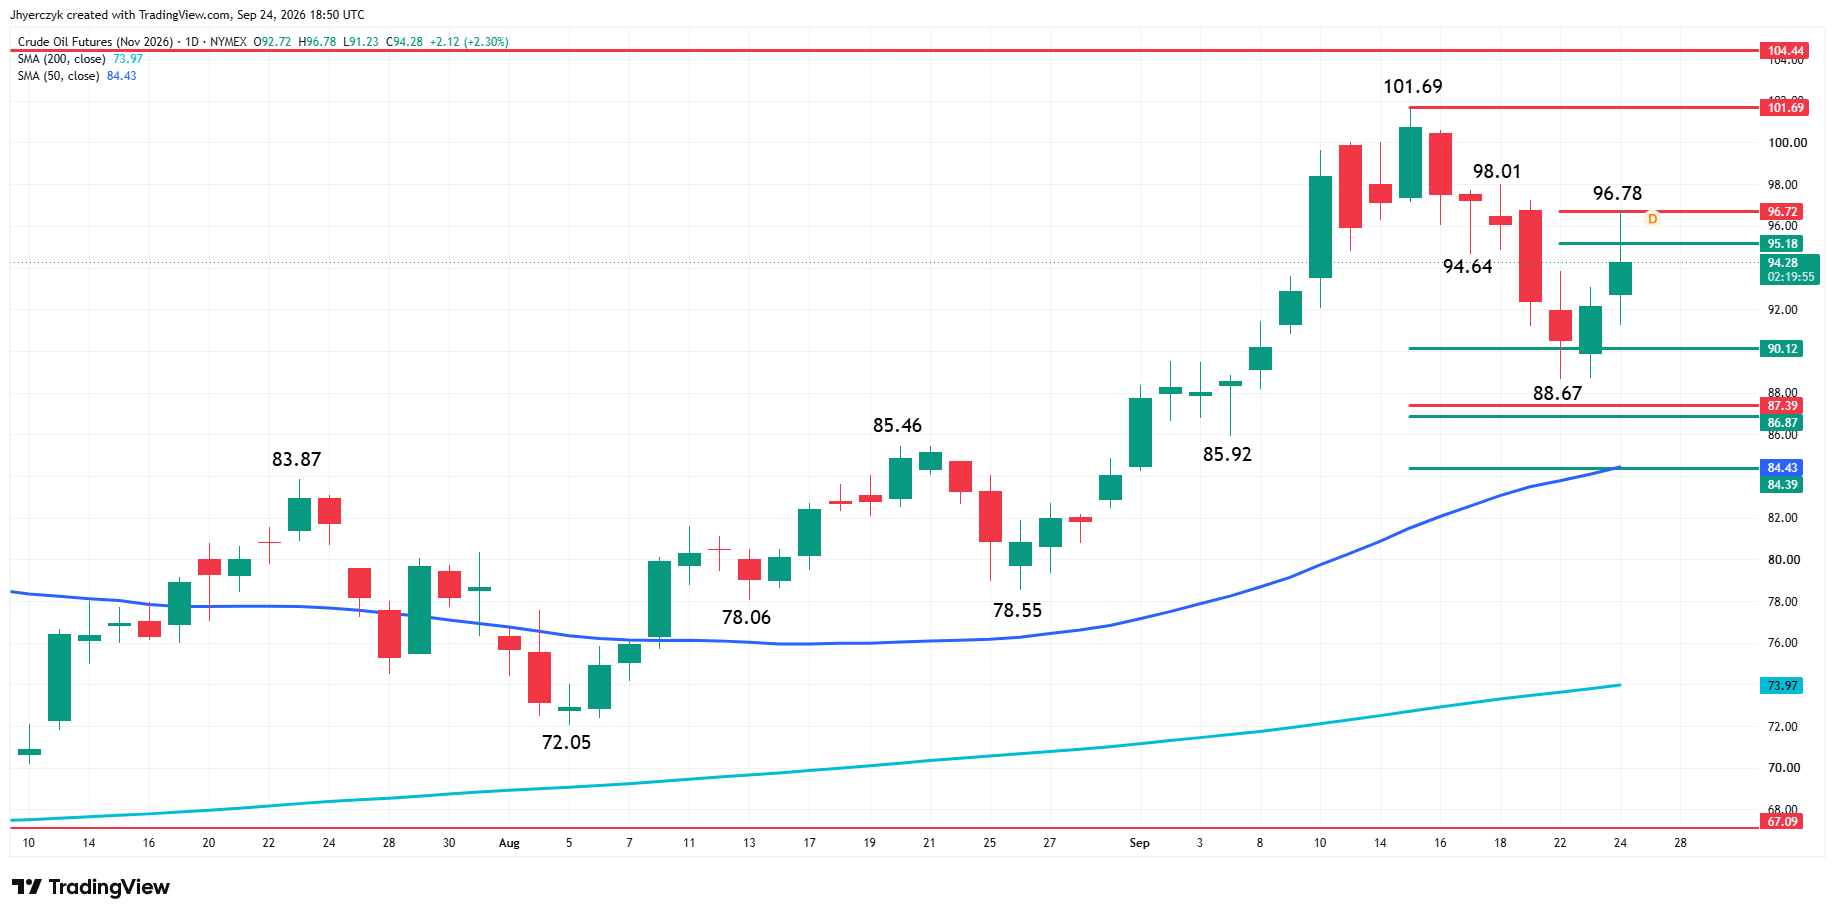
November WTI crude oil futures dropped from $96.78 to near $91 on the headline before recovering. The S&P 500 Index bounced with it. XLK did not get the same lift. Cheaper crude can ease one of the inflation pressures pushing yields higher. Talks alone do not do that. The 10-year stayed near 5.15% after the crude reversal.
The S&P 500 Index recovered because the worst-case Middle East risk was reduced for one session. The technology trade needs more than a diplomatic headline to change the discount rate it is trading against.
Daily S&P 500 (SPX) Technical Analysis
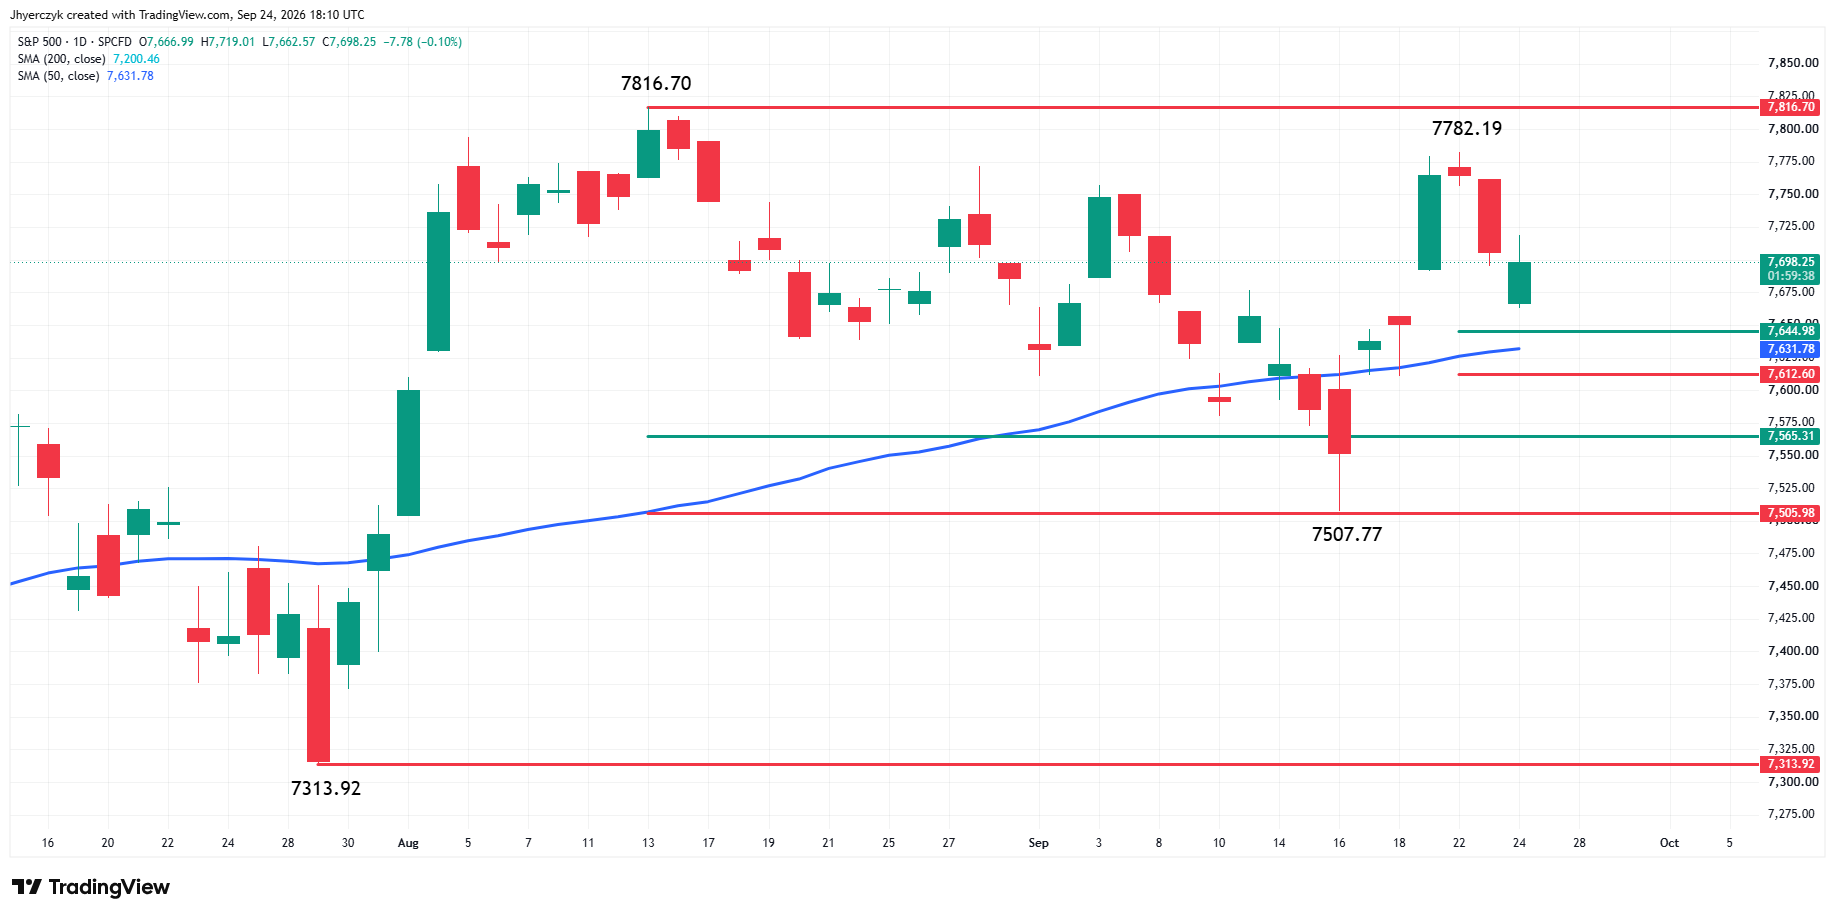
The main trend is up according to the daily swing chart. A trade through the main top at 7,816.70 will signal a resumption of the uptrend. A move through the main bottom at 7,507.77 will change the main trend to down.
The S&P 500 is trading on the strong side of the 50-day moving average at 7,631.78. The 200-day moving average is far below the market at 7,004.46.
The short-term range is 7,507.77 to 7,782.19. Its retracement zone at 7,644.98 to 7,612.60 is the first downside target. The 50-day moving average runs through this area at 7,631.78, creating a support cluster. The index has not tested the zone yet. Its session low at 7,662.57 stopped above it.
If sellers drive the index into the support cluster, trader reaction is likely to determine the next major move. Buyers showing up could create enough upside momentum for a retest of 7,782.19, then the 7,816.70 main top. A sustained break through the 61.8% level at 7,612.60 and the 50-day moving average would put the 7,507.77 main bottom back on the chart.
Daily Technology Select Sector SPDR Fund Technical Analysis
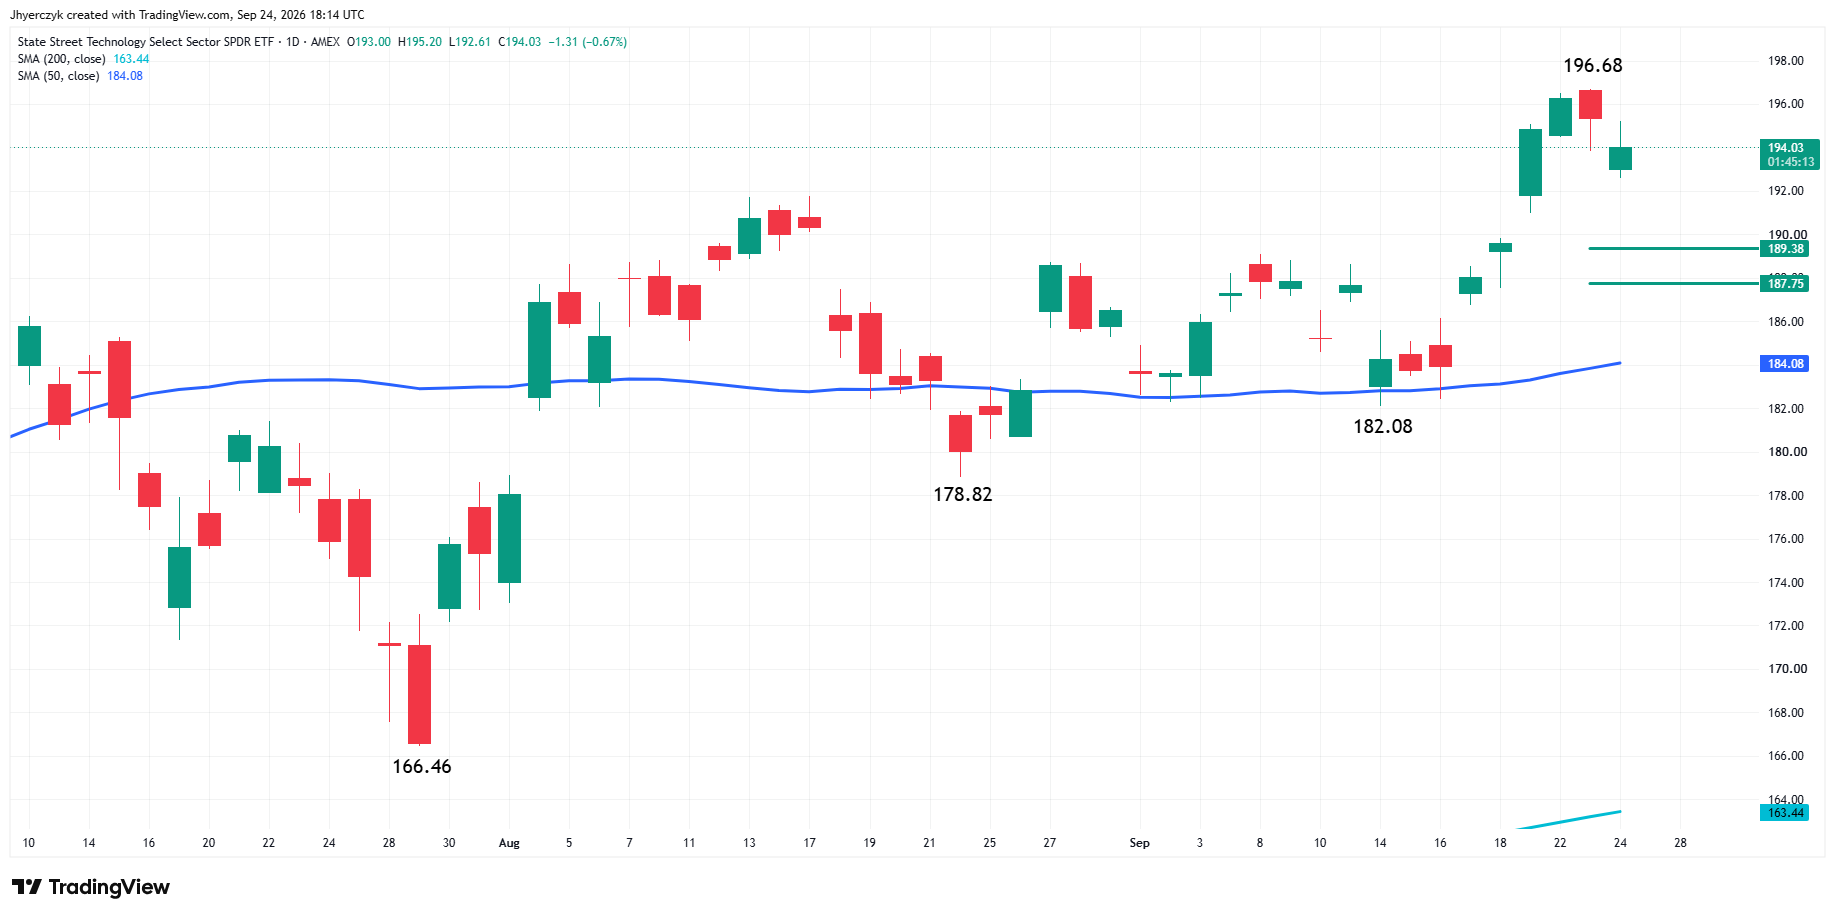
XLK is pulling back after reaching a new high at $196.68. The main trend is up according to the daily swing chart. A trade through $196.68 will signal a resumption of the uptrend. A move through the main bottom at $182.08 will change the main trend to down.
The fund is trading well above its 50-day moving average at $184.08. The 200-day moving average is at $163.44. The moving averages are still pointing higher, but the gap between price and the 50-day tells you how much room sellers have if the yield trade keeps getting bigger.
The new main range is $182.08 to $196.68. Its retracement zone at $189.38 to $187.75 is the first downside target. XLK has not tested this area yet. Trader reaction to it will tell us whether buyers are still willing to support technology on a pullback or whether the rate trade is forcing more exposure out of the sector.
The $196.68 high is the key upside level. A sustained move over it puts buyers back in control. A break through $189.38 to $187.75 would be the first sign that the selling is reaching beyond one weak session.
What to Watch
The 10-year near 5.15% and October hike odds near 66% are running the trade. The S&P 500 Index has the 7,644.98 to 7,612.60 support cluster with the 50-day at 7,631.78 inside it. The session low at 7,662.57 stopped above that zone. XLK has $189.38 to $187.75 below. Neither market has tested those areas yet.
The Hormuz story helped the broad index Thursday but it did not lower yields enough to change the technology trade. Reuters reported ongoing talks. The market needs tanker flows and shipping changes before the energy premium comes out in a way that matters for the discount rate. The bond market decides whether the S&P 500 Index and XLK support zones bring in buyers or become the next areas sellers press.
More Information in our Economic Calendar.