Thursday Reversal Reclaims 20-Day Average
WTI crude oil triggered a one-day bullish reversal signal on Thursday, rallying to a three-day high of $100.43. Prior resistance at the July swing high of $94.337 was successfully tested as support during a pullback to a low of $92.248 on Wednesday, which completed a 50% retracement of the prior advance. Strength from that support area was reinforced during Thursday’s advance by the reclaim of the 20-day moving average, which has been tested as support this week. Together, the successful test and recovery of the 20-day moving average provide early confirmation that buyers are regaining control of the short-term trend.

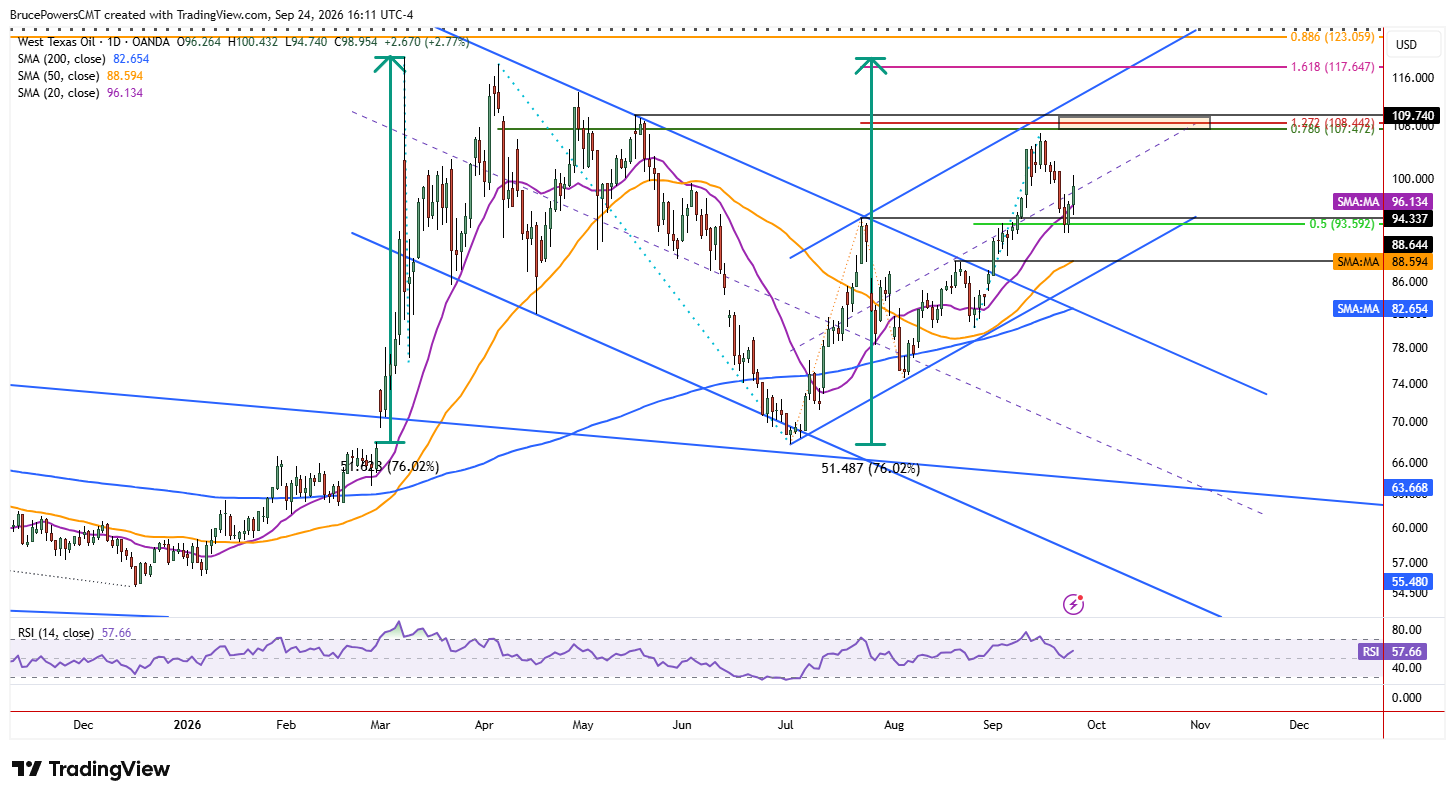
$92.248 Higher Low Draws the Fork
Retaining dynamic support near the 20-day moving average is bullish and shows improving underlying demand. Given Thursday’s bullish price action, the developing structure now gas support at a higher swing low of $92.248. That low may mark the start of another leg up in a larger advance toward a new high for the current bullish trend.
Alternatively, a lower swing high could develop and begin a second leg down from the recent $106.84 peak. If a second leg down occurs, then Wednesday’s low would be at risk of being broken and potentially targeting the interim swing high of $88.46 and the rising 50-day moving average near $88.58. Therefore, how price behaves around the recent higher low should help determine whether the bullish reversal develops into a sustained advance.
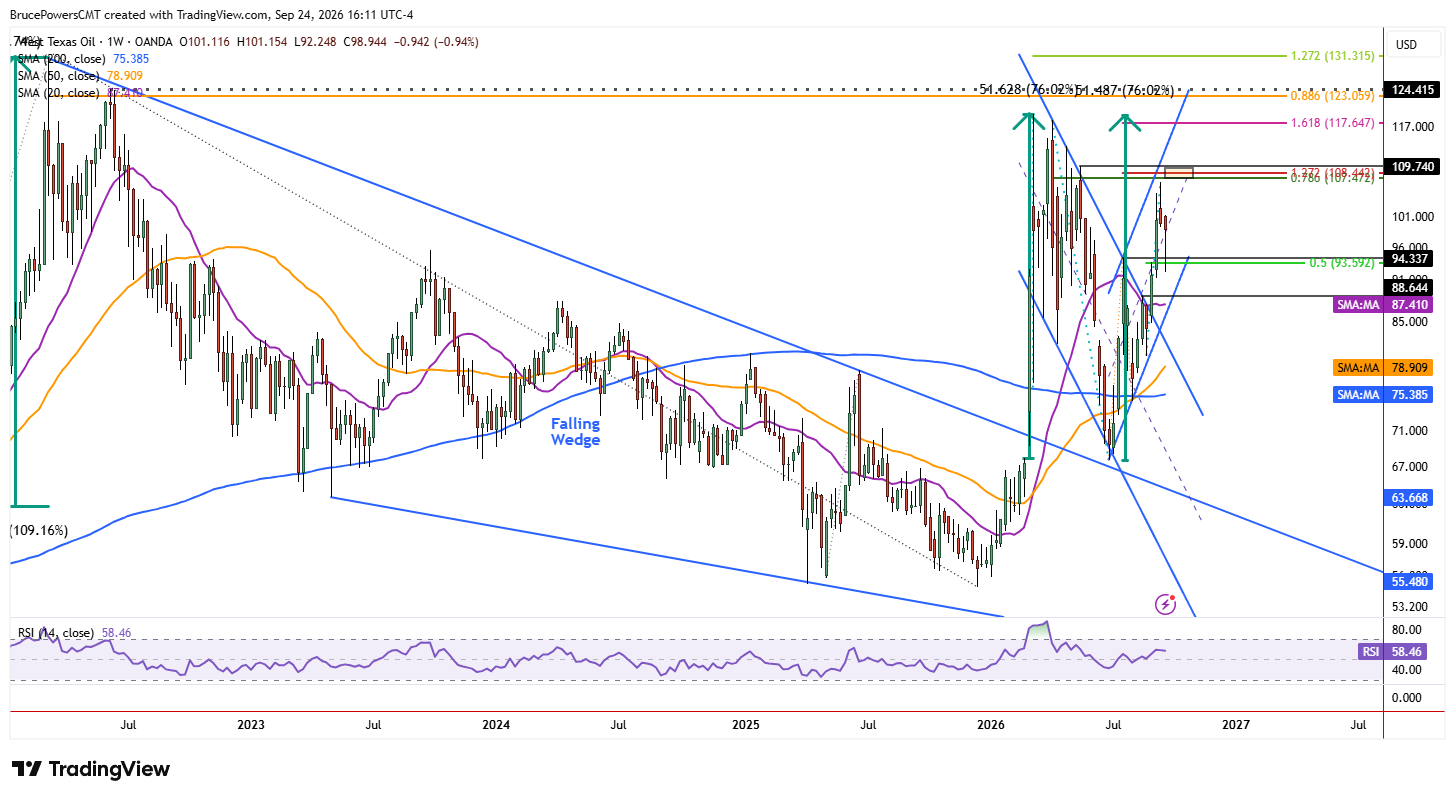
Measured Move Still Points Near $119
Alternatively, if buyers can extend the trend above $106.84, a potential resistance zone extends around $107.47 to $109.74, which could stop or stall momentum. However, a decisive recovery above that zone would suggest that higher targets may be reached. A 161.8% Fibonacci harmonic projection for a rising ABCD pattern is at $117.65, reinforced by a measured move target near $119.00.
If reached, that would put crude oil very near this year’s highs of $119.544 and $118.292, increasing the chance for period of exhaustion that could lead to corrective action. The measured move reference takes the sharp spring advance and projects it forward from the higher swing low in July. Thus, while the recent reversal strengthens the near-term bullish structure, the reaction to resistance and the durability of support will remain critical to determining whether WTI can eventually challenge its yearly highs.