Apple Technical Analysis
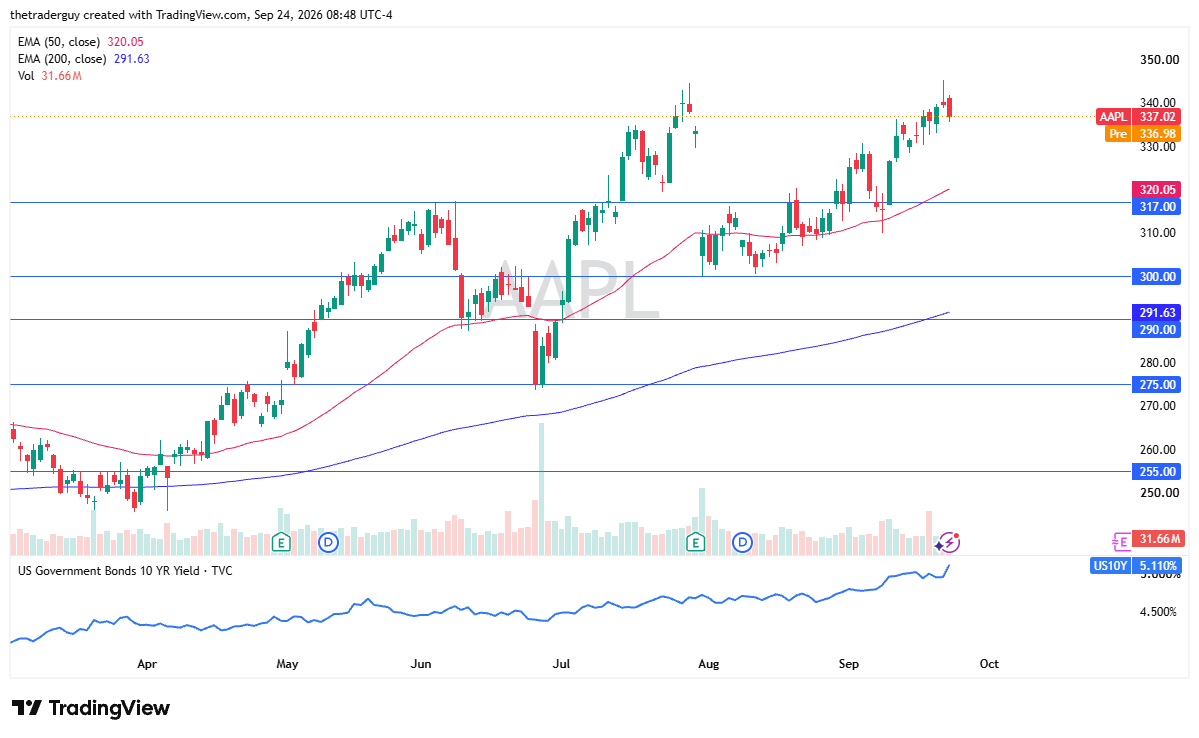
Apple looks like it is going to be a little sluggish at the open, not necessarily bearish, just a few cents below where it had closed. But it is worth noting that we had just formed a shooting star on Tuesday at the recent swing high. So, are we forming a double top? We will have to wait and see. But I would suspect at this point in time that any pullback will eventually attract value hunters. A break above the shooting star from Tuesday obviously would be very bullish.

Microsoft Technical Analysis
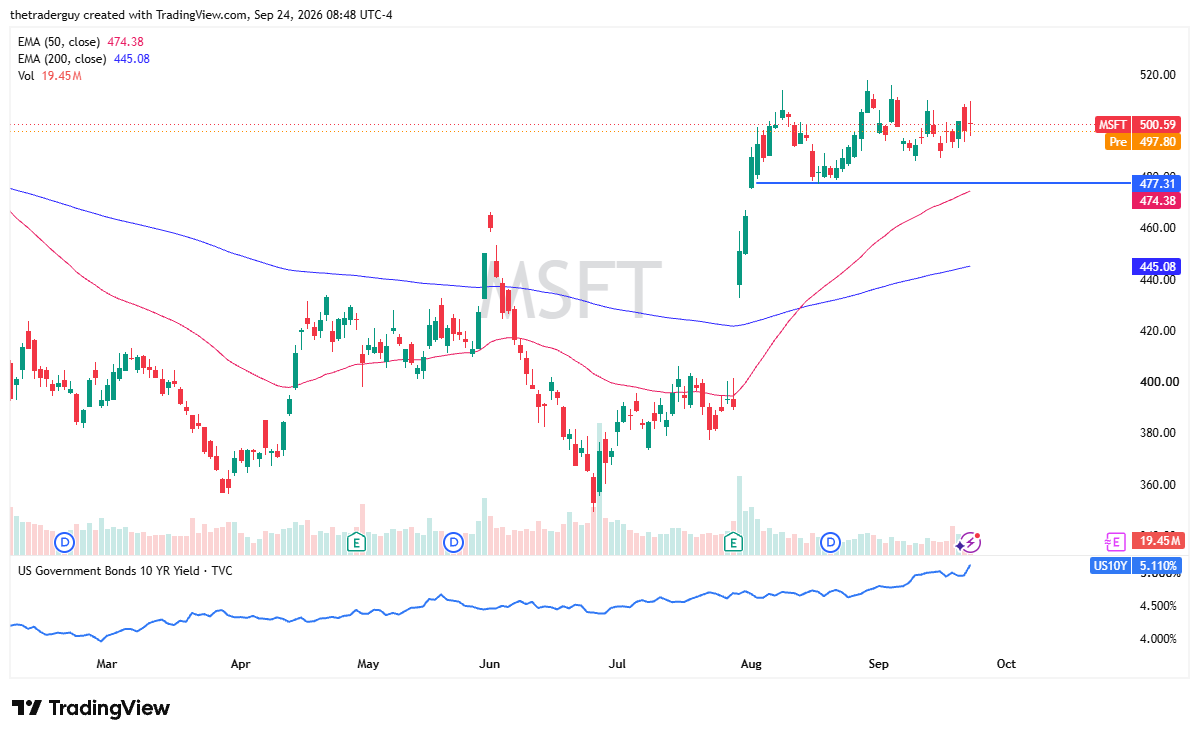
Microsoft looks like it is going to be a little bit soft at the open, but is still very much in a consolidation range. And I think that is probably the story here. Somewhere around $518 is significant resistance. If we were to break above that, it would be bullish and would continue the overall move. Higher interest rates are not helping the situation, so that might be part of what we are seeing here. But overall, this is a market that longer term does look bullish. It is just middling right here in this range.
Amazon Technical Analysis
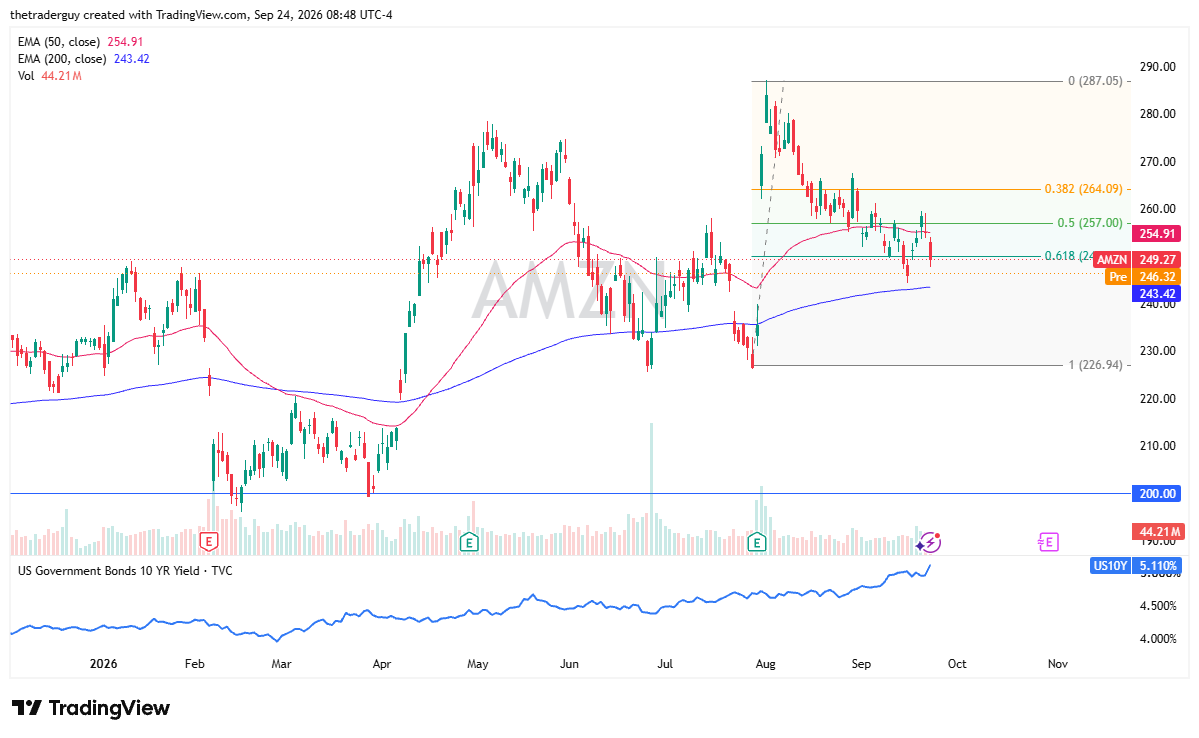
Amazon is currently between the 50-day EMA and the 200-day EMA indicators. The 200-day EMA is down to the $243.42 level and does offer support. If we were to turn around and rally from here, breaking above the 50-day EMA could open up the possibility of a move to the $260 level and beyond.
This is a market that I think is going to be interesting to watch because there are transportation costs when it comes to energy. There are concerns about the U.S. consumer with inflation rising. But at the same time, the U.S. consumer continues to spend. I can tell you, as an American, when I go to shopping centers, they are still packed. So longer term, I suspect this could offer a little bit of value, but it could be noisy in the meantime.
If you’d like to know more about technical analysis and how traders use it, please visit our educational area.