Uniswap (UNI) could fall toward $7.80 in the coming weeks as its latest rally runs into major Fibonacci resistance, the weekly RSI turns overbought, and leveraged longs build up below the current price.

UNI Rally Stalls Near $11.50 Resistance
UNI was trading near $9.21 on Sept. 24, after surging to an intraweek high of roughly $10.95.
The rally brought Uniswap close to the 0.786 Fibonacci retracement level near $11.51, close to my prediction earlier in September. However, UNI failed to sustain its advance toward the level and has since retreated, leaving a sizeable upper wick on the developing weekly candle.
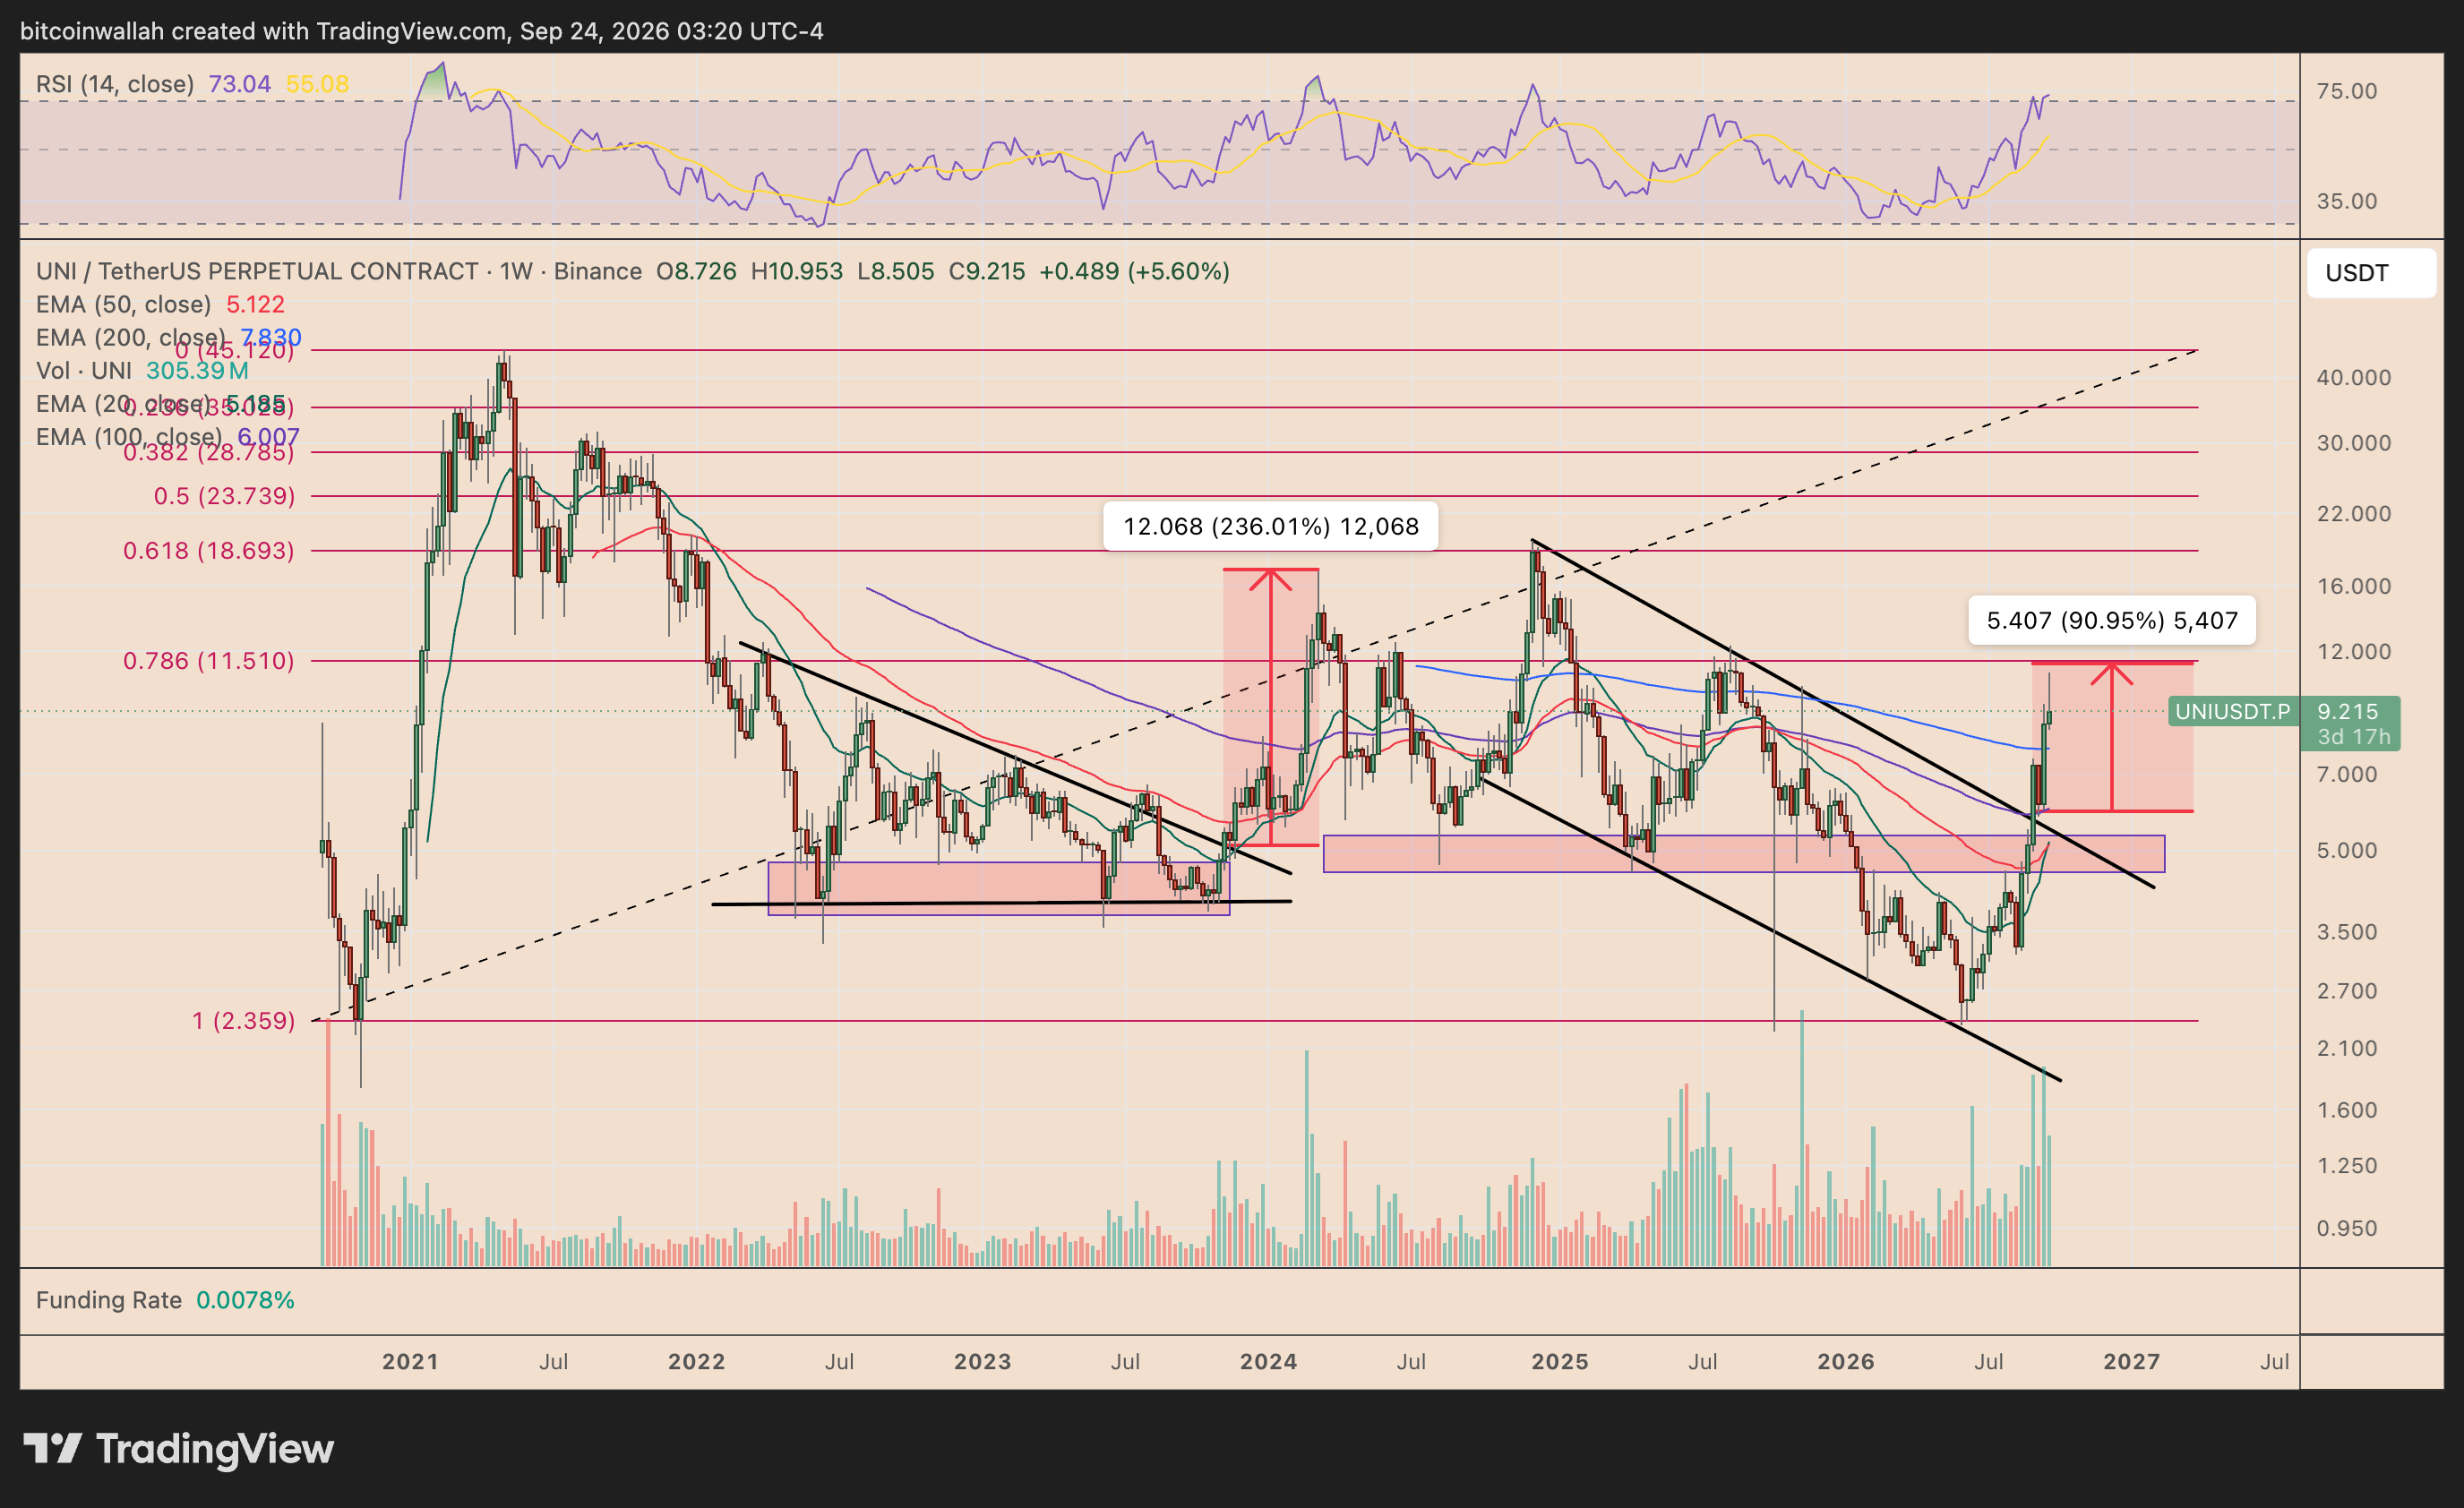
That rejection comes as UNI’s weekly relative strength index (RSI) rises to around 73, moving above the traditional overbought threshold of 70.
An overbought RSI does not guarantee an immediate selloff. Strong cryptocurrencies can remain above 70 while momentum stays elevated. Nevertheless, previous sharp UNI rallies visible on the weekly chart have often been followed by consolidation or multi-week corrections as traders take profits.
The first important downside target sits near UNI’s 200-week exponential moving average (200-week EMA, blue) at approximately $7.83.
A decline from $9.21 toward the 200-week EMA would represent a roughly 15% correction.
If that level fails to hold, UNI could extend the pullback toward its 100-week EMA (purple) near $6.91. Still, the broader structure remains stronger than earlier this year, with UNI trading above its major weekly moving averages after breaking a long-term descending resistance trendline.
UNI Long Liquidations Could Accelerate the Drop
Derivative positioning adds another layer of downside risk.
CoinGlass’s one-month Binance UNI/USDT liquidation heatmap shows a major concentration of long-liquidation leverage around $8.87, just below the current price.
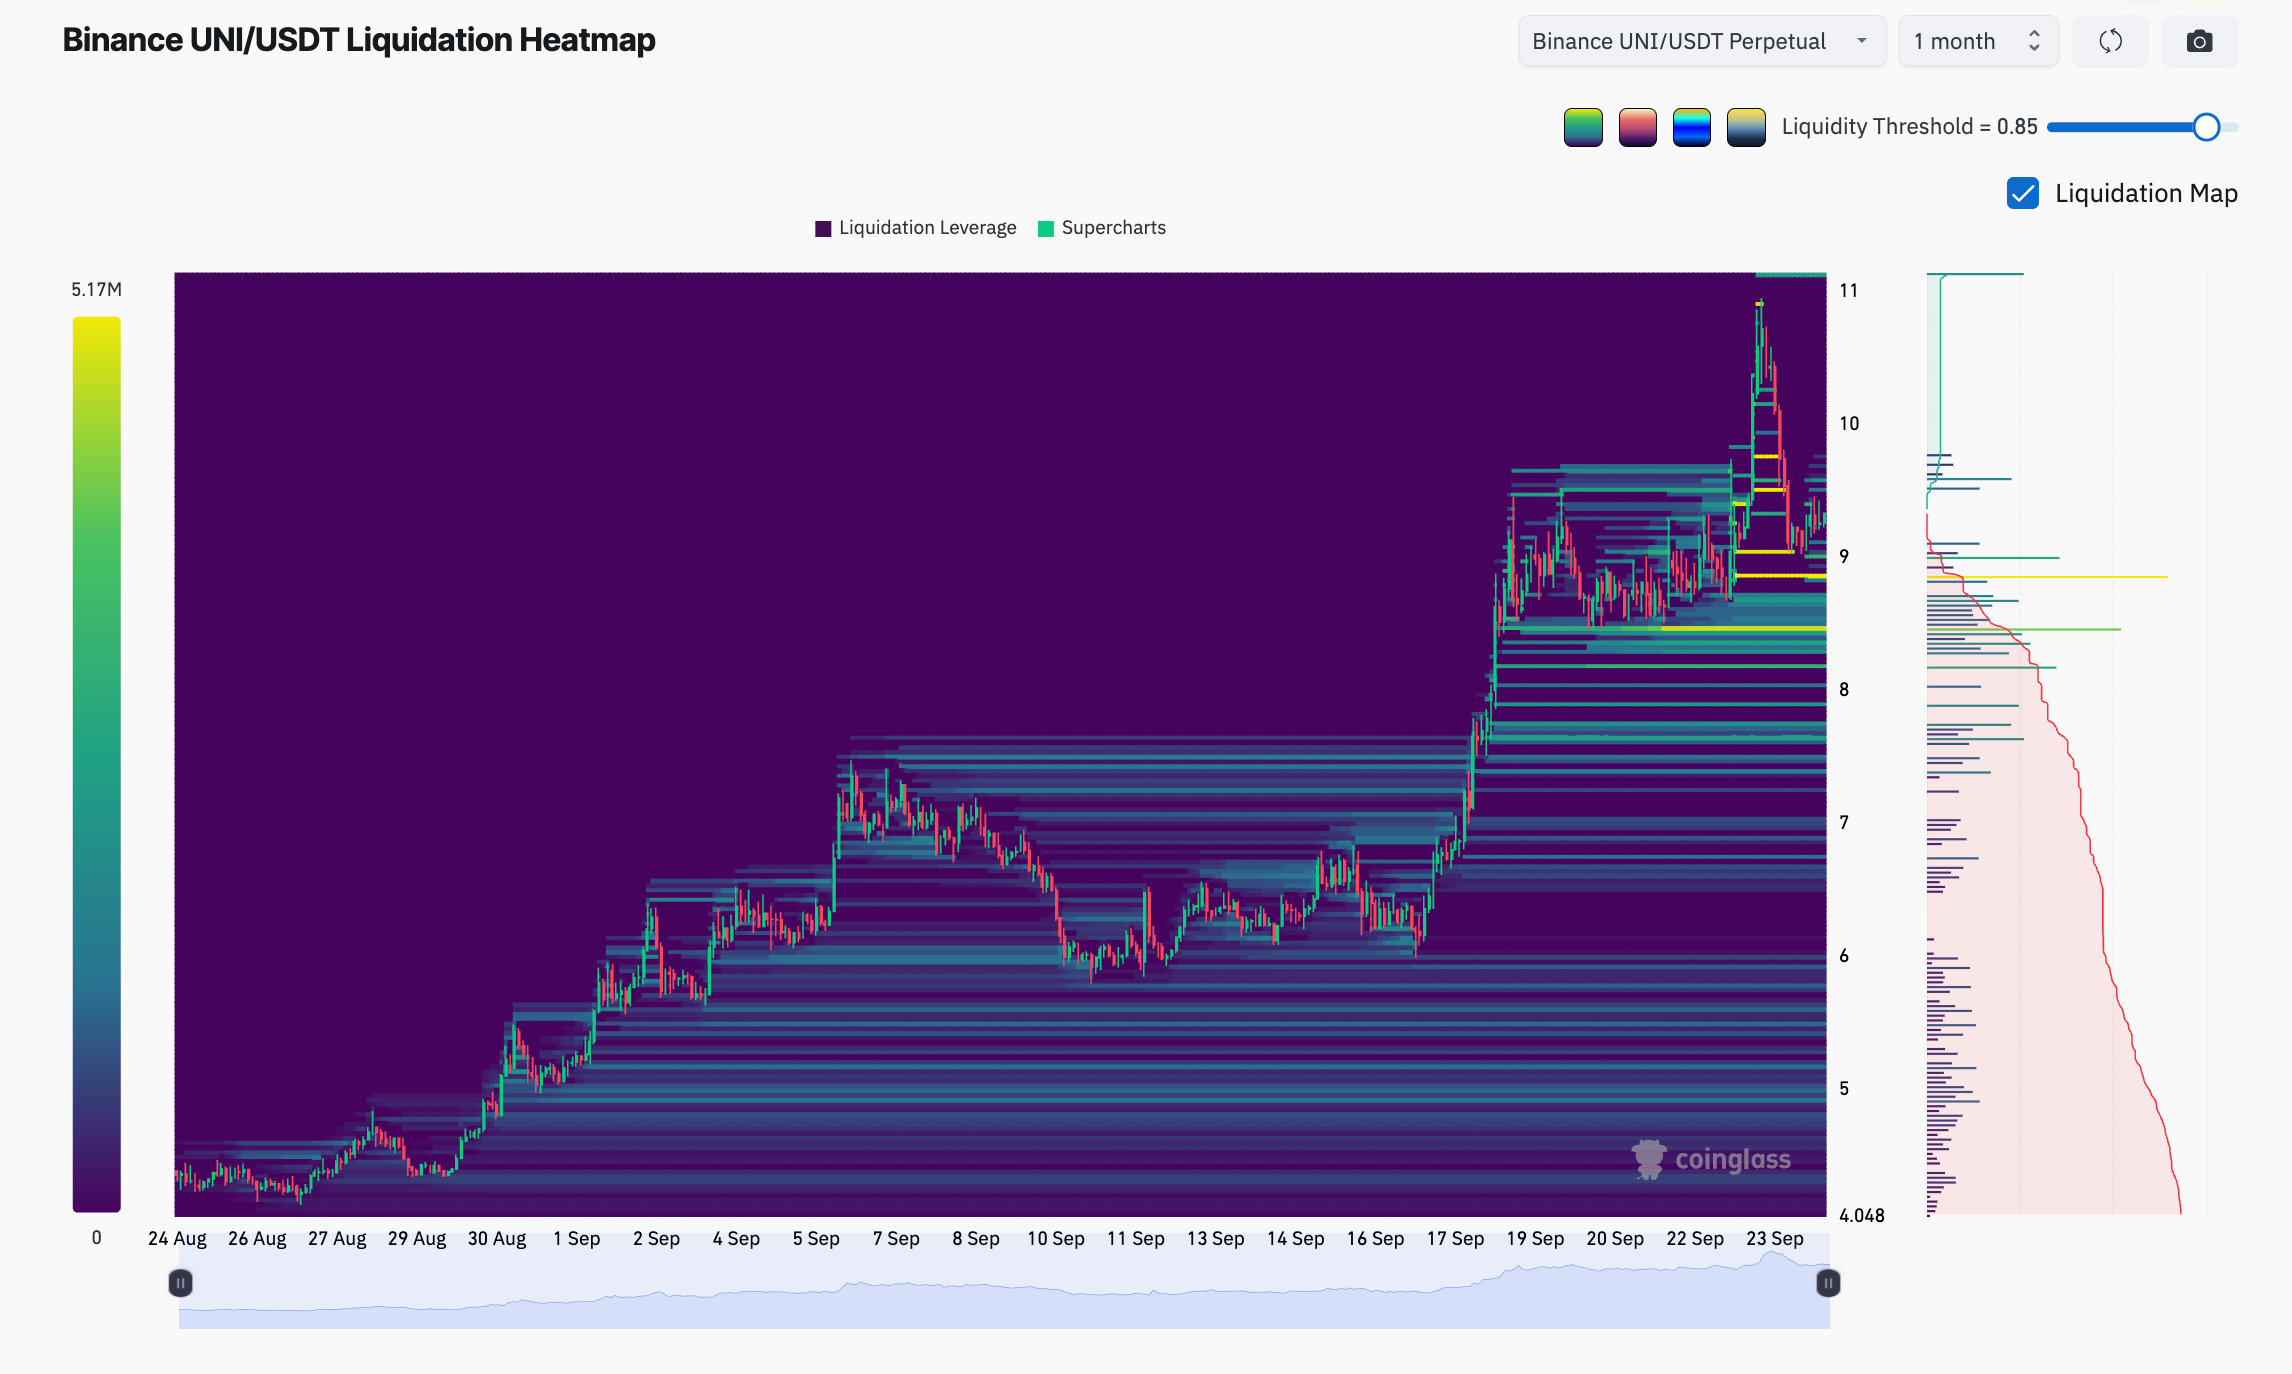
That creates a potential feedback loop. If UNI starts falling, leveraged long positions may be automatically closed, generating additional sell pressure and potentially accelerating the move toward lower technical support.
The heatmap also shows short-liquidation liquidity above the market, meaning another rally could still trigger a squeeze. However, the sizeable pool of leveraged longs immediately below UNI makes $8.87 an important near-term downside magnet.
A sweep of that liquidity could open the door toward the $7.80-$7.85 support zone, where the 200-week EMA sits.
If buyers defend that area, UNI could stabilize and eventually retest $11.50. A decisive loss of $7.80, however, would strengthen the case for a deeper correction toward $6.90.