Uniswap (UNI) is leaning bullish on the weekly chart, with the reclaim of its old $4–$5 support zone and a break above the 100-week EMA putting a 90% move toward $11.50 in play.
UNI Reclaims the Zone That Preceded Its Last Major Rally
The red-shaded $4–$5 area stands out most on UNI’s weekly chart.
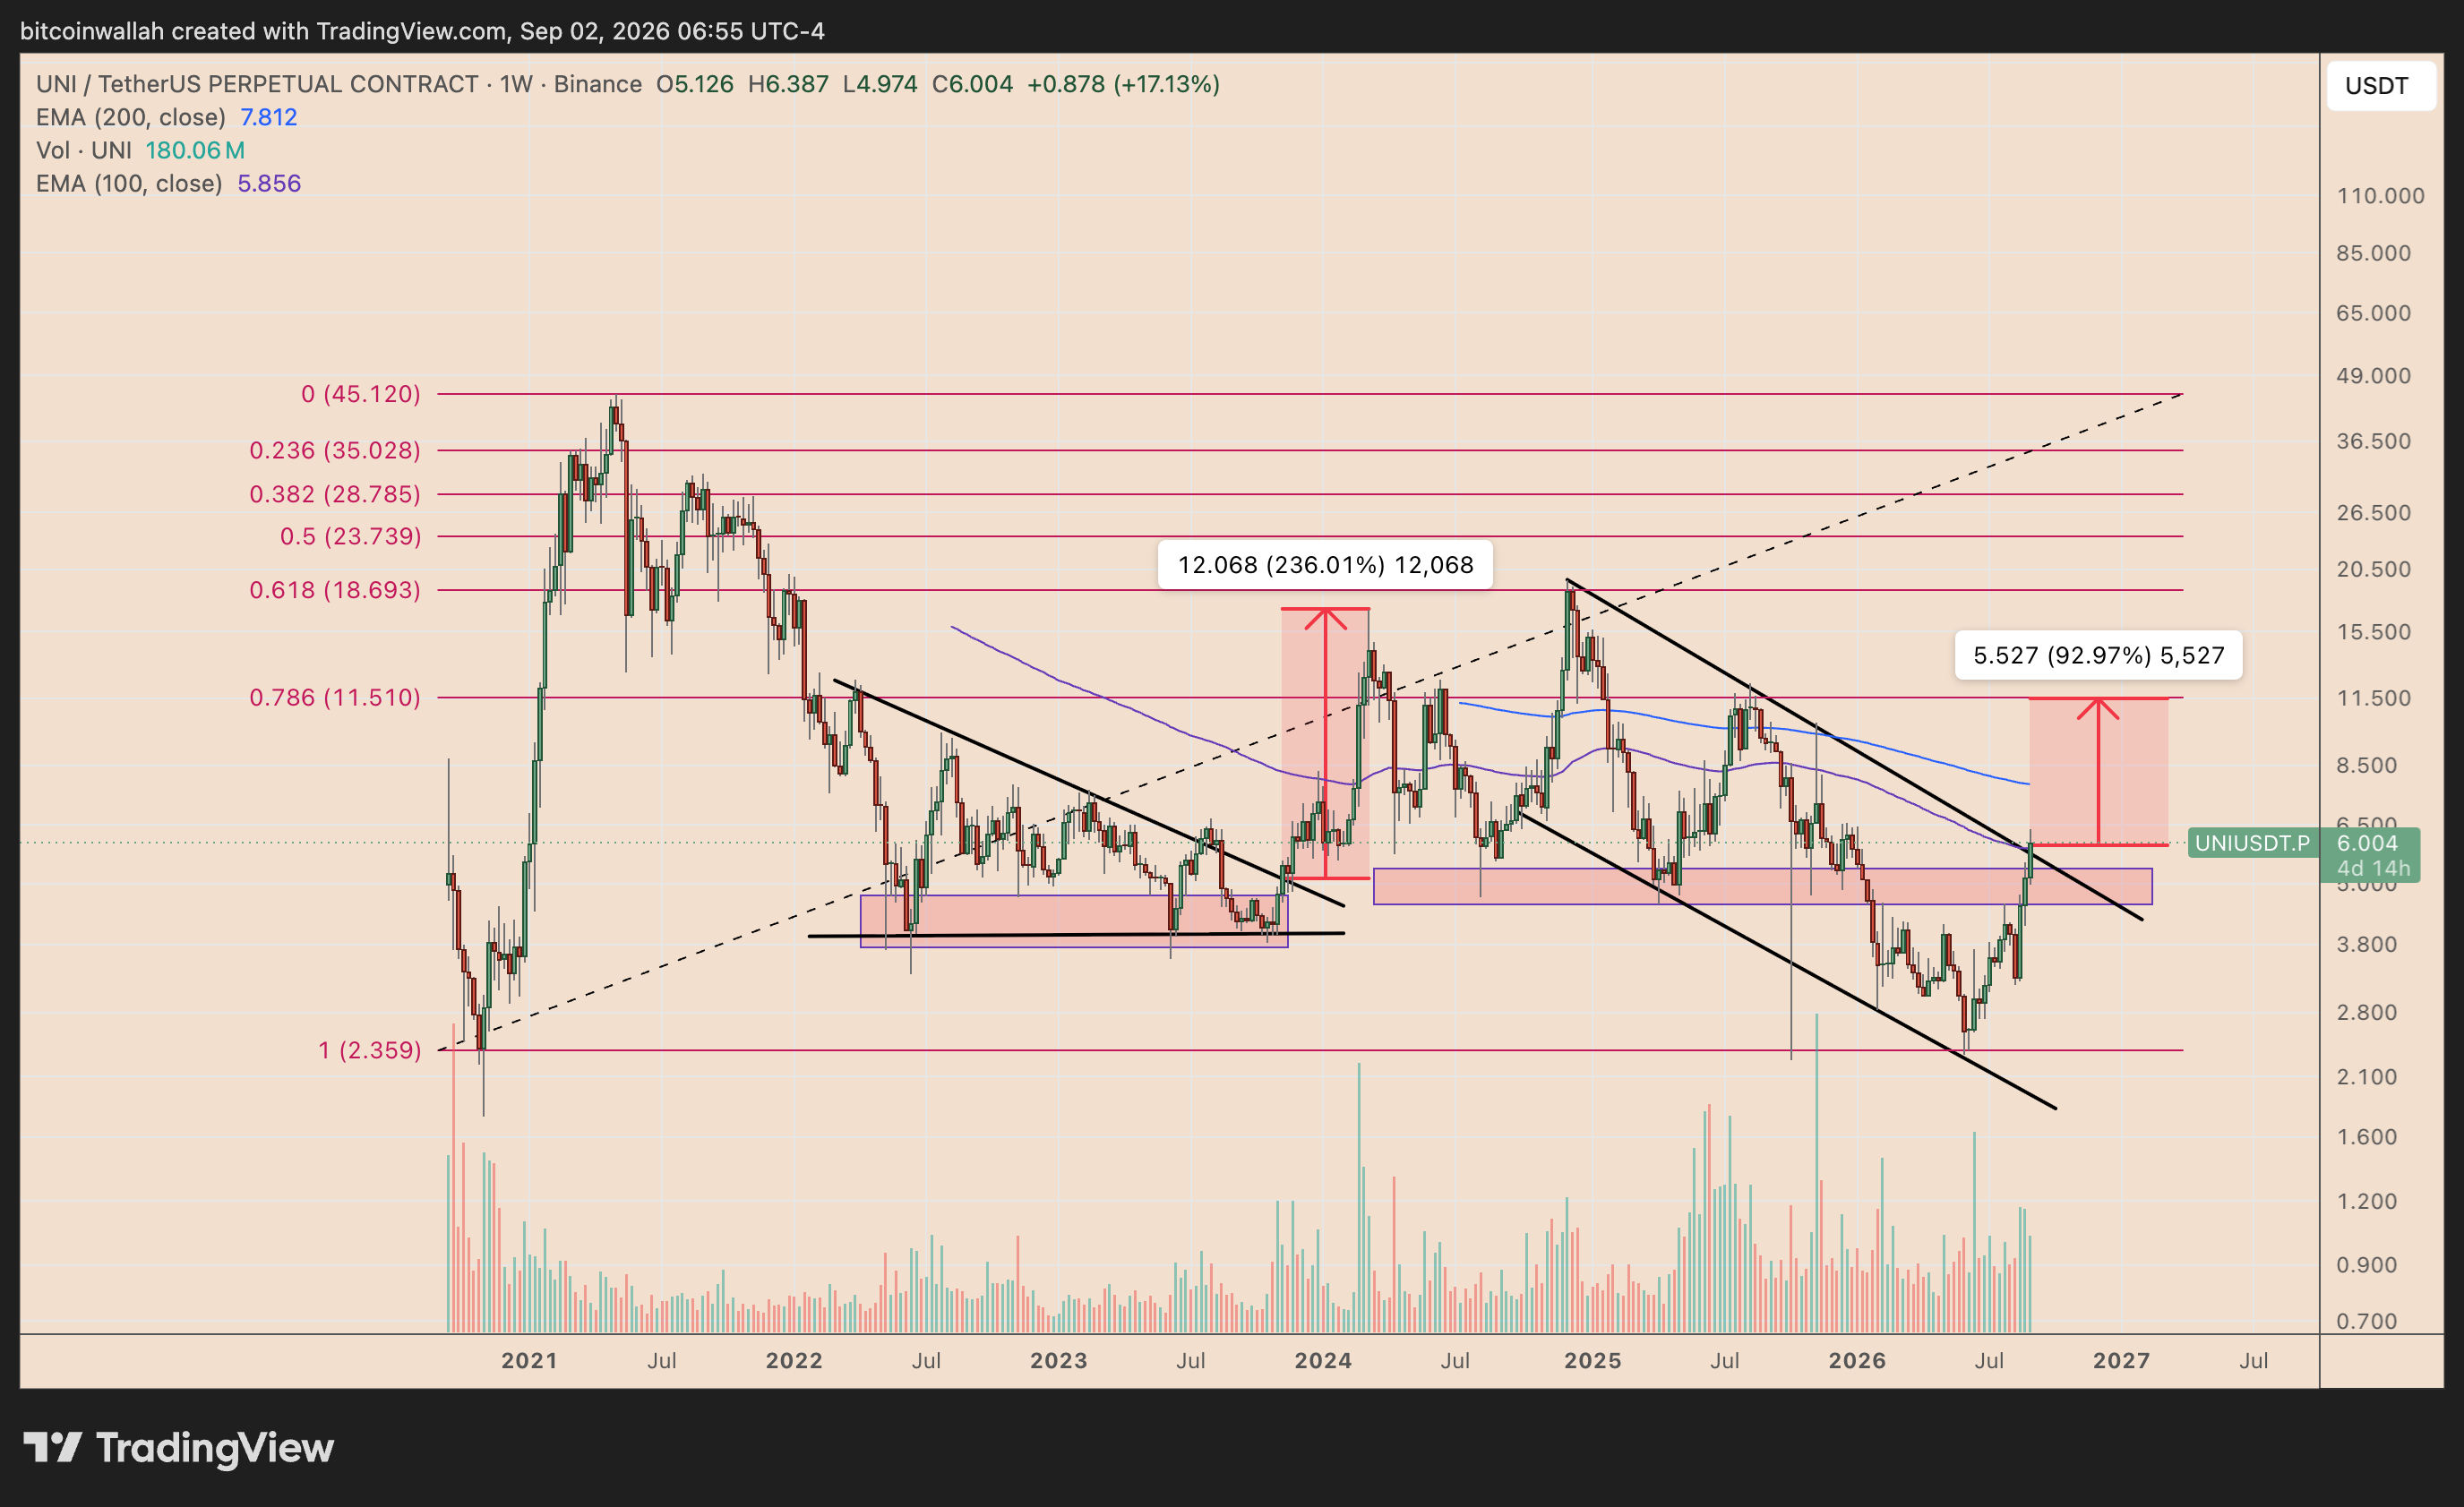
That zone mattered in 2023, when UNI repeatedly found buyers there while a descending trendline capped its upside. Once price broke above that trendline and held the red area as support, the token rallied roughly 236% toward the $17–$18 region.
The current setup is beginning to rhyme with that move.
UNI fell below the same support area during its 2026 decline and bottomed near $2.36. It has since reclaimed the red zone, climbed back above its descending resistance trendline, and is trading near $6, up roughly 17% this week.
The additional signal I’m watching is the 100-week exponential moving average (100-week EMA, purple) near $5.86. UNI is now trading above it after spending much of the recovery underneath.
Reclaiming the red support zone and moving back above the 100-week EMA is why I’m leaning bullish here.
$11.50 Is the Level I’m Watching
The next hurdle is UNI’s 200-week EMA near $7.81. I would want to see price clear that area before becoming more confident in a larger continuation move.
Above $7.81, the next level that matters to me is the 0.786 Fibonacci retracement near $11.51, which also overlaps with a former resistance area.
A move from around $6 to $11.50 would mean roughly 90–93% upside.
The call is also straightforward to invalidate.
A weekly close back below roughly $5 would tell me the breakout is losing strength. A sustained move below $4, putting UNI back beneath the red support zone, would take me off the bullish fractal entirely.