
Spot Gold Settled Higher but Could Not Get Through the 50-Day
Spot Gold finished Friday with a small gain after buyers showed up above $4,235 and pushed the market back toward the 50-day moving average at $4,317.56. They could not get through it. The 50% level at $4,319.61 sits right next to the average. Spot Gold tested the cluster and got rejected. The session ended between support and resistance with the weekly loss intact.
The 10-year Treasury yield settled near 5.16% after reaching its highest since June 2007 Thursday. The 30-year pushed to levels last seen in 2004. CME FedWatch had October rate-hike odds near 66% and December near 93%. The rate trade ran the week. Friday’s small bounce did not change that.
Spot Gold settled at $4,284.97, up $11.17 or +0.26%. It traded between $4,254.58 and $4,315.80.

The 10-Year at a 19-Year High Ran the Whole Week
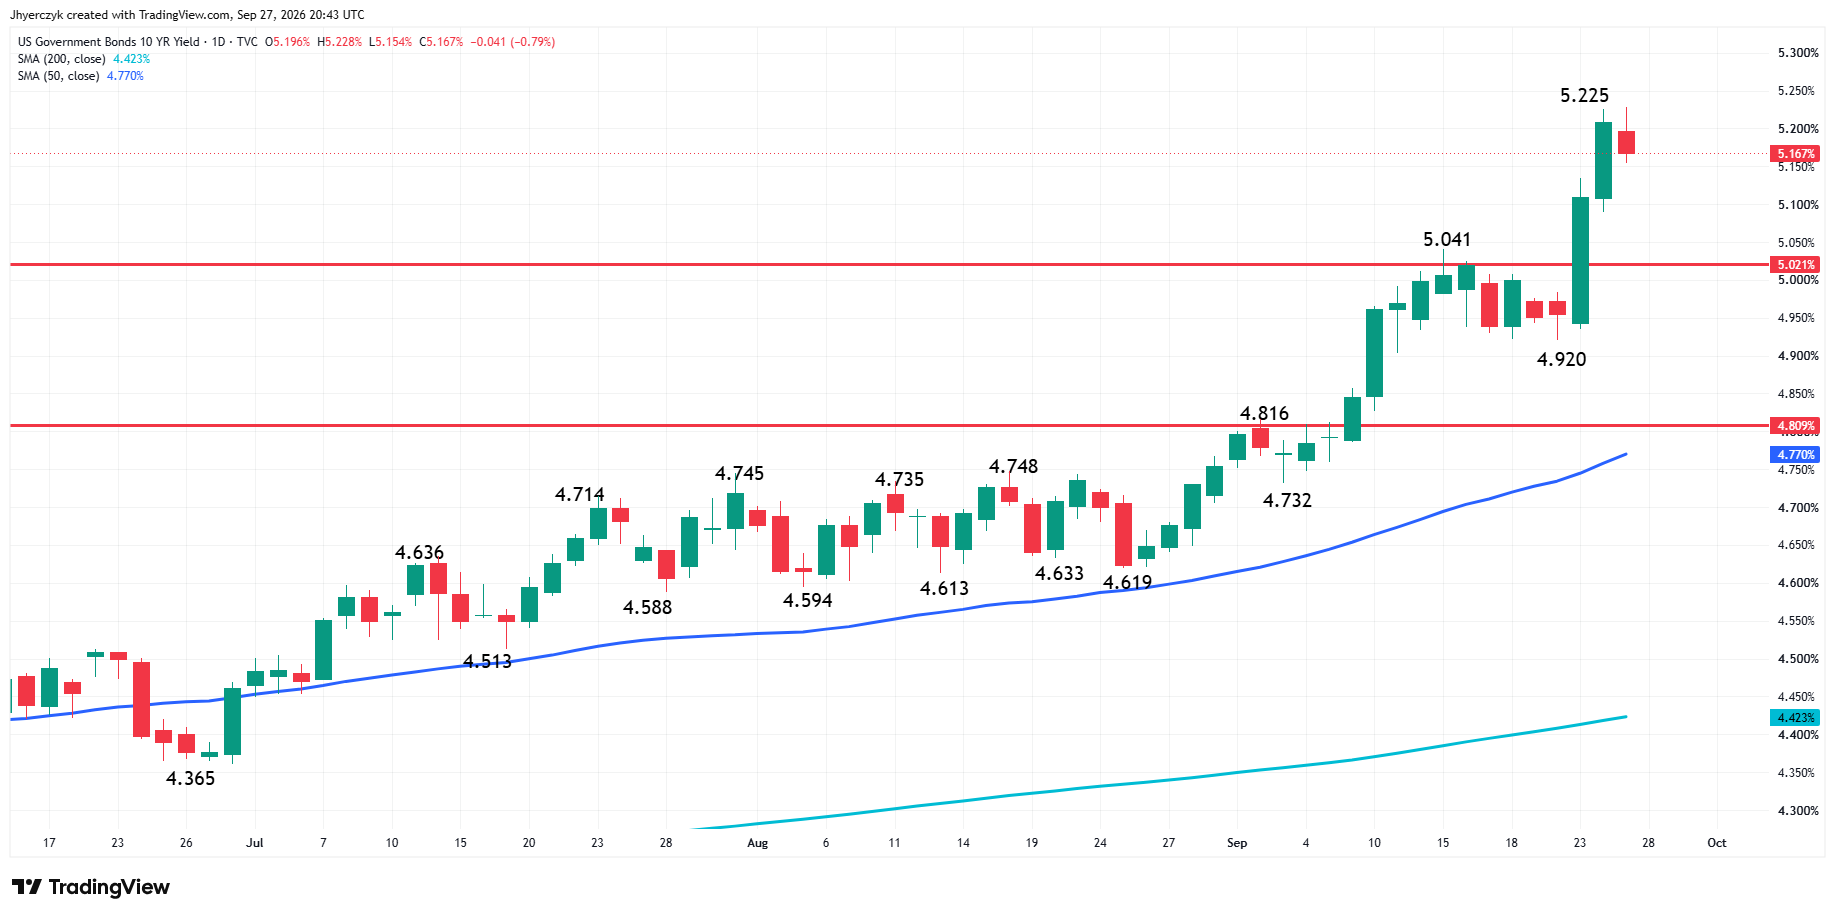
The 10-year Treasury yield hit its highest level since June 2007 before settling near 5.16% Friday. The 30-year reached levels not seen since 2004. The sell-off extended beyond U.S. Treasuries. Japanese government bonds, U.K. gilts, German bunds, and eurozone debt all sold off during the week.
Federal Reserve Governor Michael Barr said earlier in the week that further policy adjustments could be needed to bring inflation back to target. The strongest purchasing managers’ index reading in more than four years added to the case. The Fed raised 25 basis points last week, its first increase in three years. CME FedWatch had October at 66% and December at 93% by Friday. Spot Gold fought the rate market all week and lost ground every session except Friday.
The Dollar Slipped and Spot Gold Still Could Not Hold the Average
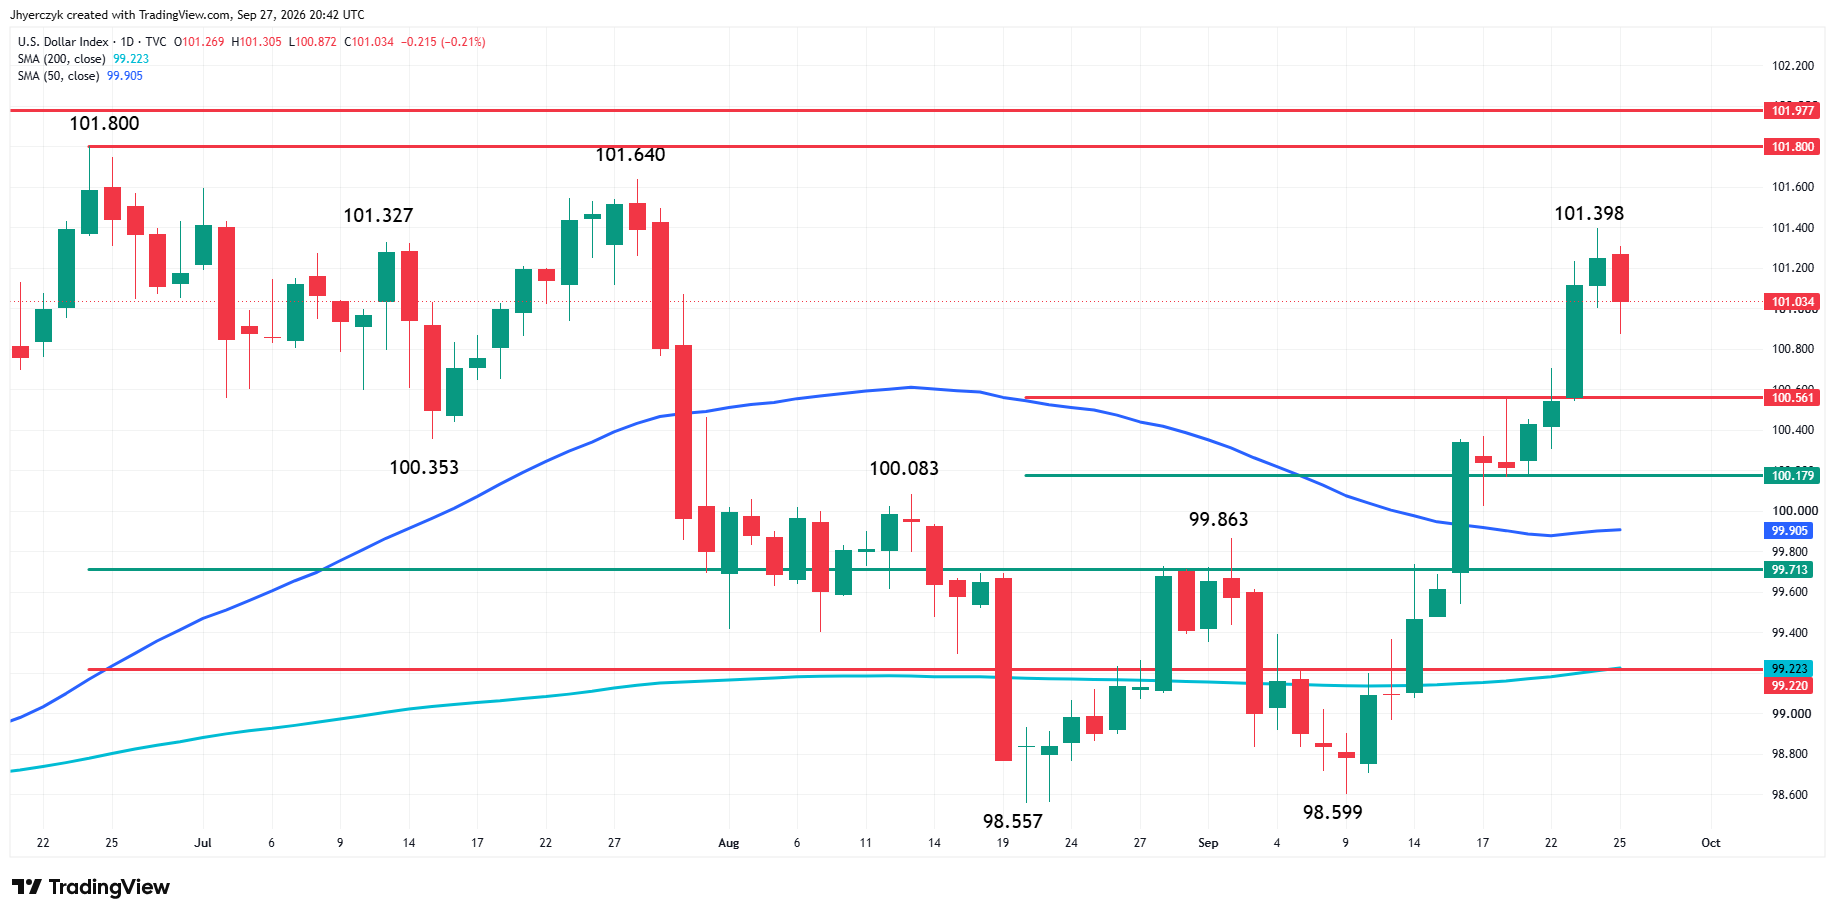
The U.S. Dollar Index pulled back Friday after testing above 101.30. The index remains above its 50-day and 200-day moving averages. The pullback gave Spot Gold a window. The metal pushed to $4,315.80 and stalled $2 below the 50-day.
Friday looked more like short covering after Spot Gold tested the lower end of its range than the start of new buying. Buyers showed up above $4,235. They could not hold the market above the $4,317.56 to $4,319.61 cluster. Until that area breaks, the rallies are selling opportunities and Friday confirmed it.
Gold Price Forecast
Every new Gold analysis as it publishes, today's technical signal and key levels, live price — on one page.
See all Gold forecastsThe Diplomacy Headlines Took Some of the War Bid Away
Reports that U.S. and Iranian negotiators were exploring a phased path out of the war gave crude sellers a reason to press Friday. The proposed framework would involve reopening the Strait of Hormuz while Washington lifts the economic blockade. Oil fell. Some of the safe-haven buying that had been supporting Spot Gold fell with it.
Iran said it would not show flexibility on its nuclear program even if the United States accepted the Hormuz proposal. The gap between the two sides is visible. The possibility of progress was enough to take the immediate fear premium down Friday. It was not enough to produce an agreement.
Spot Gold has fallen about 19% from its February 27 session high. The war premium kept some buyers in the market while yields climbed. Friday’s truce reports reduced that support. The rate trade was already leaning against Spot Gold. Losing part of the geopolitical bid on top of it left buyers with less to work with heading into next week.
Daily Spot Gold (XAUUSD) Technical Analysis
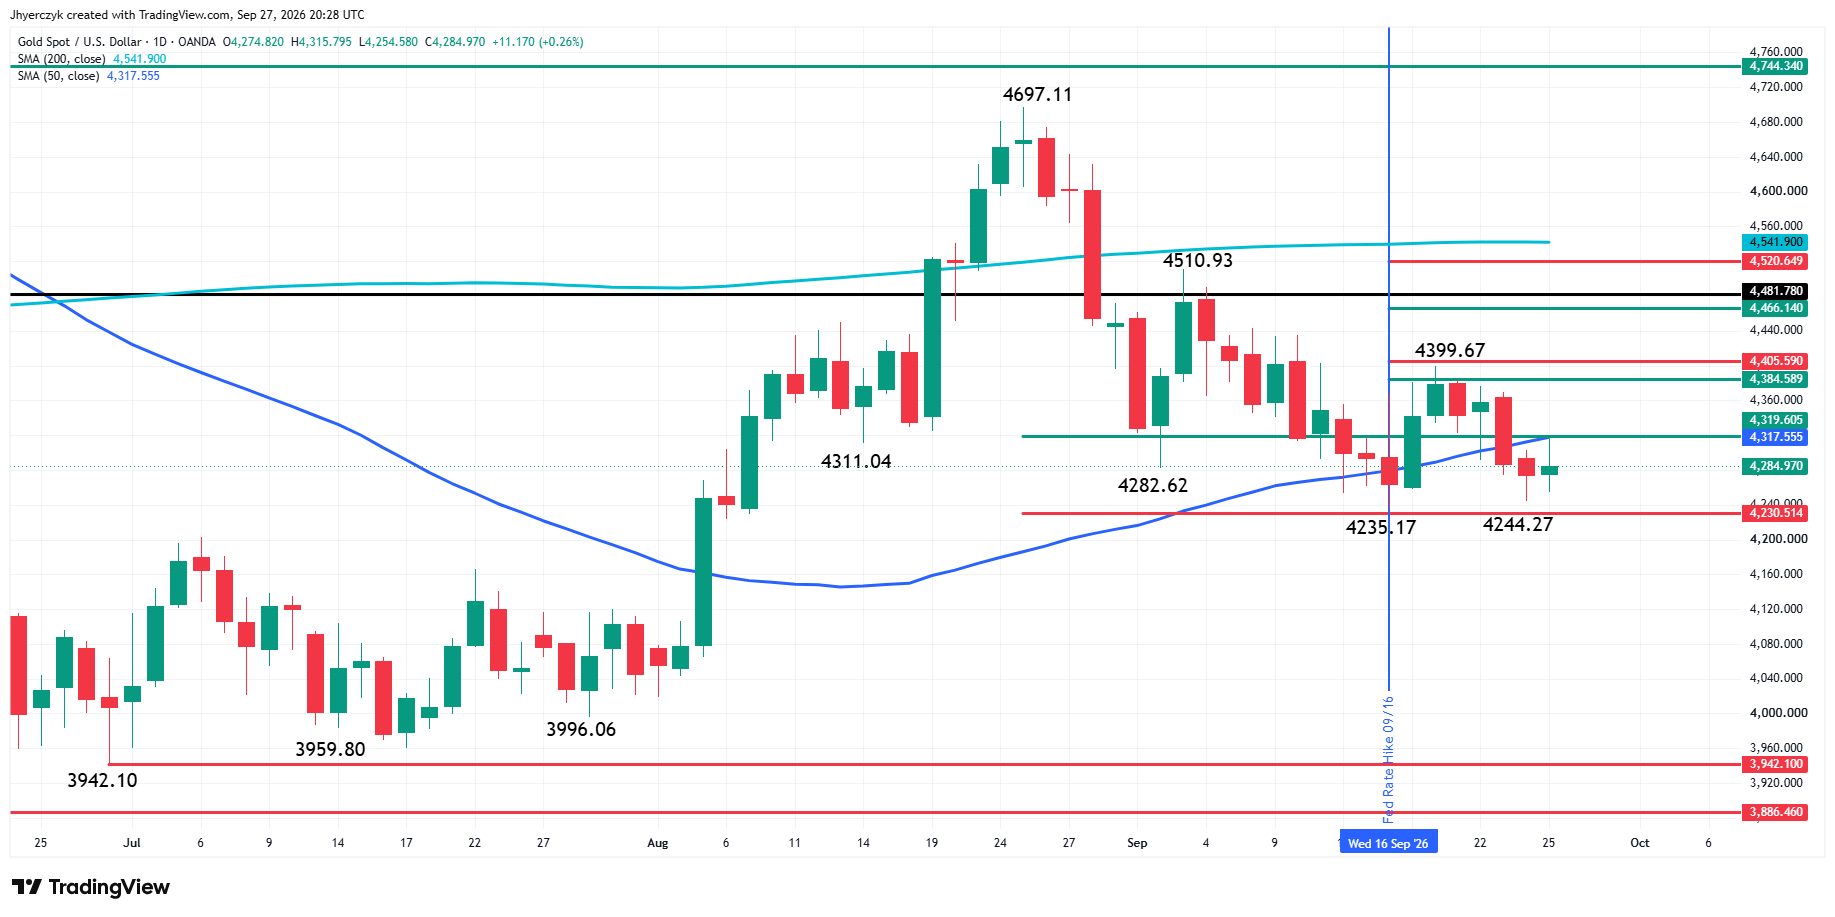
Spot gold settled slightly higher Friday despite being rejected by the 50-day moving average at $4,317.56 and a key 50% level at $4,319.61.
The main trend is down according to the daily swing chart. A trade through $4,399.67 will change the main trend to up. A move through $4,235.17 will signal a resumption of the downtrend.
The minor trend is also down. A trade through $4,244.27 will signal a resumption of the downtrend.
The long-term range is $3,942.10 to $4,697.11. Its retracement zone is $4,319.61 to $4,230.51. Gold has been testing this zone for support since September 2, including posting a pair of main bottoms at $4,282.62 and $4,235.17, and the minor bottom at $4,244.27.
Retracement zone resistance is $4,384.59 to $4,405.59. The September main top at $4,399.67 fell inside this zone.
The main trend is controlling my downside bias with the close under the 50-day MA at $4,317.56 steering momentum. Overcoming the 50-day MA will weaken my outlook and could lead to a bullish shift in momentum that could lead to a near-term test of the main top at $4,399.67 and possibly a change in trend to up.
The price I am eyeing on the downside is the 61.8% level at $4,230.51. This could be major support or a potential trigger point for an acceleration to the downside.
What to Watch
The 50-day at $4,317.56 and the 50% level at $4,319.61 rejected Spot Gold on Friday. The rate trade kept the metal below that cluster all week. October hike odds at 66% and December at 93% are not giving buyers room. The 10-year near 5.16% after reaching a 19-year high Thursday is the number Spot Gold has to trade against heading into next week.
The diplomacy story took some of the war bid away Friday. Iran’s nuclear position keeps the talks from becoming a clean resolution. The safe-haven support is thinner than it was Monday. The rate pressure is not.
The $4,244.27 minor bottom and the $4,235.17 main bottom are the downside levels. The 61.8% at $4,230.51 is sitting below both. That area has held since early September. A break through it changes the trade. Above, buyers have to clear the 50-day cluster before the $4,384.59 to $4,405.59 resistance zone and the $4,399.67 main top come back into play. Friday’s bounce stopped $2 short of the average. That tells you where the sellers are sitting.
If you’d like to know more about how to trade gold, please visit our educational area.