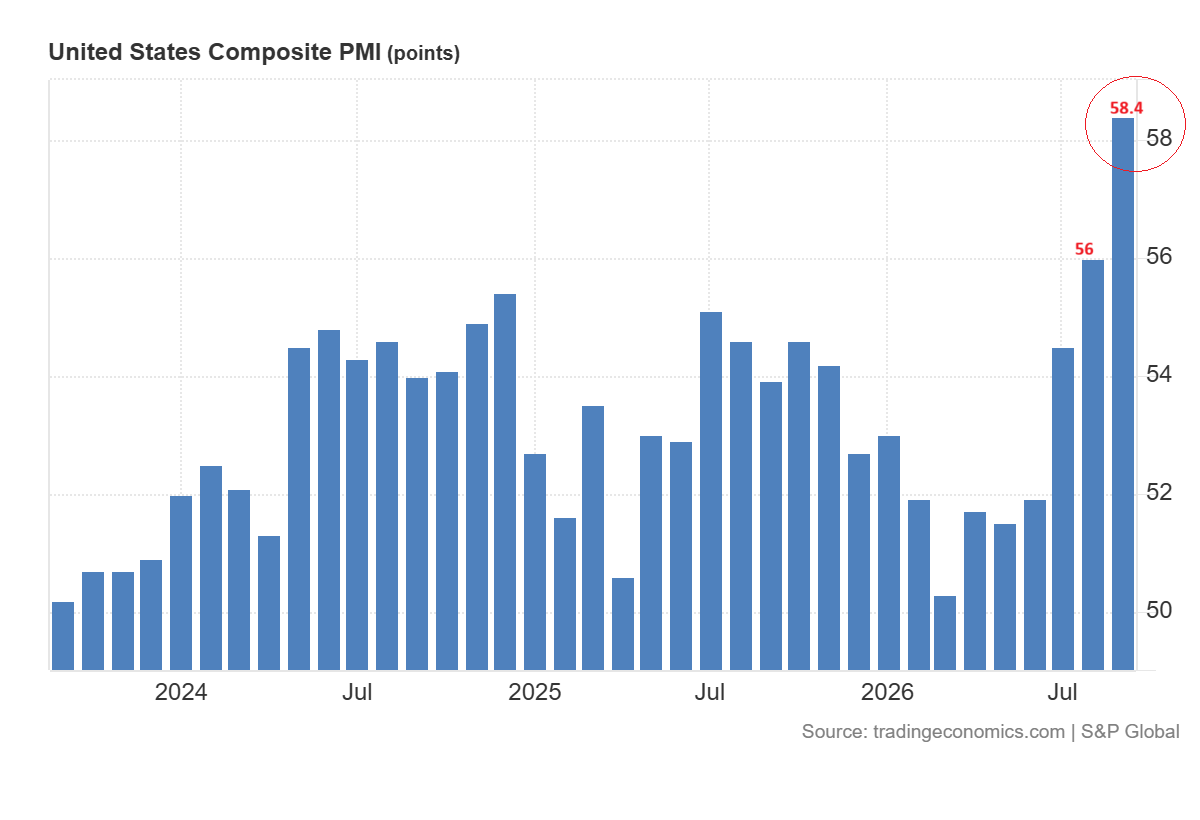
The strong business activity in the US has kept another rate hike by the Fed in focus. The September flash composite PMI increased to 58.4 and the 10-year Treasury yield surged above 5%. The Fed can wait for more inflation data, but rising costs may make another hike harder to rule out. The August PCE report on September 30 could be the next key test. This article presents the growth and inflation signals behind the interest rate outlook and explains how the next move by the Fed could affect the US dollar, USD/JPY and EUR/USD.

Fed Rate Outlook: Strong Growth and Inflation Keep Another Hike in Play
Strong US Growth Puts 5% Treasury Yields in Focus
The S&P Global US flash composite PMI increased to 58.4 in September from 56.0 in August. It was the strongest reading since July 2021. The companies also reported faster hiring and a sharp increase in the cost of inputs.
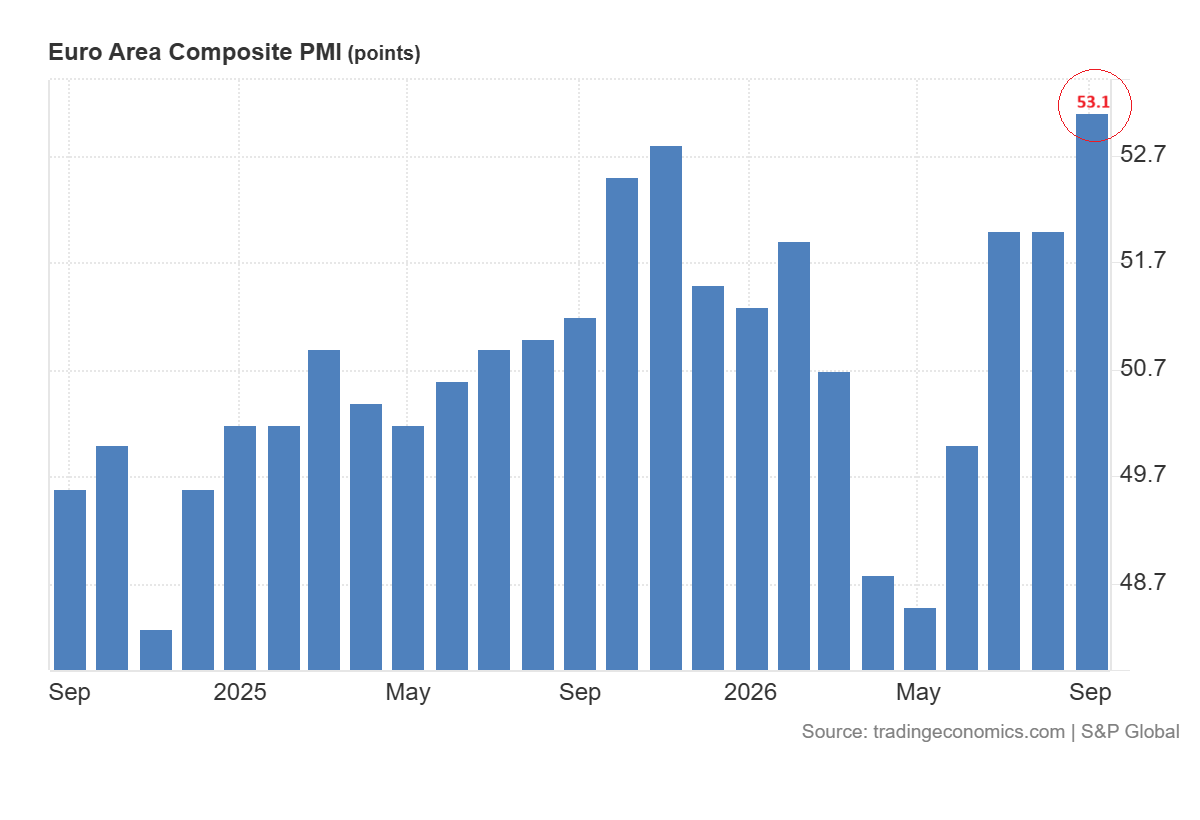
The eurozone composite PMI climbed to 53.1 from 52.0, which shows stronger activity there too.
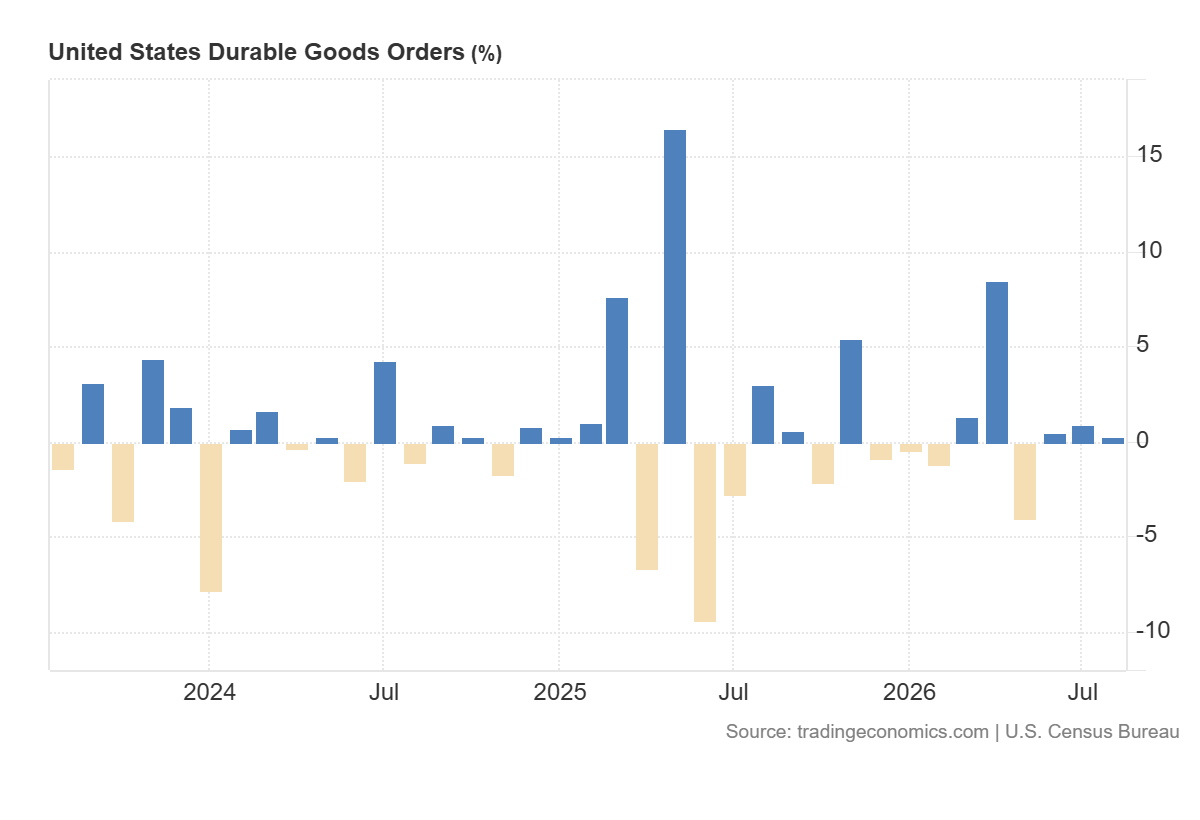
But the US report on Friday showed that the durable goods orders in August were virtually unchanged. The Fed has strong survey data to weigh against the less convincing factory orders report.
The Fed’s September projections put the median policy rate at 4.1% at year-end. That points to one more quarter-point increase if the outlook holds. On Friday, the two-year Treasury yield stood at 4.81% and the 10-year yield at 5.17%.
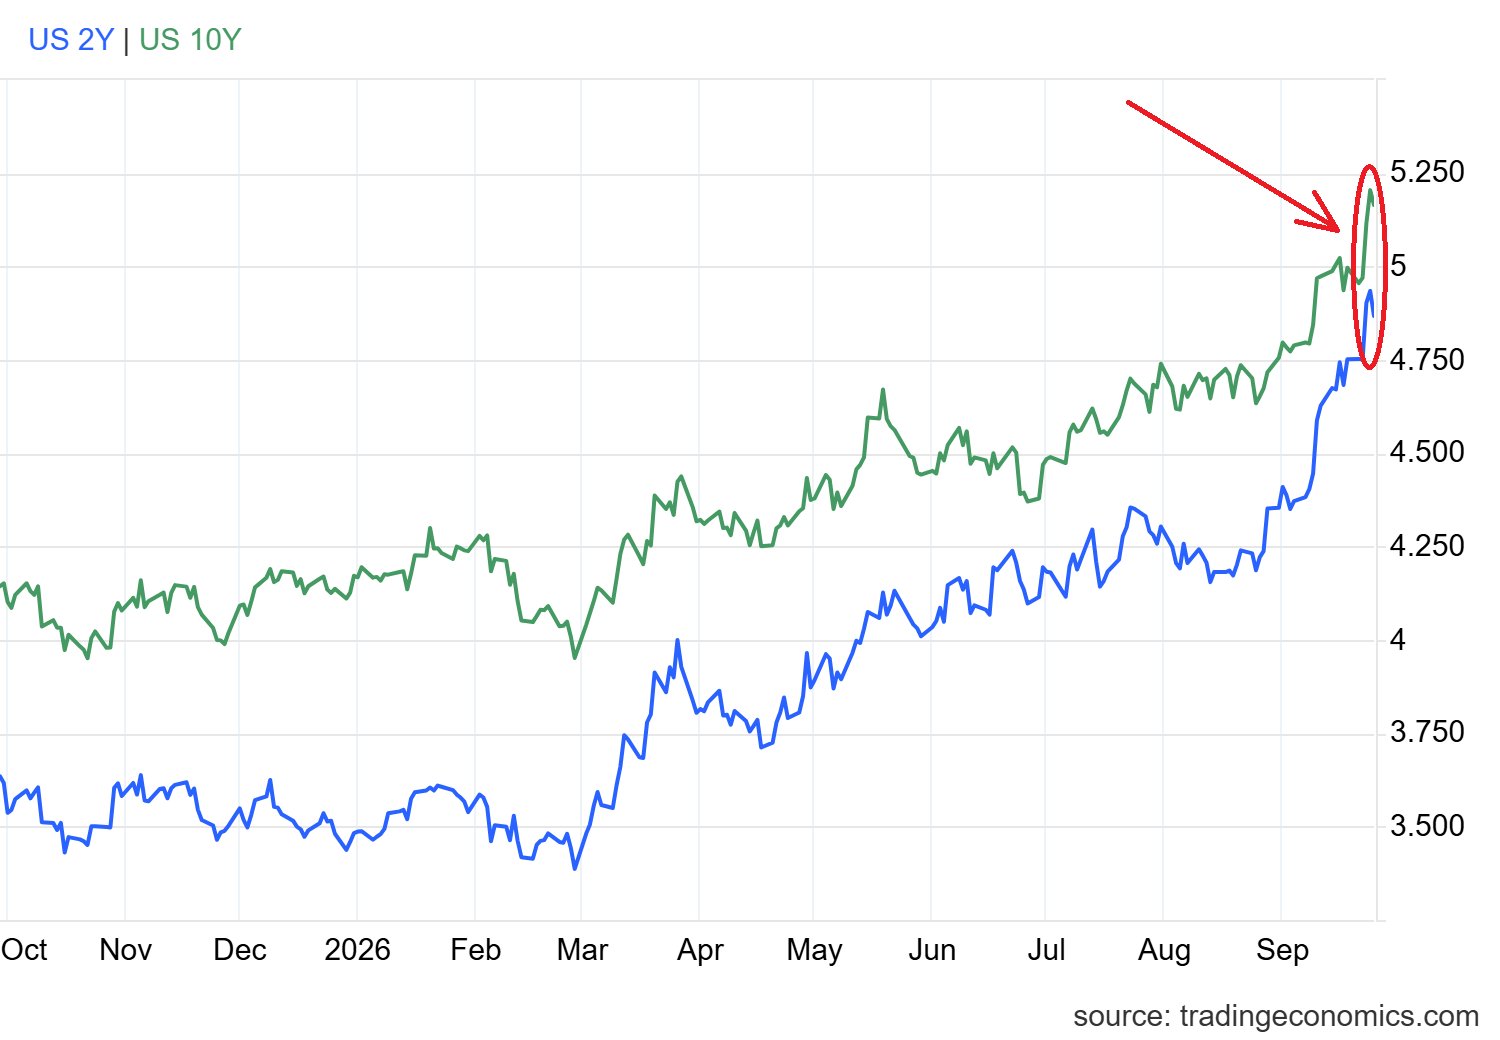
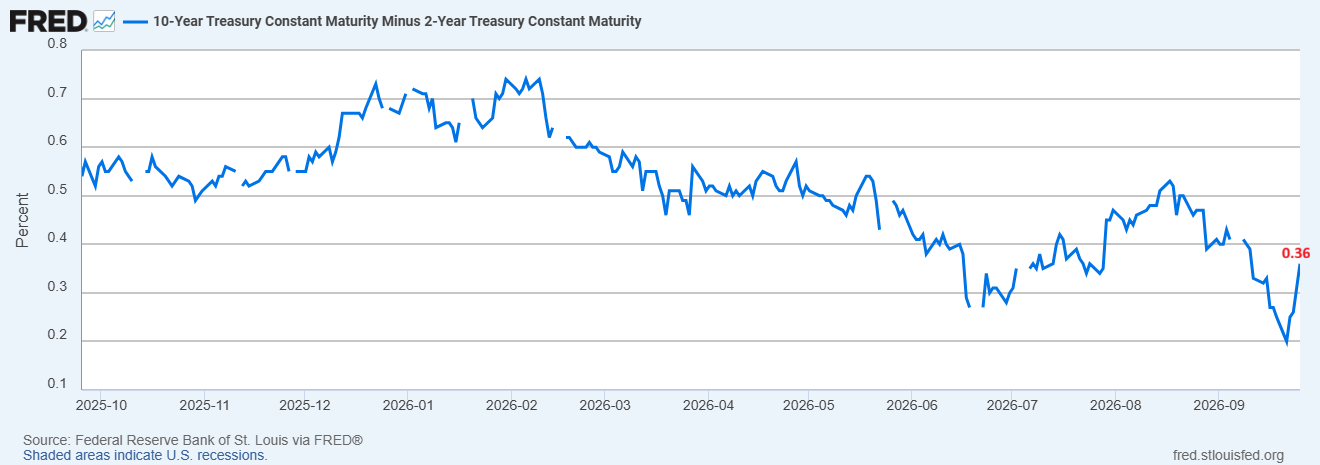
The gap between them widened to 0.3 percentage points during the week. This has steepened the curve even as both yields reflect concern about inflation and the cost of borrowing.
The current growth gives the Fed room to wait for more inflation data. The chart below shows that the Atlanta Fed’s GDPNow model estimates 5.0% annualized real growth for Q3, which is up from 1.5% growth recorded in Q2.
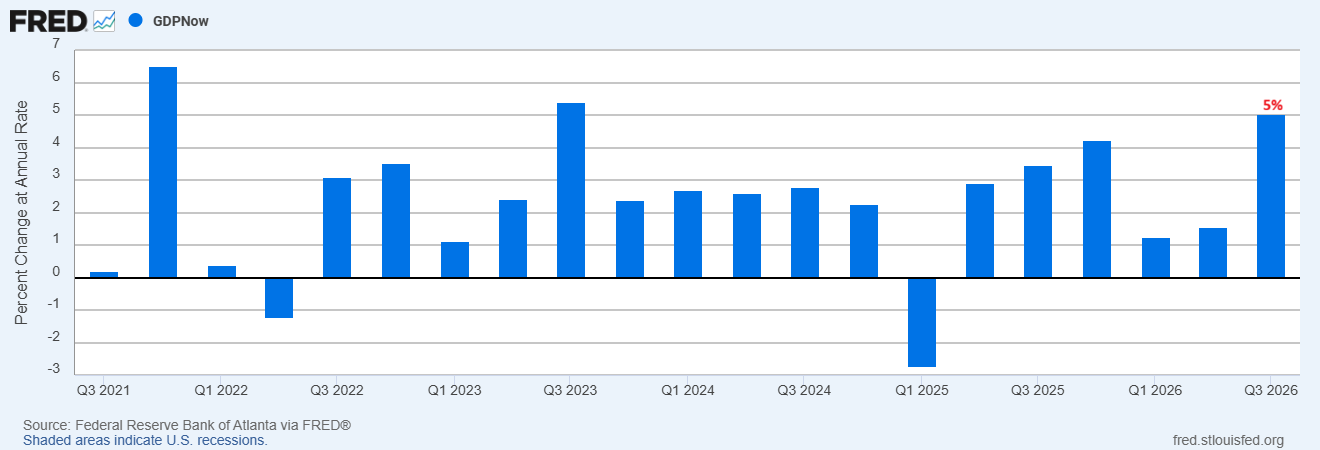
The current-dollar GDP grew at an 8.0% annualized rate in Q2. If real growth stays near the GDPNow estimate and price growth remains strong, the nominal growth could move into double digits. In my view, if the 10-year yields hold above 5%, it could increase the risk of another rally to 6%.
EUR/USD Price Forecast
Every new EUR/USD analysis as it publishes, today's technical signal and key levels, live price — on one page.
See all EUR/USD forecastsAugust PCE Will Test the Case for Another Fed Hike
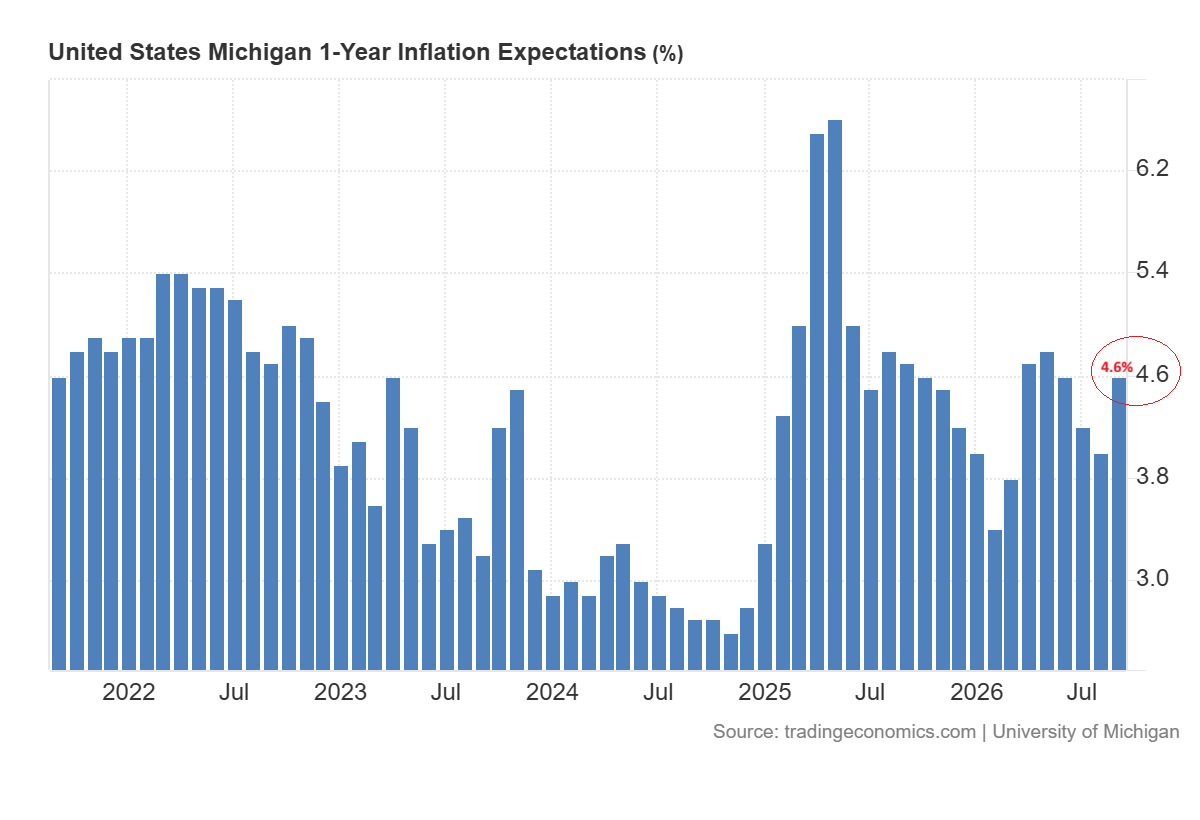
The PCE inflation was 3.7% in July, while core PCE inflation was 3.3%. The final survey of September on Friday showed that the households raised their one-year inflation expectations to 4.6%. Brent oil was also trading near $104 a barrel on Friday.
The higher interest rates add pressure to federal finances. The gross debt exceeded $40 trillion in September and federal interest payments ran at about $1.25 trillion at the annualized rate in Q2. The August PCE release on September 30 is the next key test before the next meeting by the Fed on October 27-28.
US Dollar Index Faces a PCE Test Near 101.80
The higher US interest rates support the dollar as they improve the return on dollar assets. But the relationship is not automatic. The US dollar index eased to about 100.87 on Friday, despite strong gains in 10-year US Treasury yields above 5%.
A firm August PCE reading could revive expectations of another hike by the Fed and support the US dollar. But a softer reading would weaken that case, particularly as other central banks have also raised rates.
The daily chart for the US dollar index shows that the index has reached the upper boundary of the recent consolidation zone between 96.50 and 101.80. The index has crossed above 100.50, but it now needs to break above 101.80 to open the way for further upside.
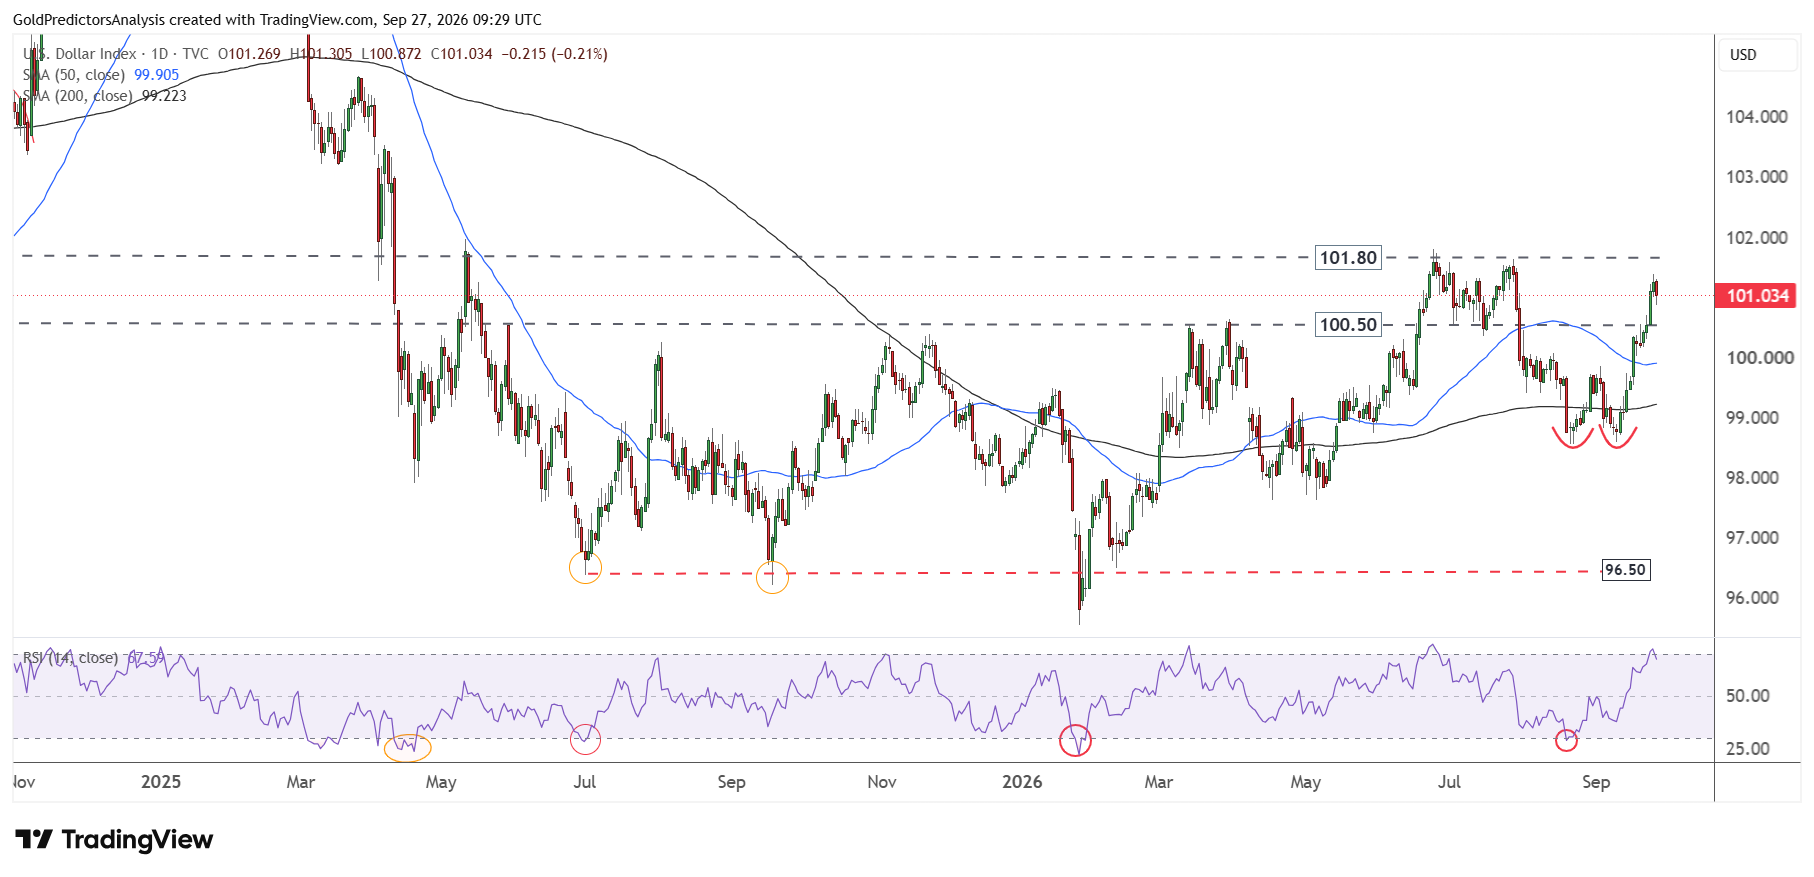
The formation of a double bottom pattern above 98.60 suggests positive momentum. The index remains well above the 50- and 200-day SMAs, which suggests a positive move. A break above 101.80 will open the way for strong rally toward 104.60.
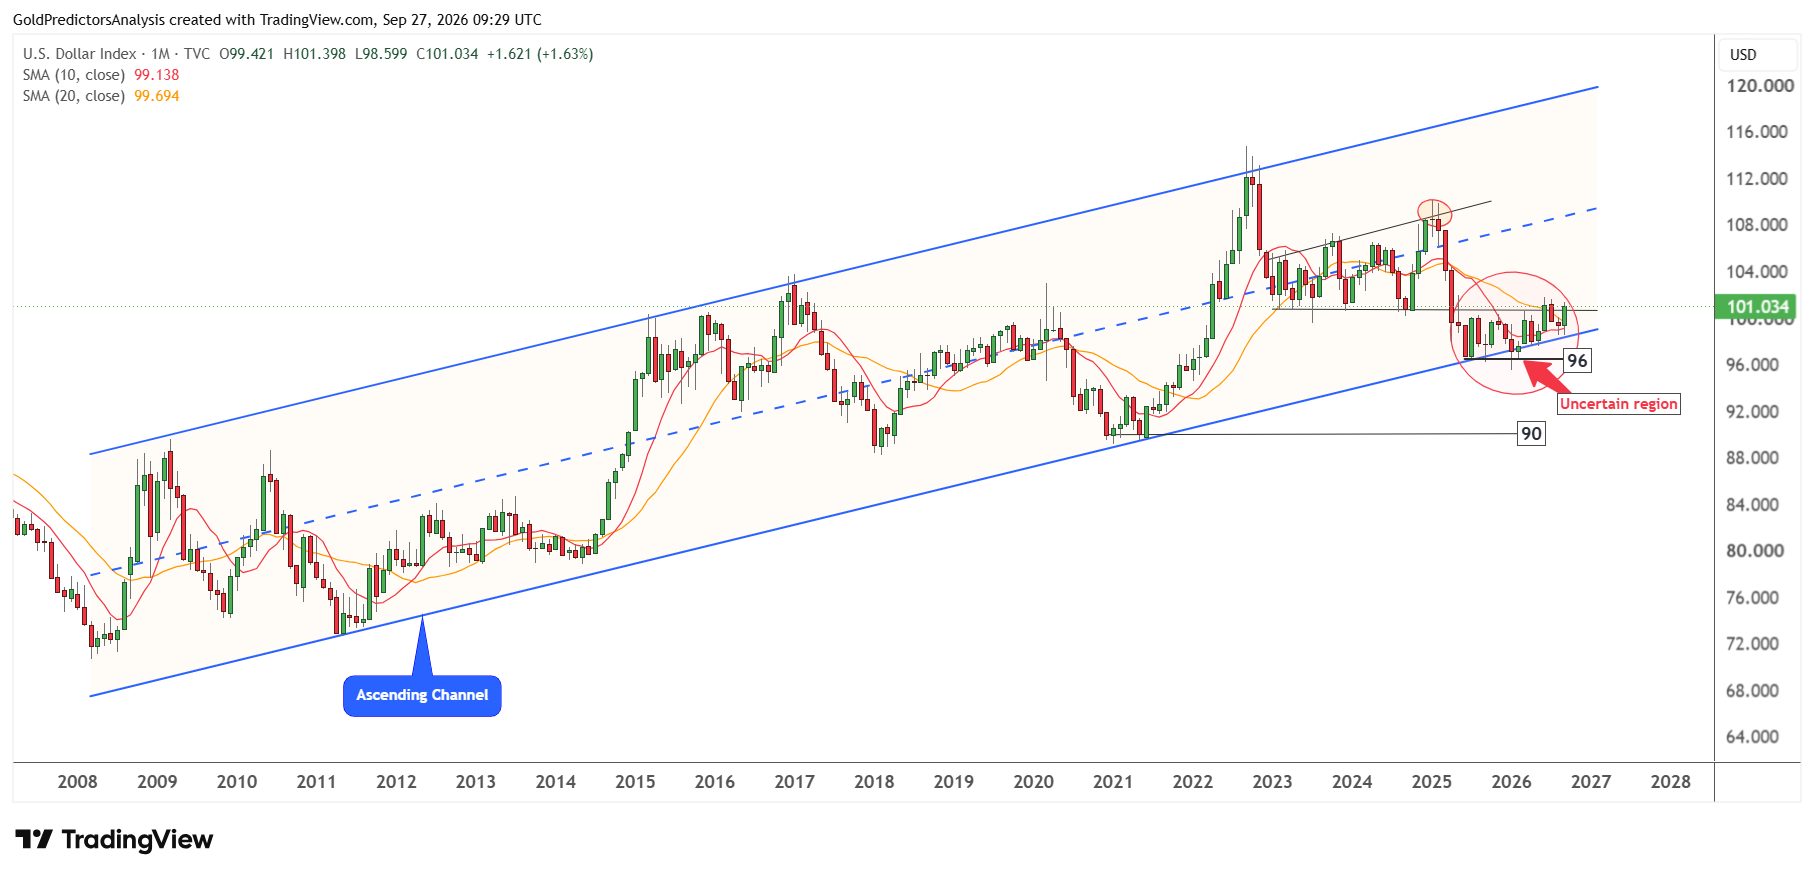
The recent consolidation in the US dollar index is also evident on the monthly chart, which shows that the index has been consolidating within an ascending channel. This suggests a positive outlook. The index has gained 1.63% in September so far and appears set to break above 101.80.
However, the 10-month moving average remains below the 20-month moving average, which highlights uncertainty in the dollar index. If the index breaks below the 96 level, it will likely open the way for a strong drop towards the 90 level.
USD/JPY: Fed–BOJ Rate Gap Keeps 160–162 in Focus
The Bank of Japan raised the policy rate to about 1.25% in September and said that further increases depend on economic and inflation data. Interest rates for the US remain much higher compared to the interest rates in Japan.
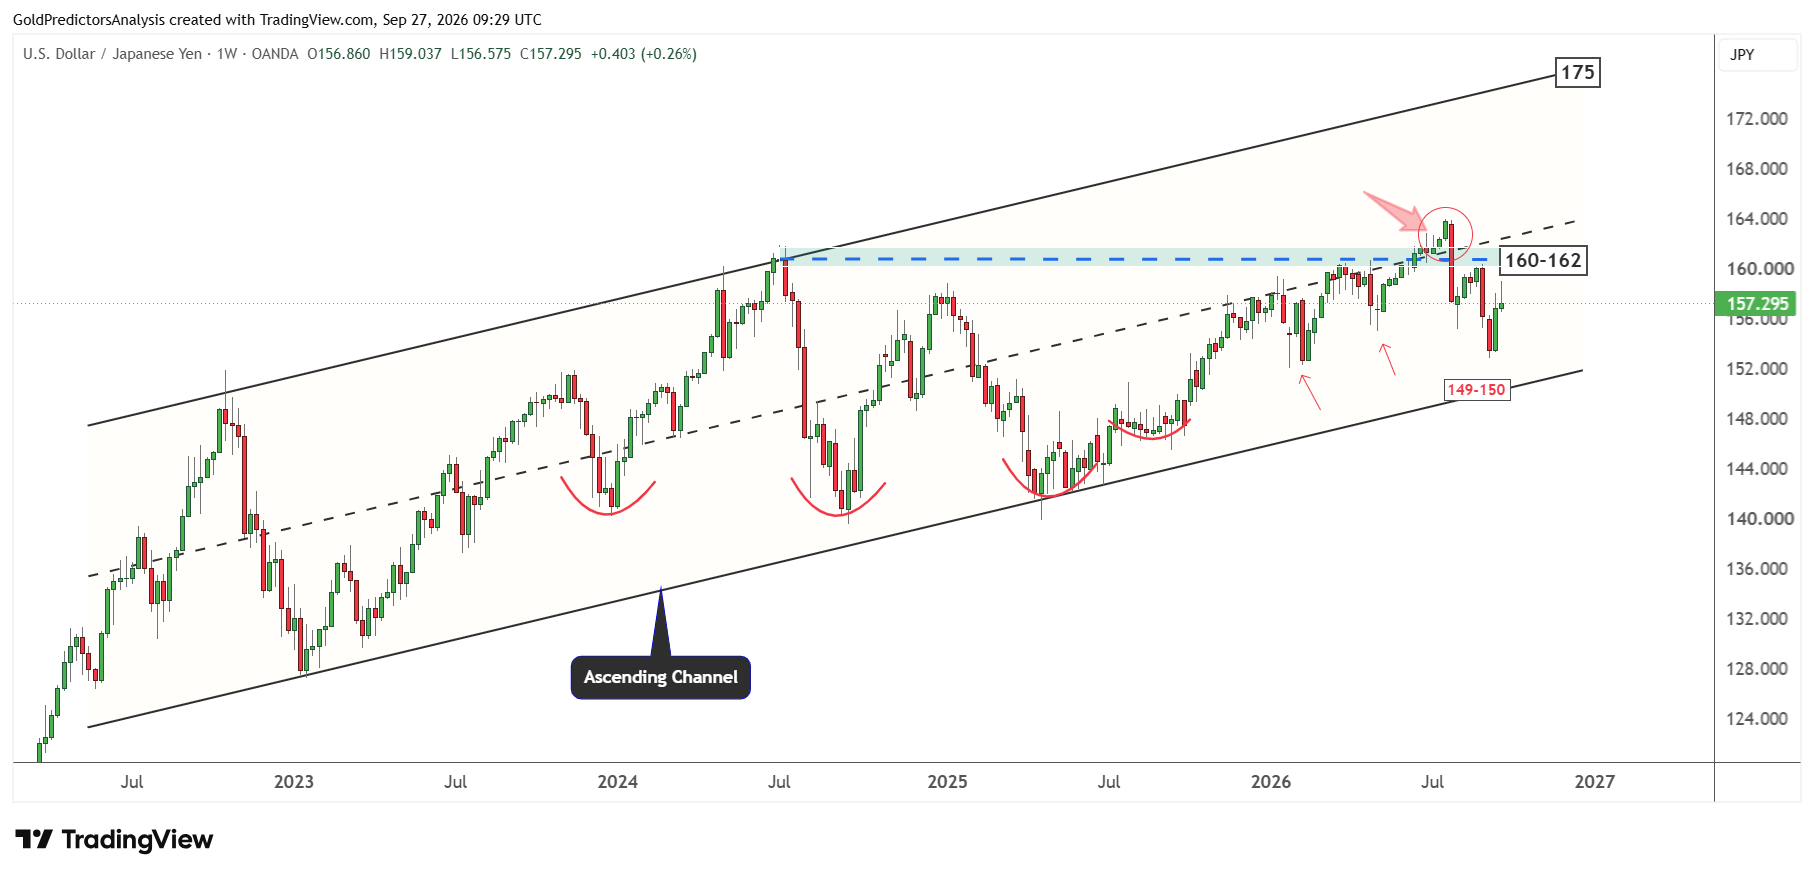
This difference continues to support US dollar against the yen. USD/JPY traded near 157.29 on Friday as the yen received strength. Another strong US inflation reading could lift the pair through the expectations of higher US rates. A clear sign of another hike by the BOJ could pull it lower.
From a technical perspective, USDJPY has been trading within the ascending channel pattern since the lows in January 2023. The pair has formed strong positive structure within the ascending channel pattern and looks to break higher. A break above the 160-162 level will likely open the way for a rally toward the 175 level. This target is defined by the resistance of the ascending channel pattern.
EUR/USD Nears 1.1330 Support Ahead of US PCE
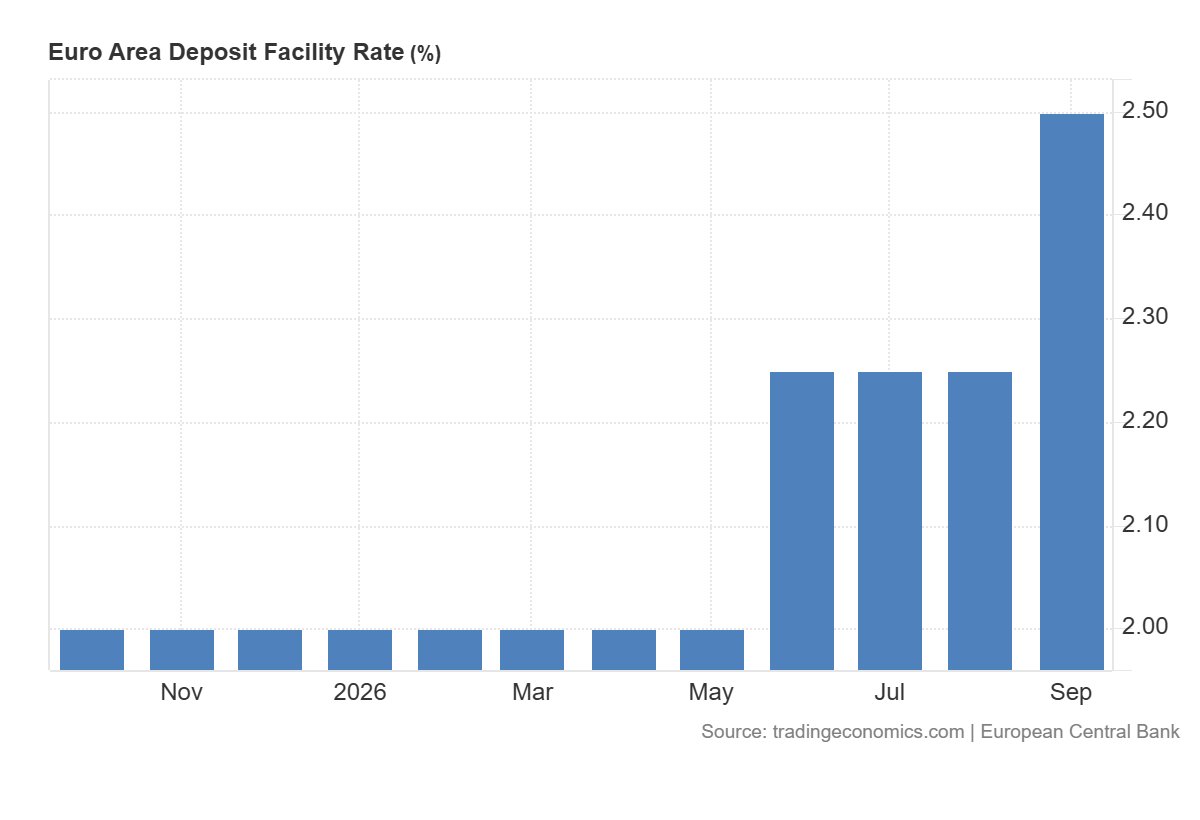
The ECB also raised the interest rates in September and pushed the deposit rate to 2.50%.
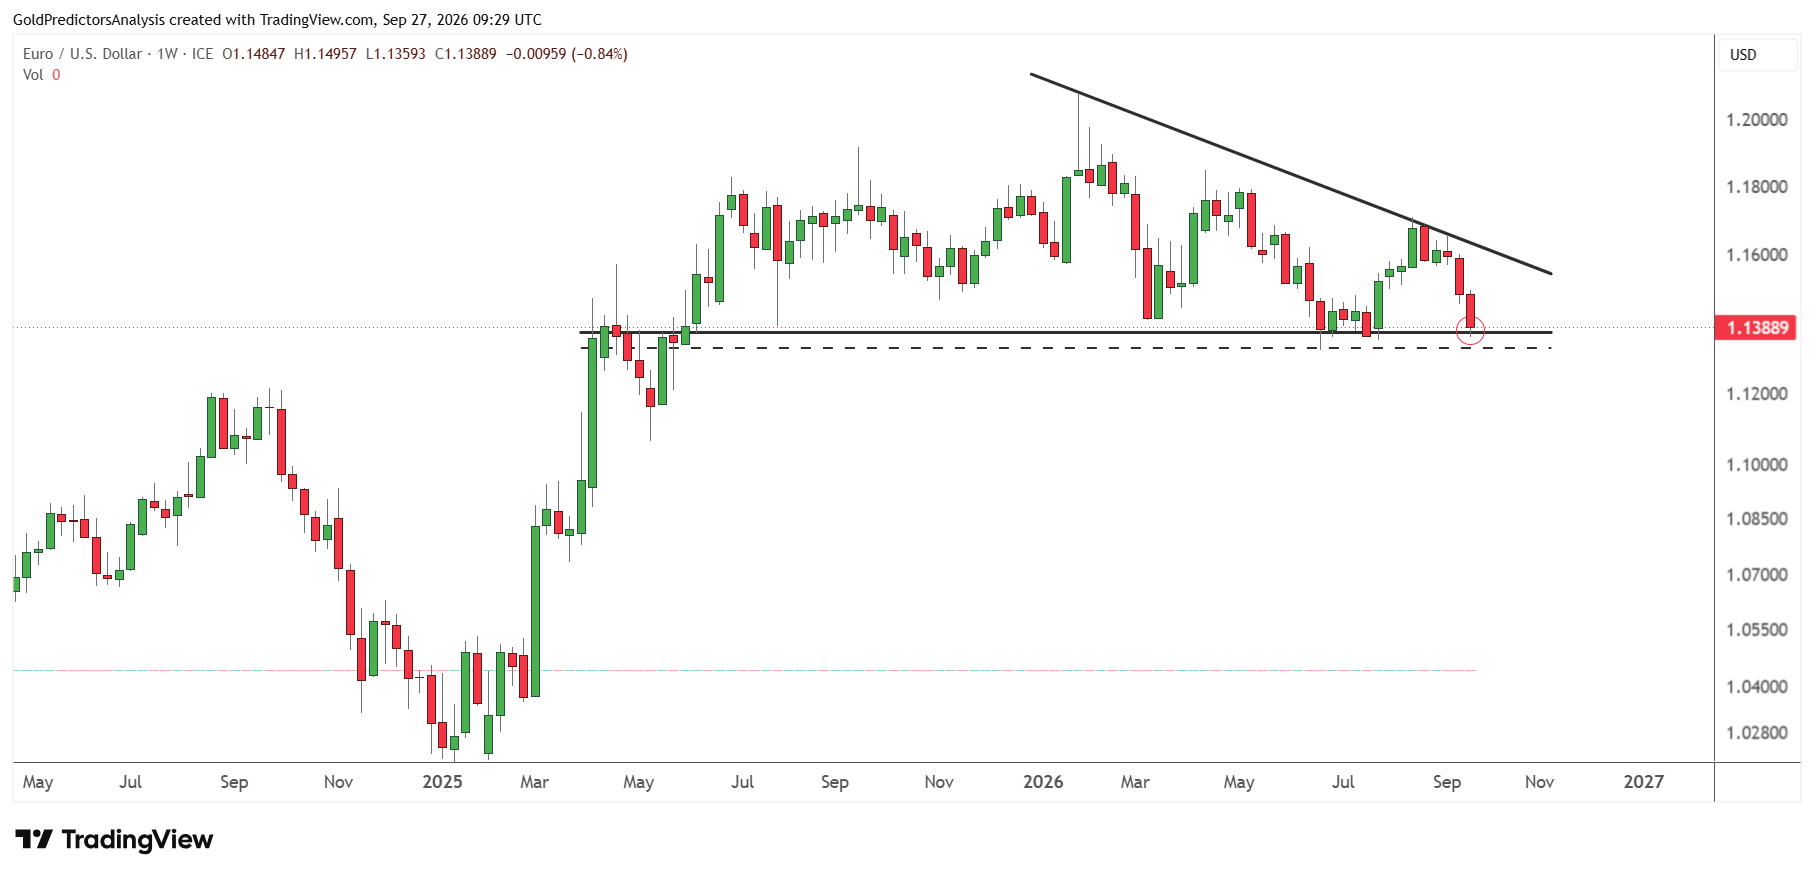
EUR/USD traded near 1.139 on Friday. A stronger US PCE report would favour the dollar if investors expect the Fed to tighten faster than the ECB. The euro could recover if US inflation cools or eurozone data strengthen the case for another hike by the ECB. The September increase in eurozone business activity makes that second outcome worth watching.
The strong rally in the US dollar index in September has pushed EUR/USD towards the key support zone between 1.1370 and 1.1330. A break below 1.1330 will likely trigger a strong drop in EUR/USD towards 1.11. On the other hand, a break above 1.17 is required to break the triangle pattern and open the way for a rally towards the 1.19 level.
What to Watch Next
The strong growth in the US and persistent inflation keep another hike by the Fed in focus. The Fed can wait for the August PCE report before making the next move at the October meeting. A strong reading would strengthen the case for higher rates and could keep Treasury yields elevated. But the softer inflation would give the Fed more reason to hold rates steady.
The US dollar needs to break above 101.80 to extend the rally. That move could help USD/JPY test 160-162 and put more pressure on EUR/USD near 1.1330. If US inflation cools, the US dollar could lose support despite the strong growth. The PCE report and the reaction in Treasury yields will set the tone for both pairs.
Read more: Fed Hike Expectations Support US Dollar