
The Nasdaq 100 has broken above 30,600 after a strong week for AI stocks, bringing 35,000 into focus. The tariff truce between the U.S. and China gives technology companies more time to plan, but the main trade disputes remain unsettled. The financial conditions remain loose, although bank reserves fell and bond volatility rose last week. In my view, the breakout can take the index higher if it holds above 30,000. This article presents the developments in trade, signals from liquidity and technical levels that could shape the next move in Nasdaq 100.

Trump Tariffs: US-China Truce Leaves AI Supply Risks Unresolved
Treasury Secretary Scott Bessent said that the U.S. and China would extend their trade truce until January 10, 2027. It had been set to end in November. The extra time helps technology companies to plan orders from overseas without facing immediate increase in tariffs. Tariffs that are already in place will remain unchanged.
President Trump met Chinese President Xi Jinping the next day. But they did not reach a lasting deal on tariffs, rare earths and technology restrictions. These issues are important to the Nasdaq index as AI firms need chips, equipment and materials from around the world. The new restrictions could make those supplies more expensive or difficult to get.
U.S. Trade Representative Jamieson Greer said that more details would come on Monday, September 28. Investors will be watching for any changes to tariffs and technology trade rules. The gains in the Nasdaq index on Friday came mainly from AI shares. Microsoft gained 3.7% on Friday while the Philadelphia semiconductor index gained 6.27% for the week.
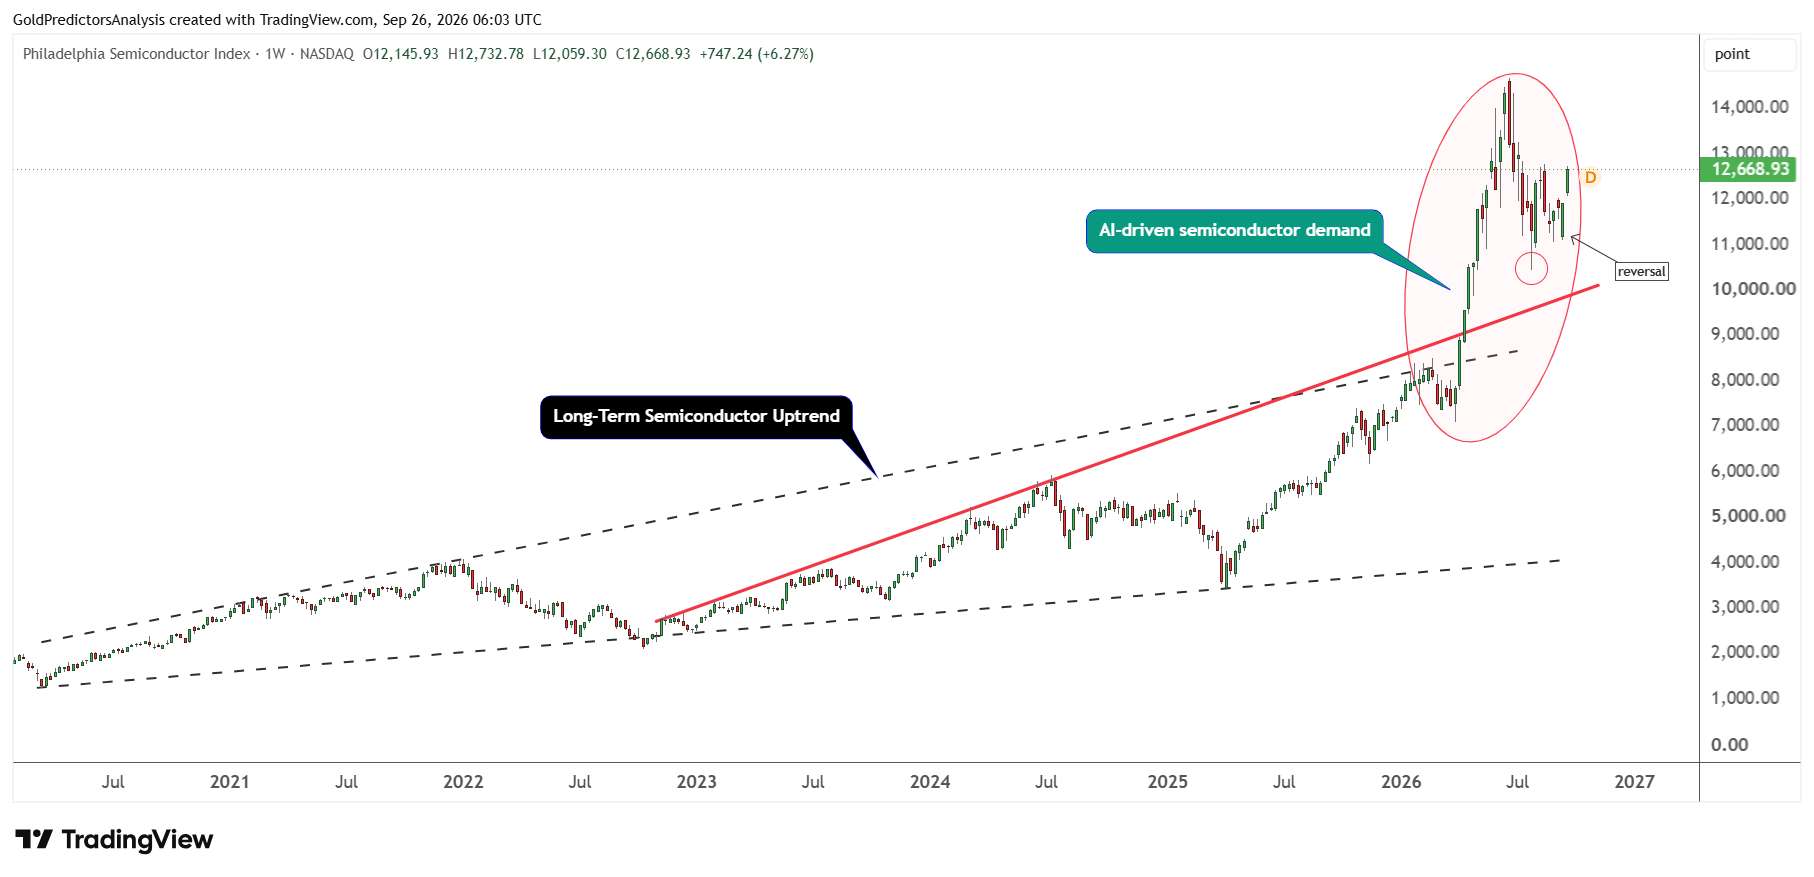
This suggests that the demand for technology stocks remains strong, though the trade dispute is still unresolved.
NASDAQ 100 Price Forecast
Every new NASDAQ 100 analysis as it publishes, today's technical signal and key levels, live price — on one page.
See all NASDAQ 100 forecastsNasdaq 100 Liquidity: Bank Reserves Fall Despite Easy Conditions
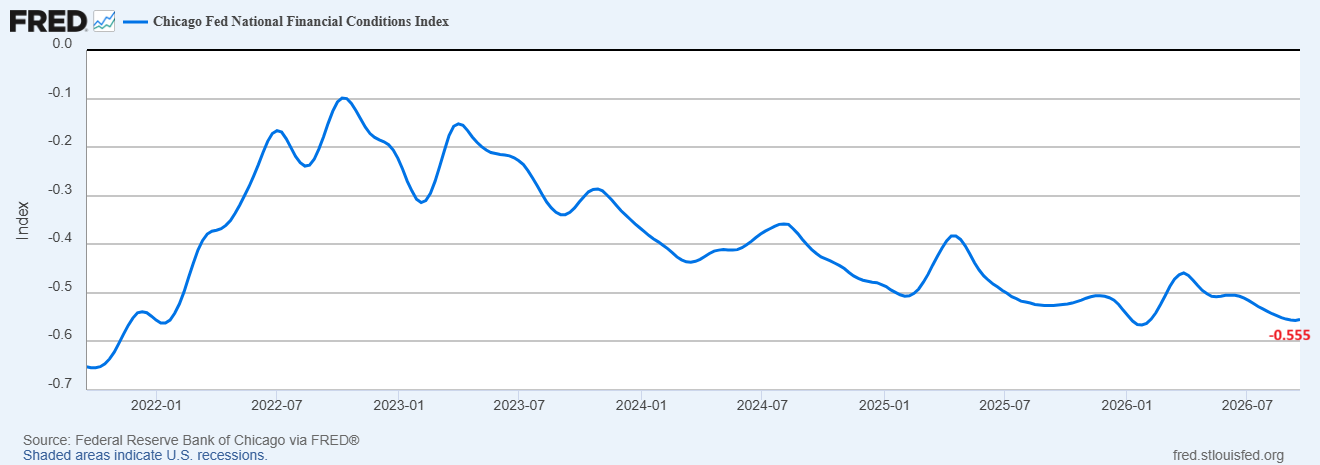
The chart below shows that the Chicago Fed National Financial Conditions Index remains at −0.555 for the week ending September 18. The negative reading means that financial conditions were looser than their historical average.
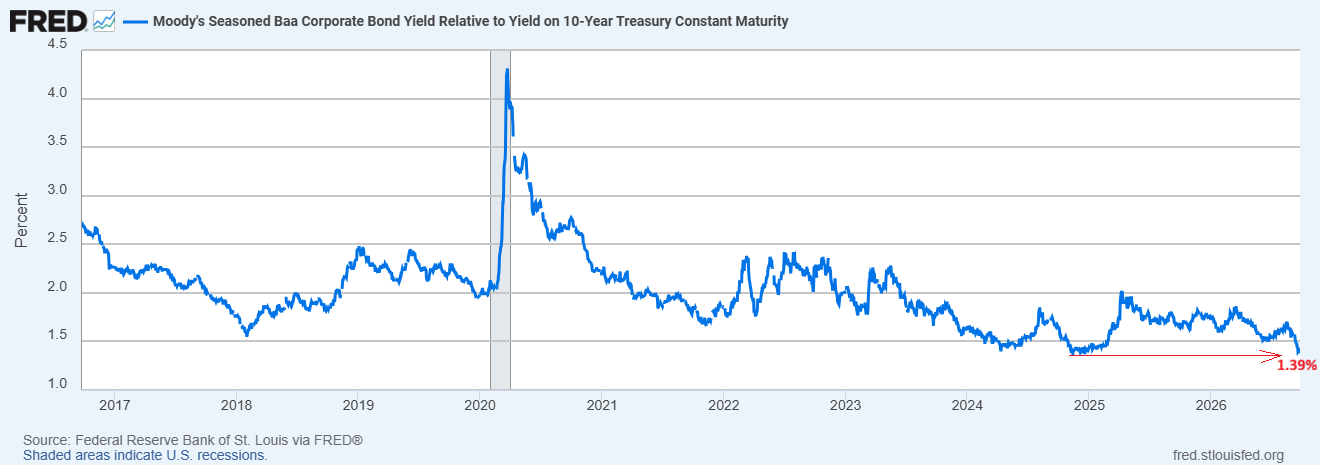
Moody’s Baa bond spread was also relatively narrow at 1.39% on September 24. These measures help explain why investors can still fund risk taking.
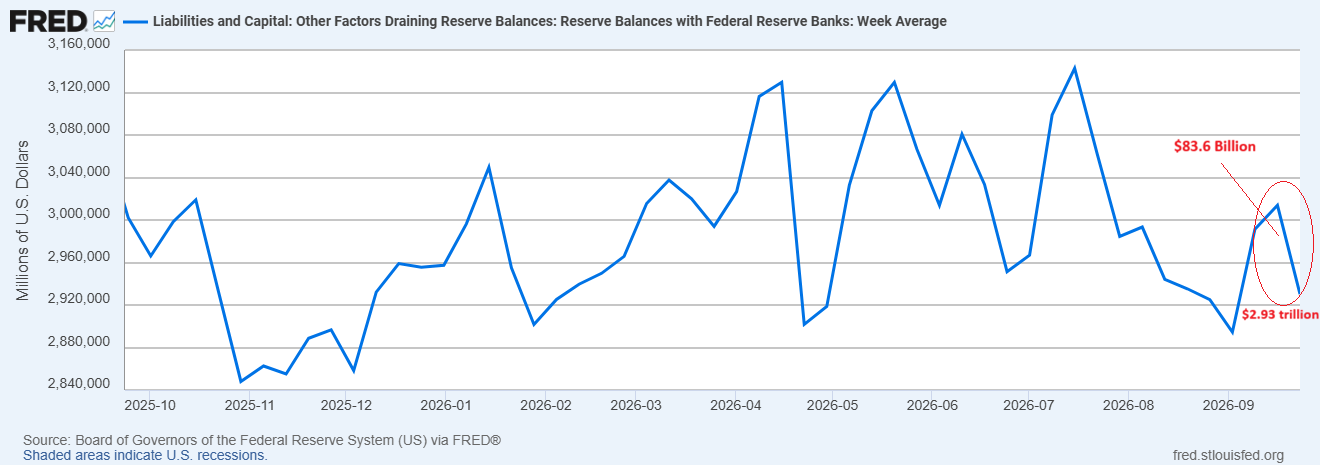
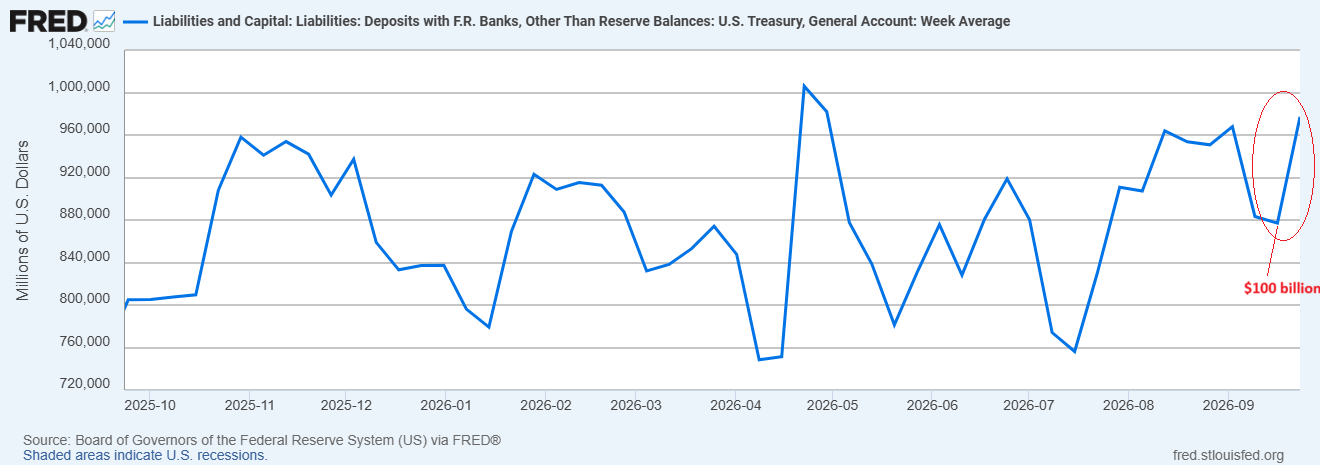
A more immediate warning came from the Fed’s balance sheet. Average bank reserves fell by $83.6 billion to $2.93 trillion in the week ending September 23.
Over the same week, the Treasury’s account at the Fed increased by $100.1 billion as seen in the chart below.
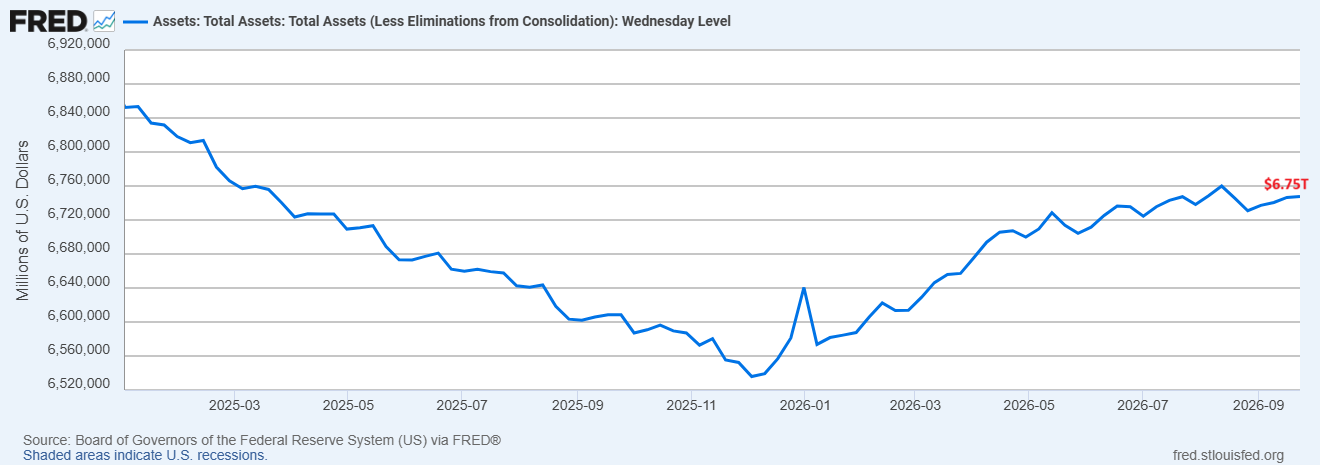
Total Fed assets stood at about $6.75 trillion. This is well above their level at the end of 2025 but the drop in reserves shows why a larger balance sheet alone does not guarantee easier funding for banks.
The repo market has remained orderly. SOFR was 3.88% on September 24, which is close to the 3.90% rate paid on bank reserves and below the 4.00% standing repo rate by the Fed.
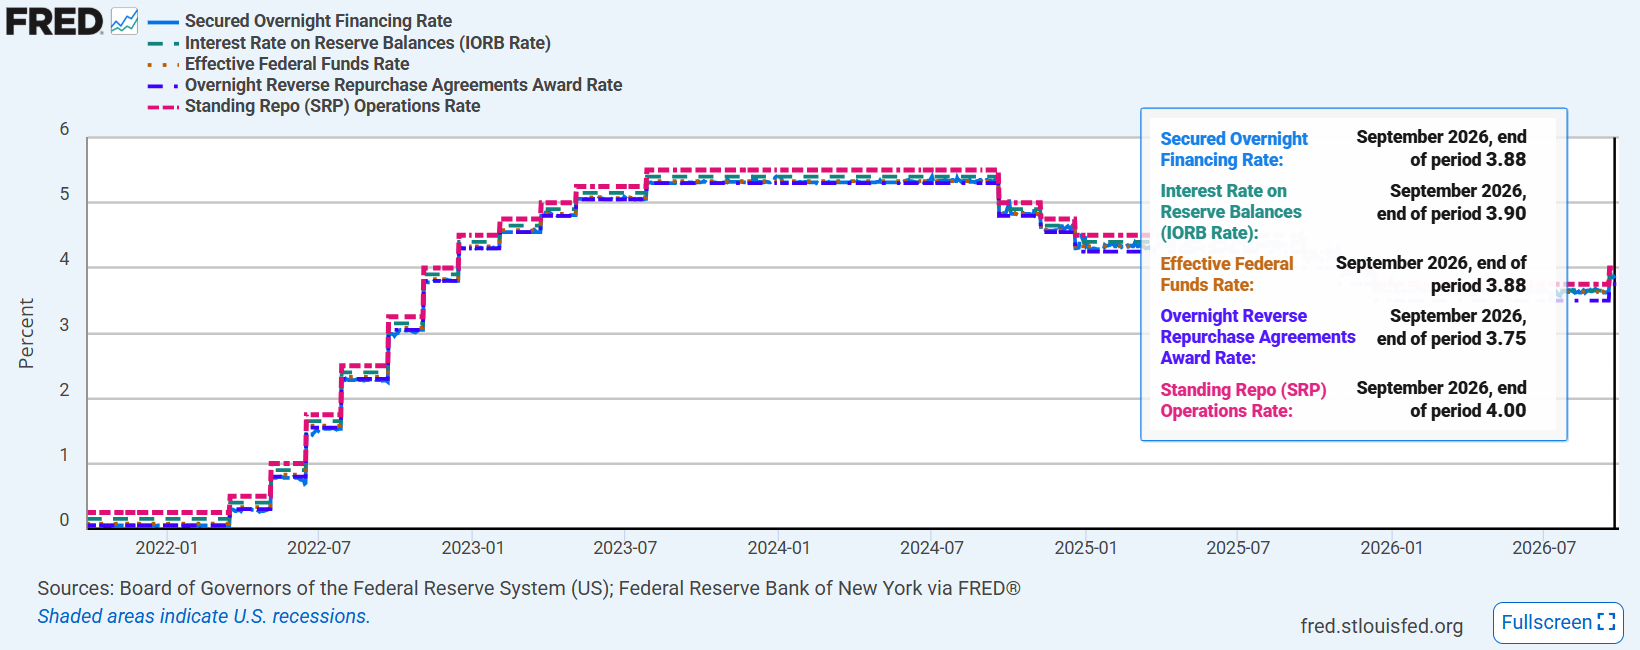
The standing facility offers eligible firms a funding backstop if pressure rises. The price of Bitcoin holds above $80,000, which also points to continued appetite for risk, but its price alone cannot confirm that the liquidity is improving across the financial system.
Bond Market Volatility: 5% Treasury Yields Test the Nasdaq 100 Rally
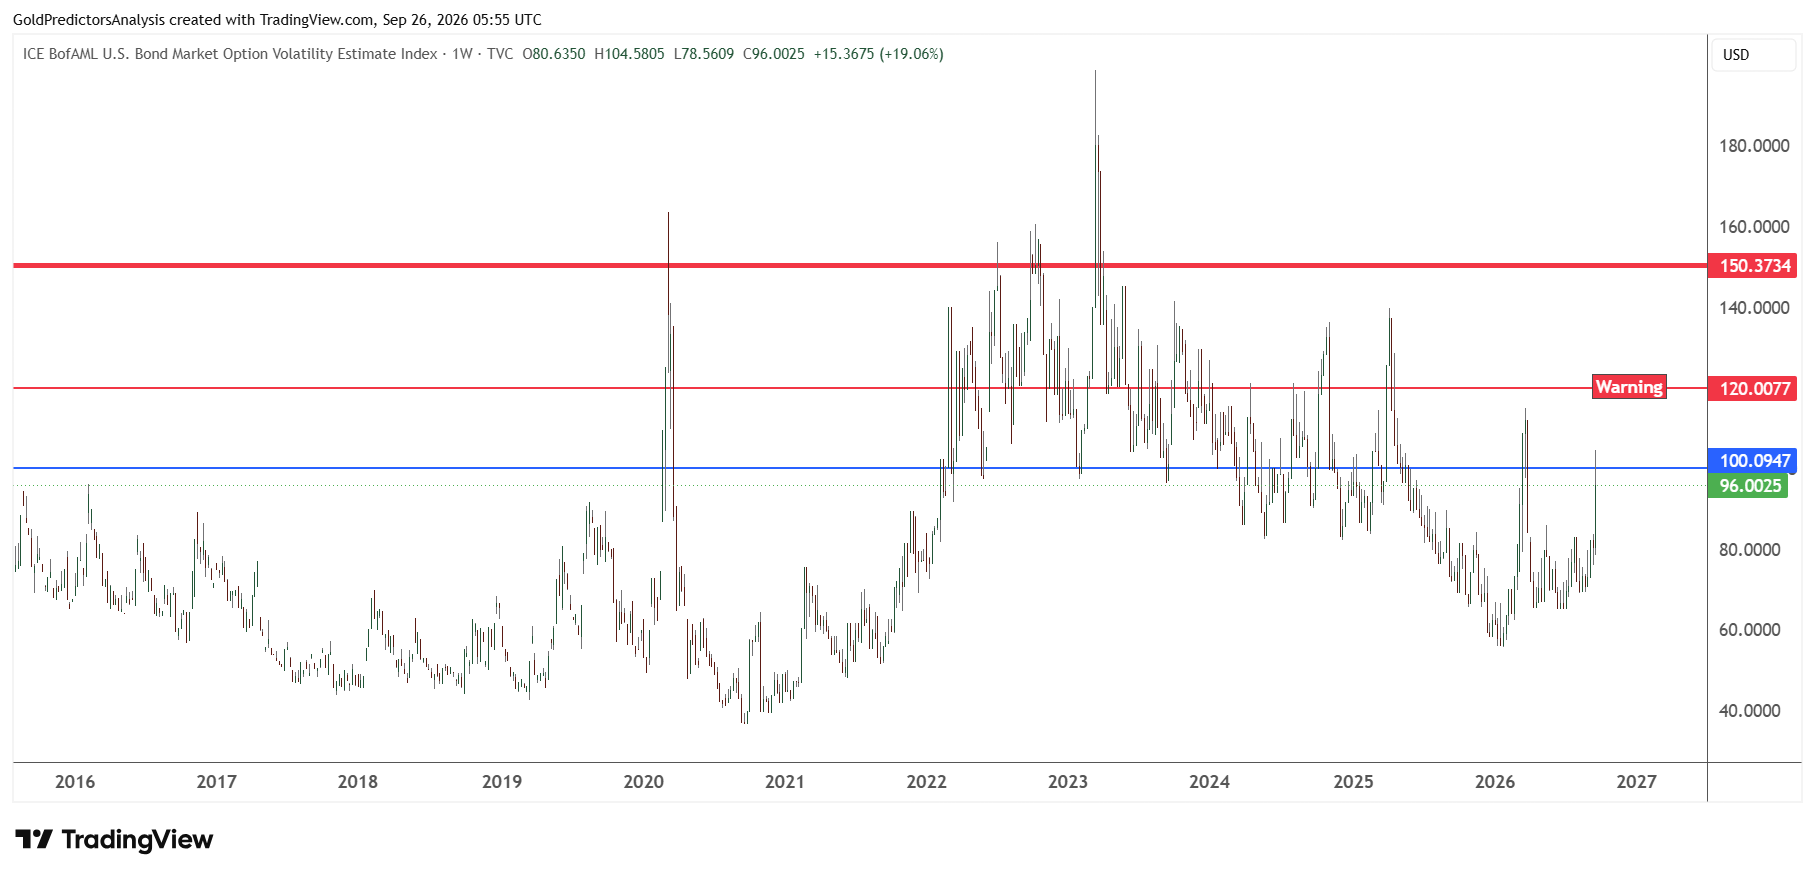
The volatility in the bond market also deserves closer attention. The MOVE index increased from 78.56 on Tuesday to 104.58 on Thursday before easing to 96.00 on Friday.
The index tracks expected swings in Treasury yields. The decline on Friday is welcome but the quick rise earlier in the week shows how fast conditions can change. I would treat a move above 120 as a warning and a move toward 150 as sign of much greater stress.
The U.S. 10-year Treasury yield reached about 5.20% on Friday. The surge in yields makes future earnings less valuable in today’s terms and can raise the cost of financing expansion in AI.
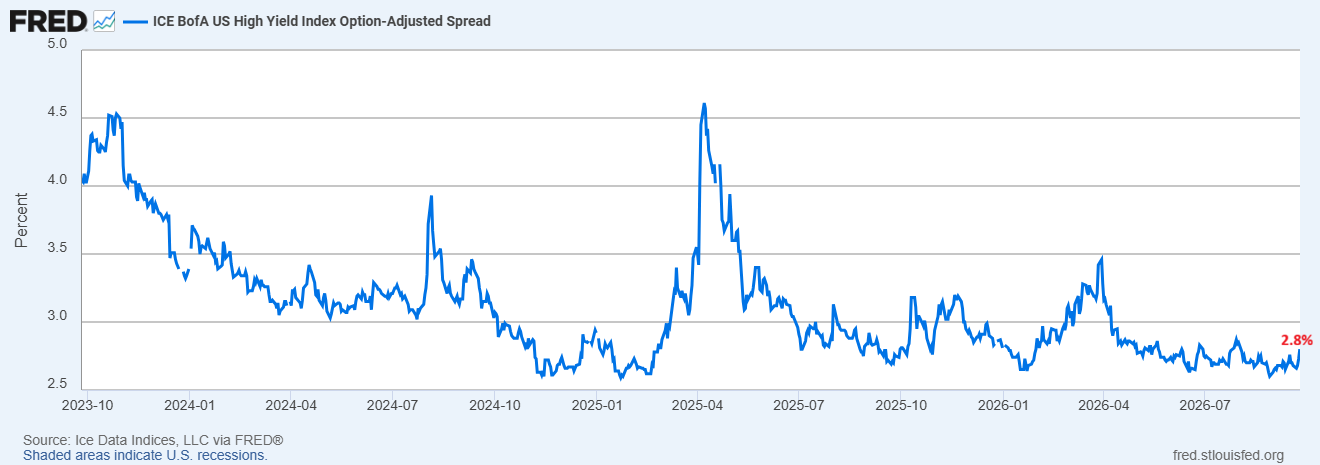
The chart below shows that the broad high-yield bond spread was 2.80% on September 24. It does not signal a credit crisis but a sustained increase alongside bond volatility would make the Nasdaq more vulnerable to a pullback.
Nasdaq 100 Technical Analysis: 30,600 Is the Key Level
The Nasdaq index shows a strong bullish price structure in the long term as seen in the weekly chart below. The chart shows the formation of a cup and handle pattern from November 2021 to January 2024.
The breakout from this pattern led to a strong surge to a record high. The V-shaped recovery in April 2025 and the strong surge after March 2026 suggest a strong bullish price structure.
Now, the index is forming an inverted head and shoulders pattern and has broken the record level in the 30,600 area. This breakout suggests that it is ready to spike again toward new record levels.
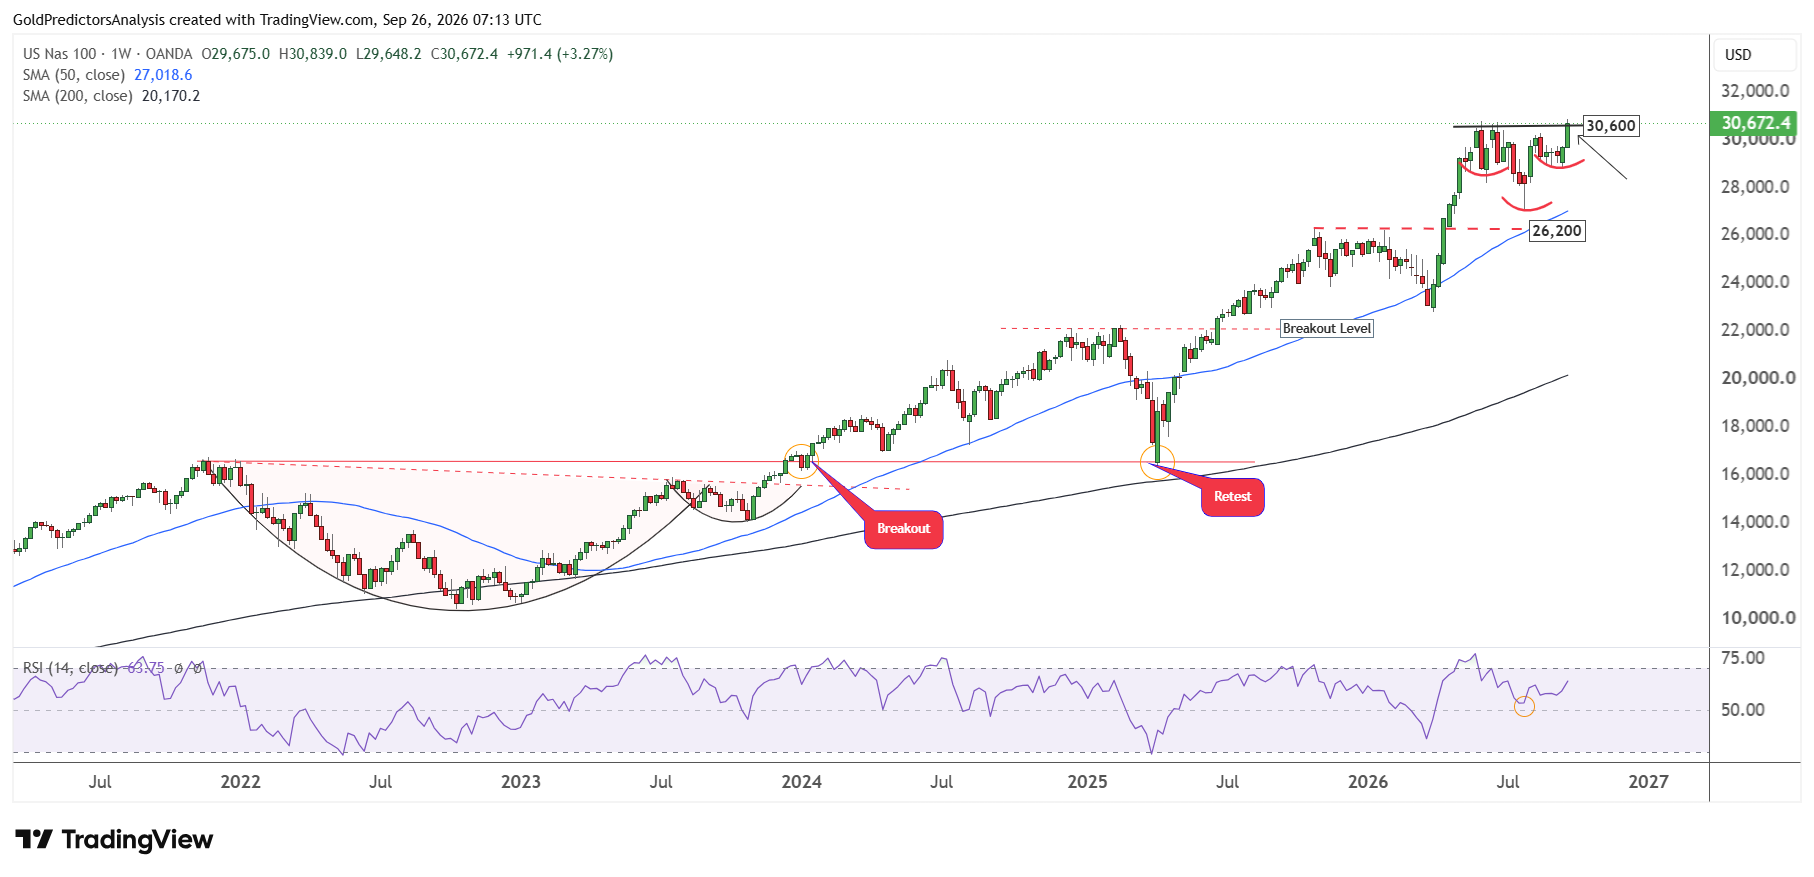
The RSI shows more constructive price action as it rebounds from the midline, which suggests that an upside continuation is possible.
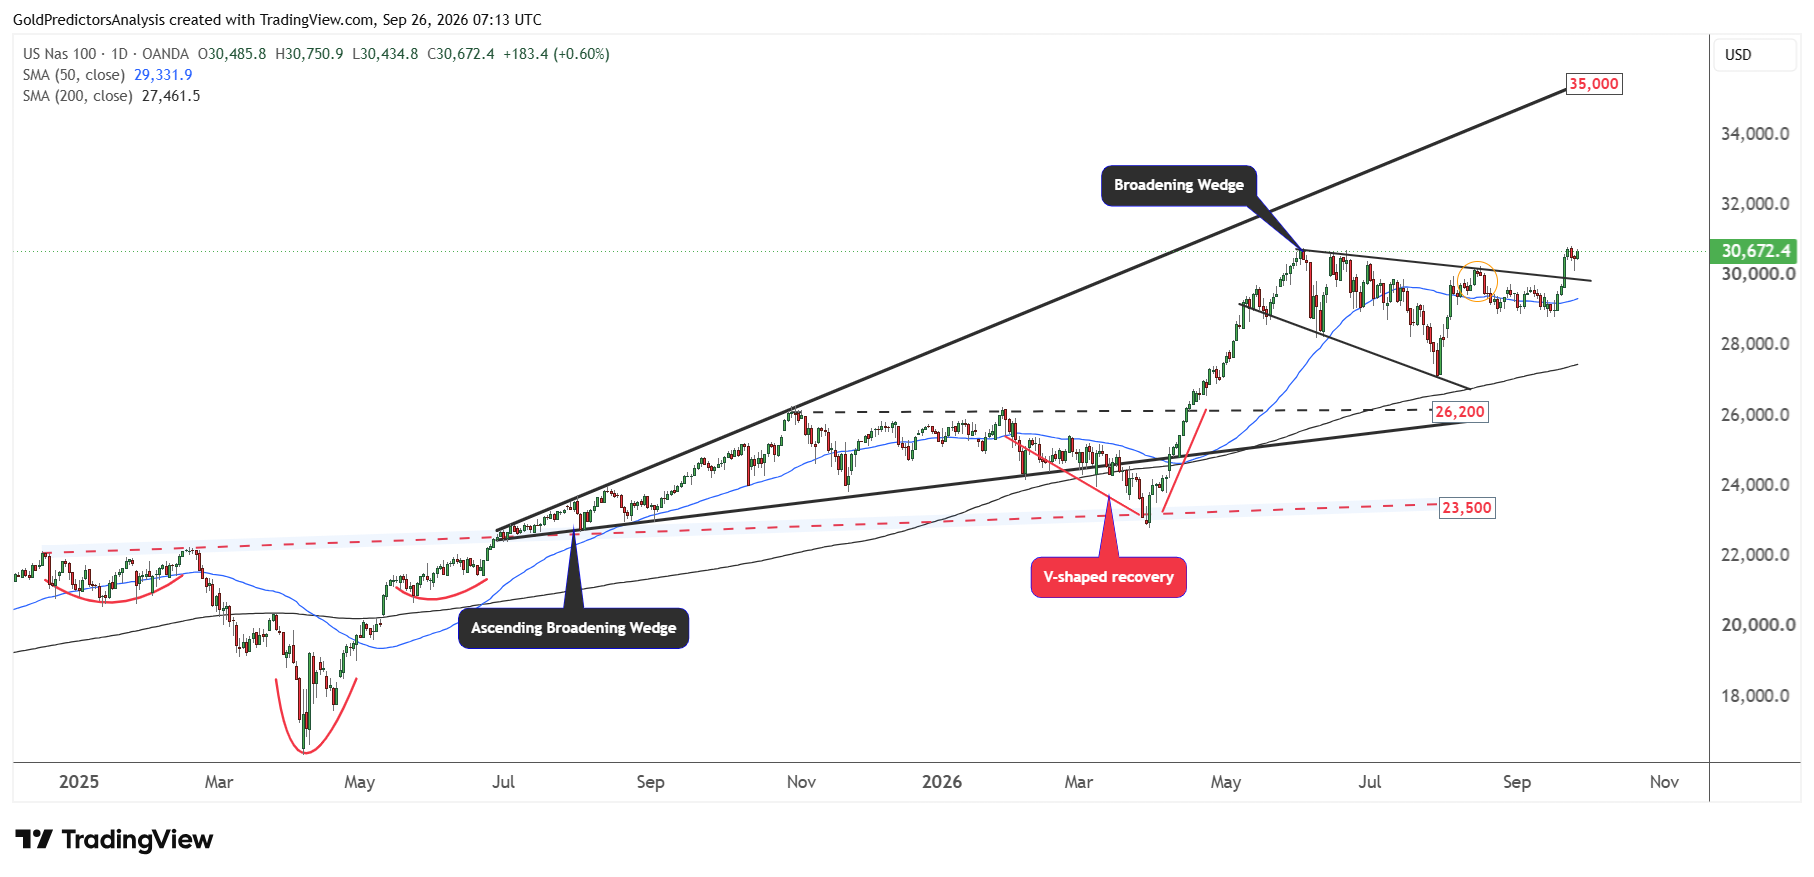
The constructive price action in the Nasdaq index is also evident on the daily chart. The daily chart shows the formation of an inverted head and shoulders pattern from December 2024 to January 2025.
The breakout from this pattern has pushed the Nasdaq index higher. The index has been trading within an ascending broadening wedge pattern since June 2025. The V-shaped recovery in March 2026 and the formation of a broadening wedge pattern from June 2026 to September 2026 indicate that the index is ready to surge higher again.
The index broke out of the broadening wedge pattern on September 21, 2026 and is now ready to move higher. This breakout suggests a strong surge toward the 35,000 area in the next few weeks. This target is defined by the ascending broadening wedge pattern that stretches from the June and July 2025 lows.
What to Watch Next for the Nasdaq 100
The trade truce gives technology companies more time to plan while broad financial conditions remain loose. The bank reserves fell sharply and bond volatility rose during the week. These signals could introduce corrections in the index in the short term if funding becomes harder to find. But the trade details on Monday and the next reserve data will suggest whether that risk is growing.
The Nasdaq 100 chart still favors further gains above 30,600. In my view, this breakout could take the index toward 35,000 as the primary target of this technical structure. This move depends on steady demand for AI stocks and volatility in bonds. If yields remain high or volatility in bond market rises again, the rally could face challenges to reach this target.