Fresh Copilot Catalyst Reinforces Buyer Control
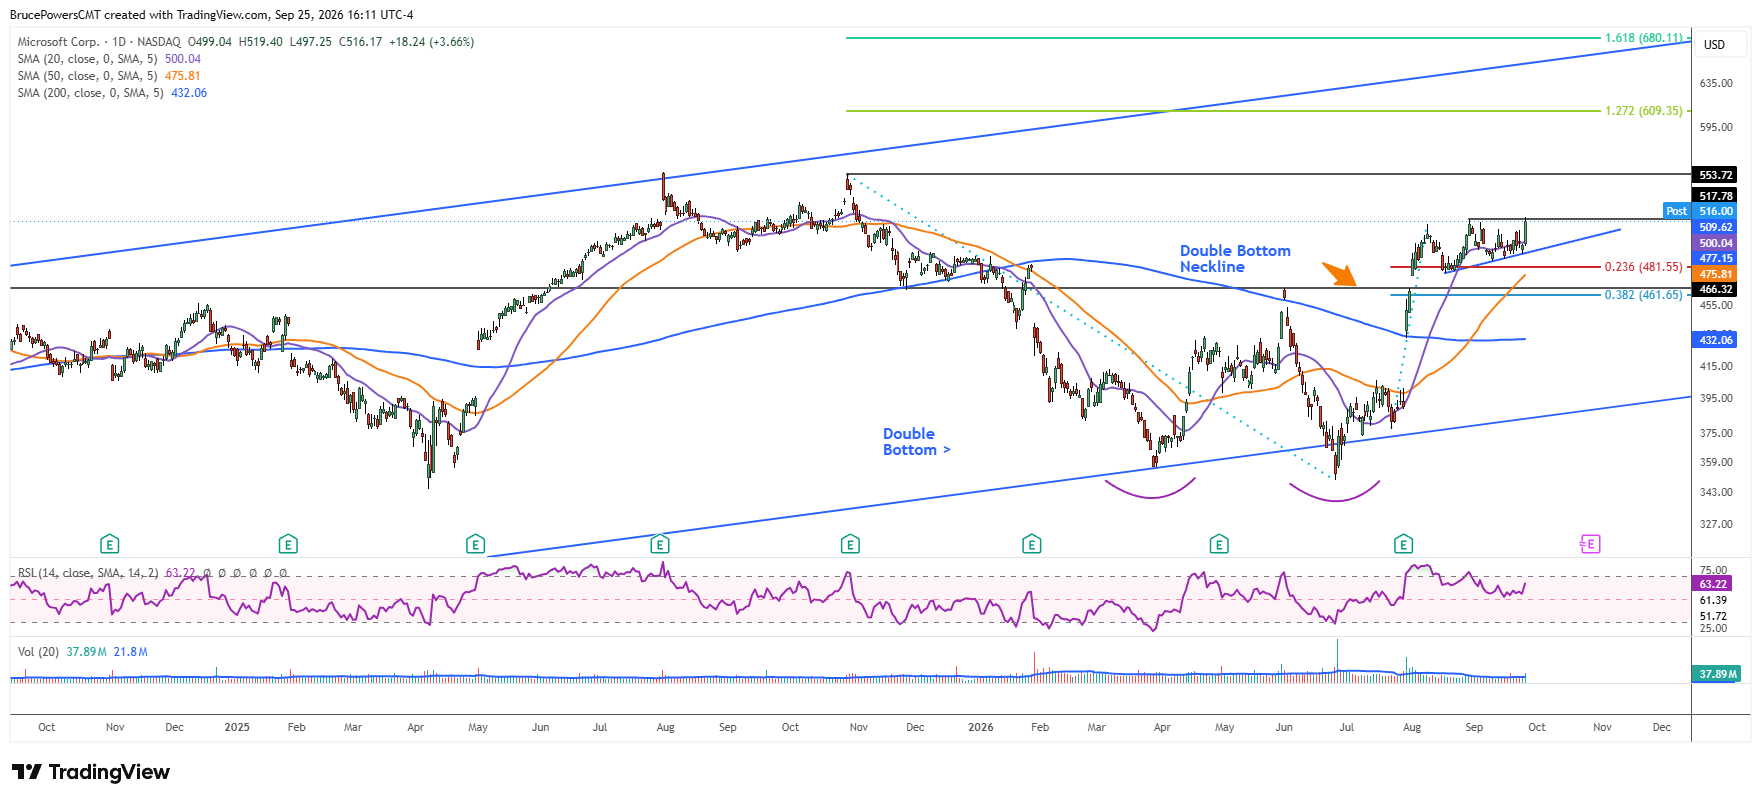
Microsoft Corp. (MSFT) stock extended its bullish trend on Friday to a new short-term high of $519.40 after the company announced a major overhaul to its Copilot AI platform, including a redesign and a greater push toward enterprise adoption. The move reinforces the evidence that buyers remain in control and keeps the door open for a continuation of the strong advance that followed Microsoft’s Q4 fiscal 2026 report after the market closed on July 29.
Buyers regained control after earnings beginning with a large upside gap when the market opened the next day. An initial swing high of $513.73 was subsequently reached, leading to a consolidation phase that eventually produced a high of $517.7 in late August.

Higher Support Levels Reveal Improving Demand
During the corrective phase signs of strength were indicated by relatively shallow pullback that followed the initial high and a rising lower boundary. Overall, pullbacks during consolidation showed improving underlying demand as each found support at a higher level than the prior. The first pullback from the initial high established a higher swing low of $477.15 after a 23.6% Fibonacci retracement completed. That indicates strong underlying demand and aggressive buyers. It also demonstrated strong support, as buyers regained control before the neckline of a double bottom pattern was tested.
Undercut-and-Rally Pattern Sets Larger Bullish Structure
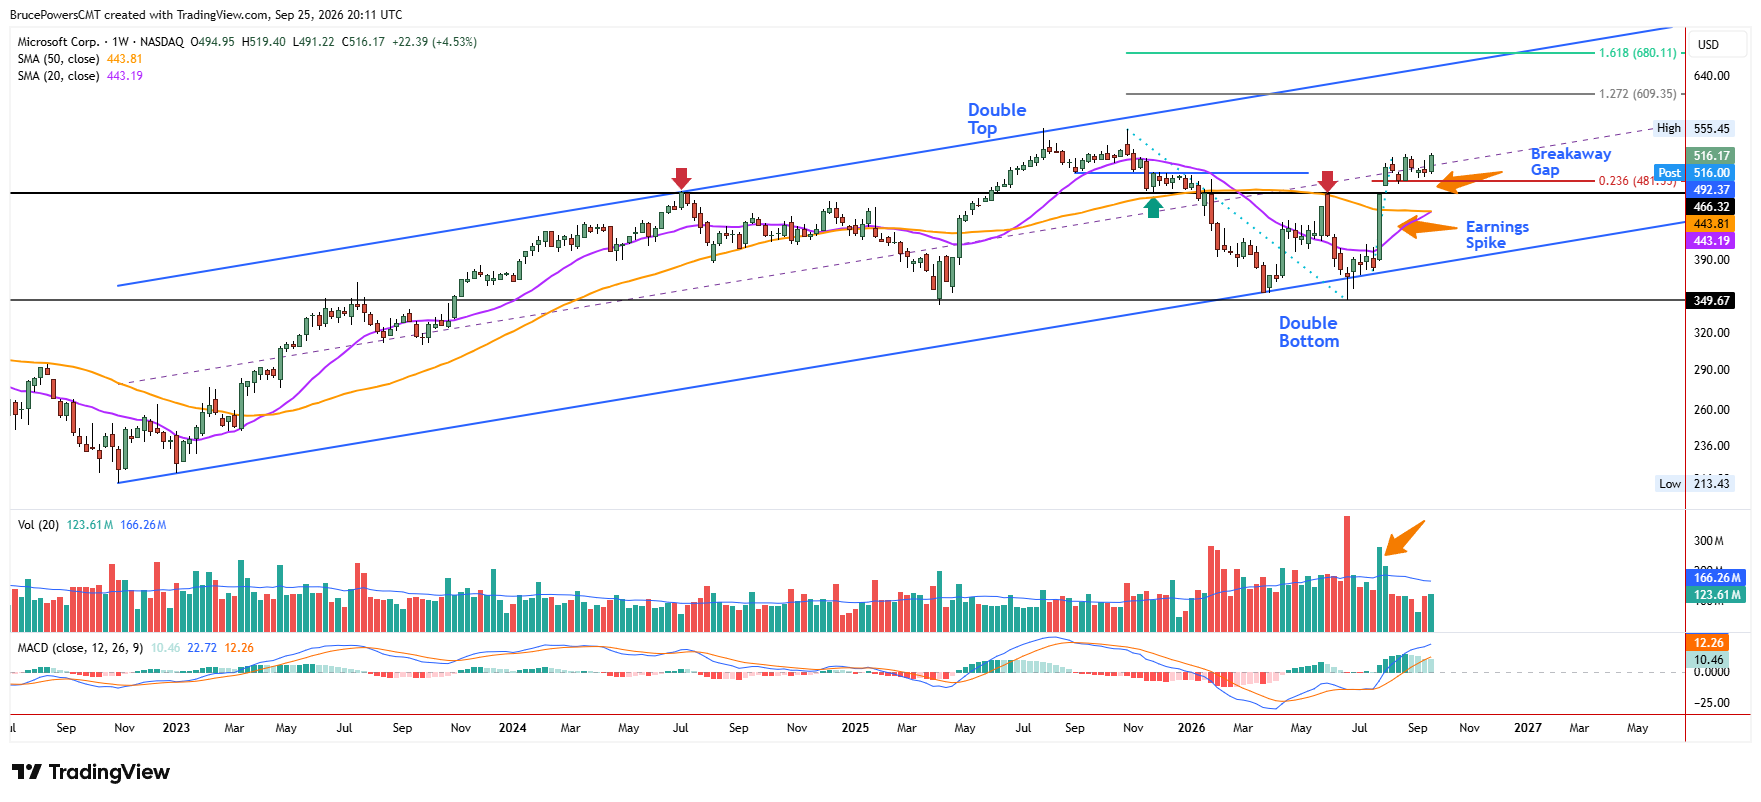
A breakout of the double bottom pattern triggered a bullish reversal signal during the August advance. That further confirmed the completion of the recent correction that followed the July 2025 peak of $555.45, eventually reaching a low of $349.20 in June. That low led to the establishment of an undercut-and-rally pattern on the weekly chart in June. The low week undercut the prior low of $356.51, initially signaling a continuation of the decline with sellers in control. Subsequently, by the end of the week MSFT close above that prior low and completed a bullish hammer candlestick pattern, with a trigger level at the weekly.
Breakout Potential Emerges as Consolidation Tightens
Taken together, MSFT continues to show technical strength that suggests an eventual breakout from consolidation and continuation of the bullish trend. The point is that MSFT continues to show technical strength the suggests an eventually breakout of consolidation and continuation of the bullish trend, initially toward the prior high of $555.45, followed by a 127.2% Fibonacci extension of the recent decline at $609.35.
Despite the potential for near-term continuation, resistance may hold near the top of consolidation, which could lead to another decline to test support near the rising lower boundary of the pattern, before another upside breakout attempt. That would keep the pattern of higher sequential support levels intact and preserve the improving underlying demand that has defined the consolidation.
If you’d like to know more about technical analysis and how traders use it, please visit our educational area.