AMD Technical Analysis
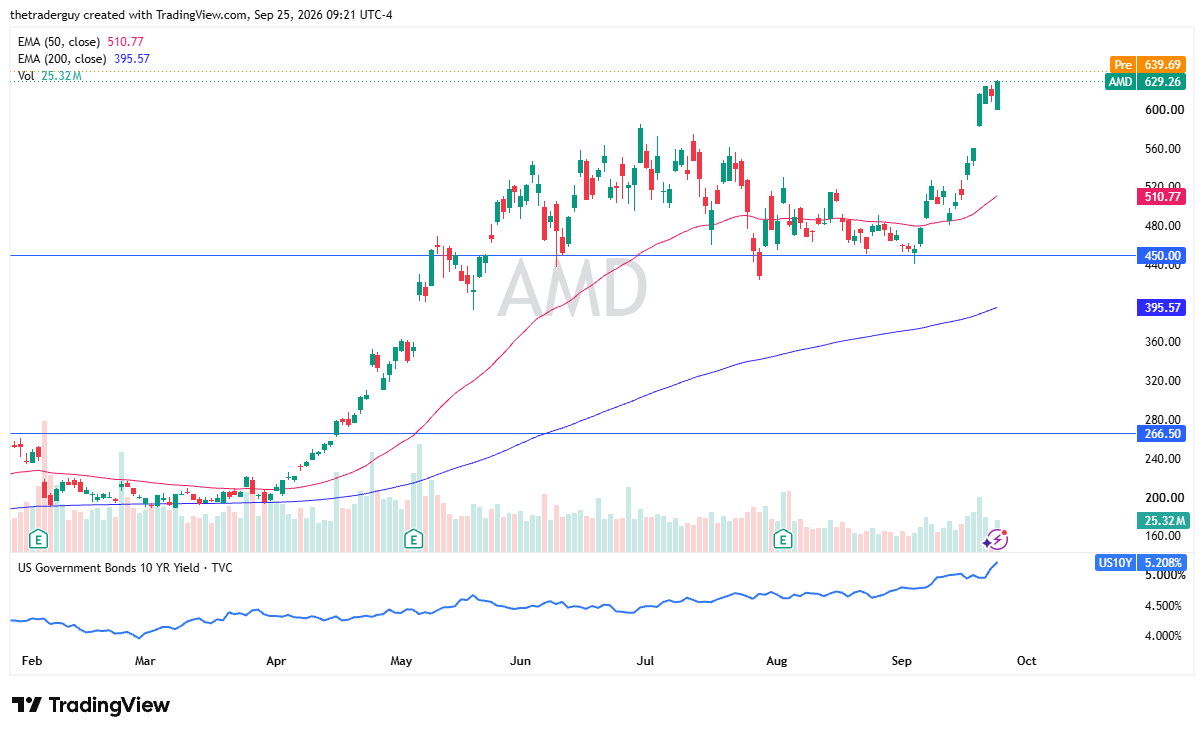
AMD looks like it’s going to gap higher to kick off the trading session on Friday, as we have seen quite a bit of momentum to the upside. Short-term pullbacks open up the possibility of finding support that traders can take advantage of for cheaper shares.
The $600 level is an area that captures my attention based on the psychology attached to it. That’s assuming that we even pull back to reach that level.

NVDA Technical Analysis
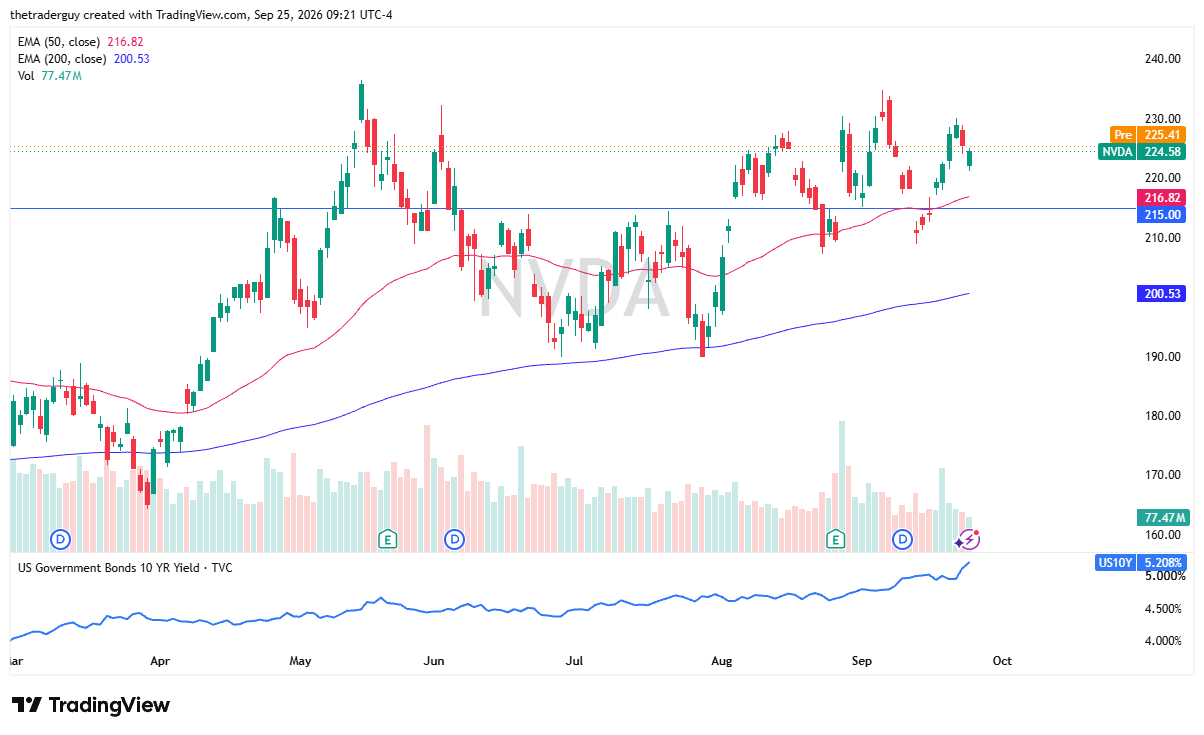
The market for NVIDIA looks fairly positive in pre-market trading as well, and then could be looking at the $230 level, where we had recently seen a little bit of a spike high. The NVIDIA market remains tied to the AI trade, obviously, and right now, with early trading at least, it seems like traders are willing to look past the extraordinarily high interest rates and take advantage of the ability to play on the future here.
The 50-day EMA sits just above the $215 level, with the $235 level above offering a bit of a barrier.
INTC Technical Analysis
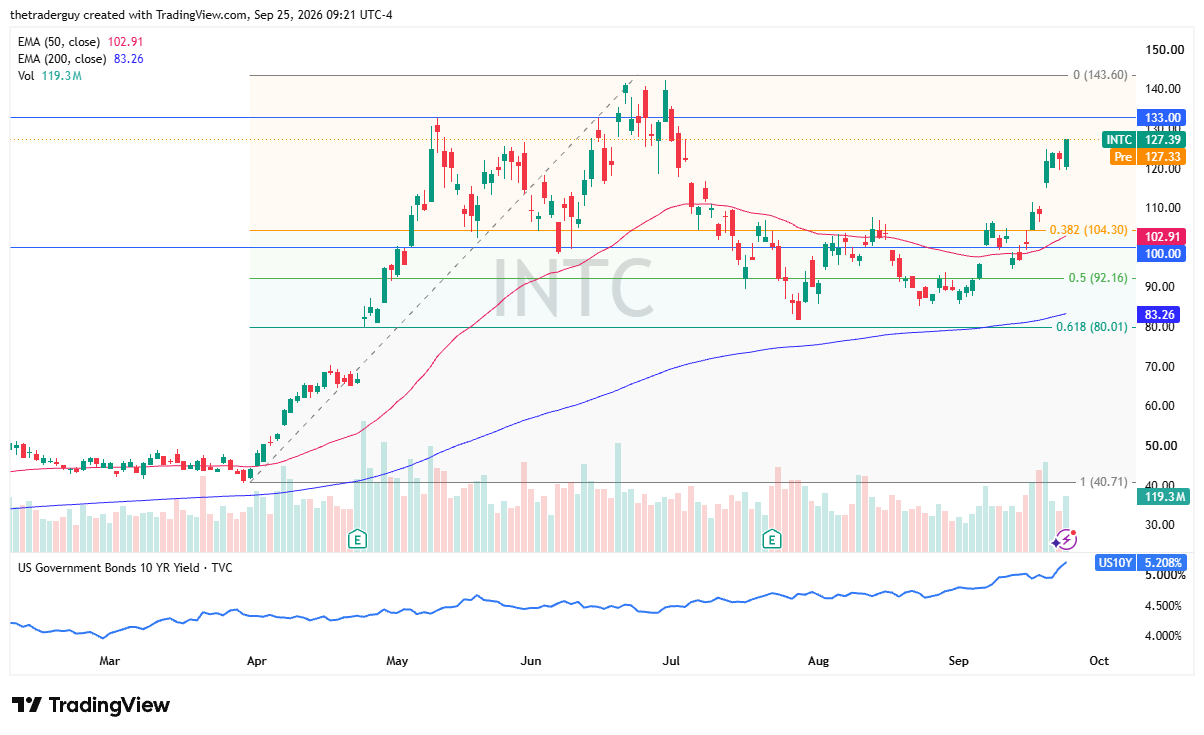
The market for Intel looks like it’s ever so slightly positive. Of course, we still have those elevated rates. The $140 level above could be a bit of a target. I think that $140 level is an area that traders will be looking at as a major swing high, a major resistance barrier, and ultimately, short-term pullbacks open up the possibility of the opportunity to find value in the market.
Ultimately, this is a market that I like a lot. It gets a lot of support from the U.S. government and, of course, is a great way to get exposure to data centers, PCs, AI, you name it.
If you’d like to know more about technical analysis and how traders use it, please visit our educational area.