NASDAQ 100 Technical Analysis
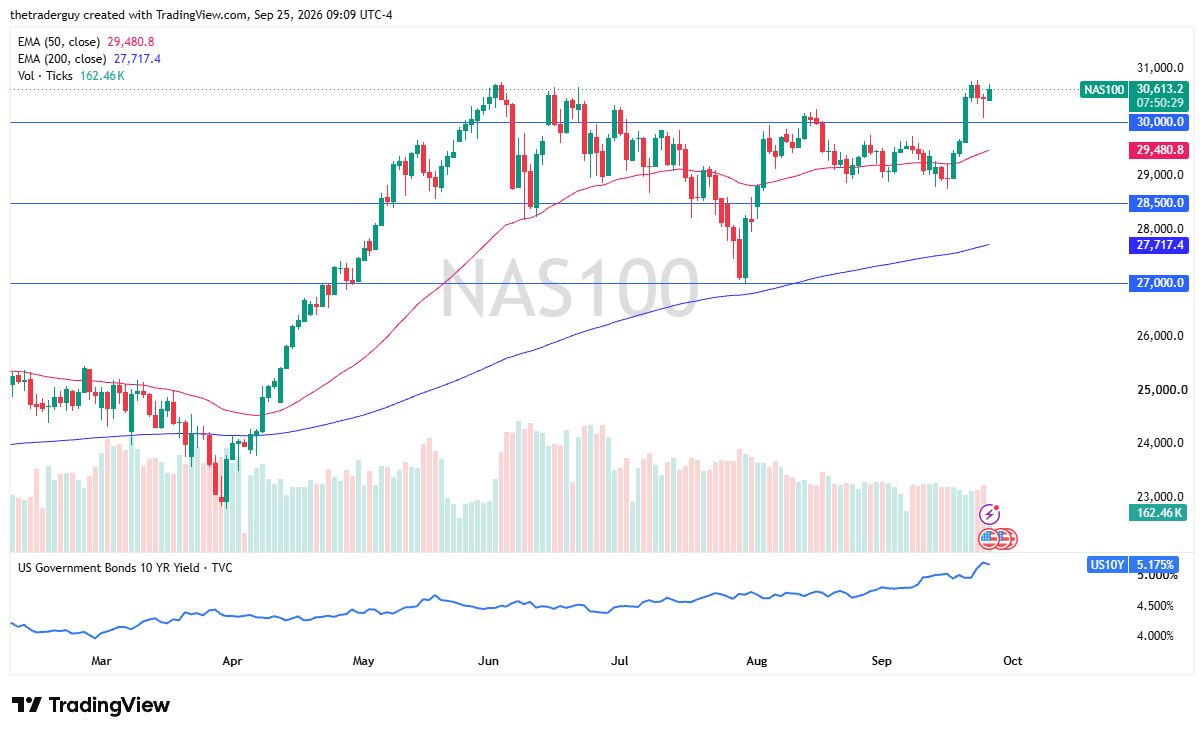
The Nasdaq 100 has rallied a bit during the early part of the trading session here on Friday, as it looks like we are trying to break out to the upside. The 31,000 level above, I think, is a big psychological and important resistance level. If we can break above that, then the market could go much higher.
Short-term pullbacks open up the possibility of finding a little bit of value, and I think the 30,000 level is going to be a major floor.

Dow Jones 30 Technical Analysis
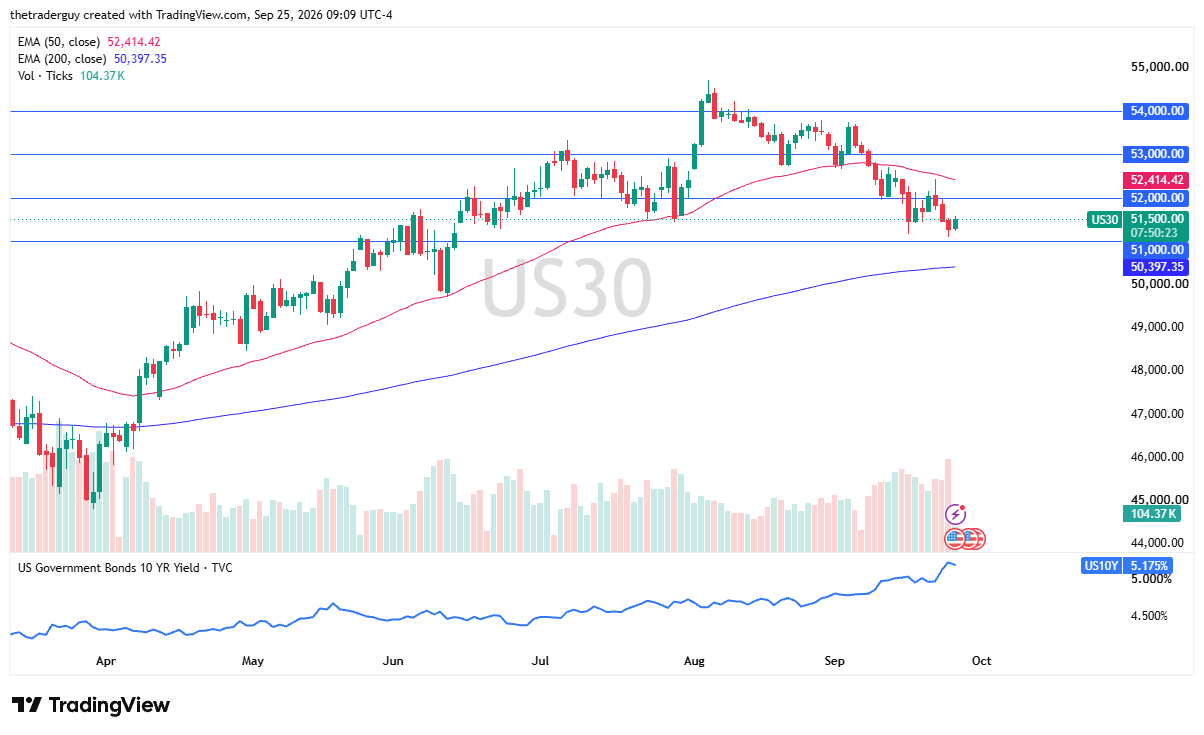
The Dow Jones 30 looks like it is trying to recover a little bit in early trading as well, which is a good sign. The Dow Jones 30 has done much worse than the other two major indices. With that being said, this is a market that is likely to continue to see a lot of headwinds when it comes to energy inflation, but the 52,000 level above, I think, might be an area that the market tries to test for resistance. If we can break above there, it would be a good sign.
S&P 500 Technical Analysis
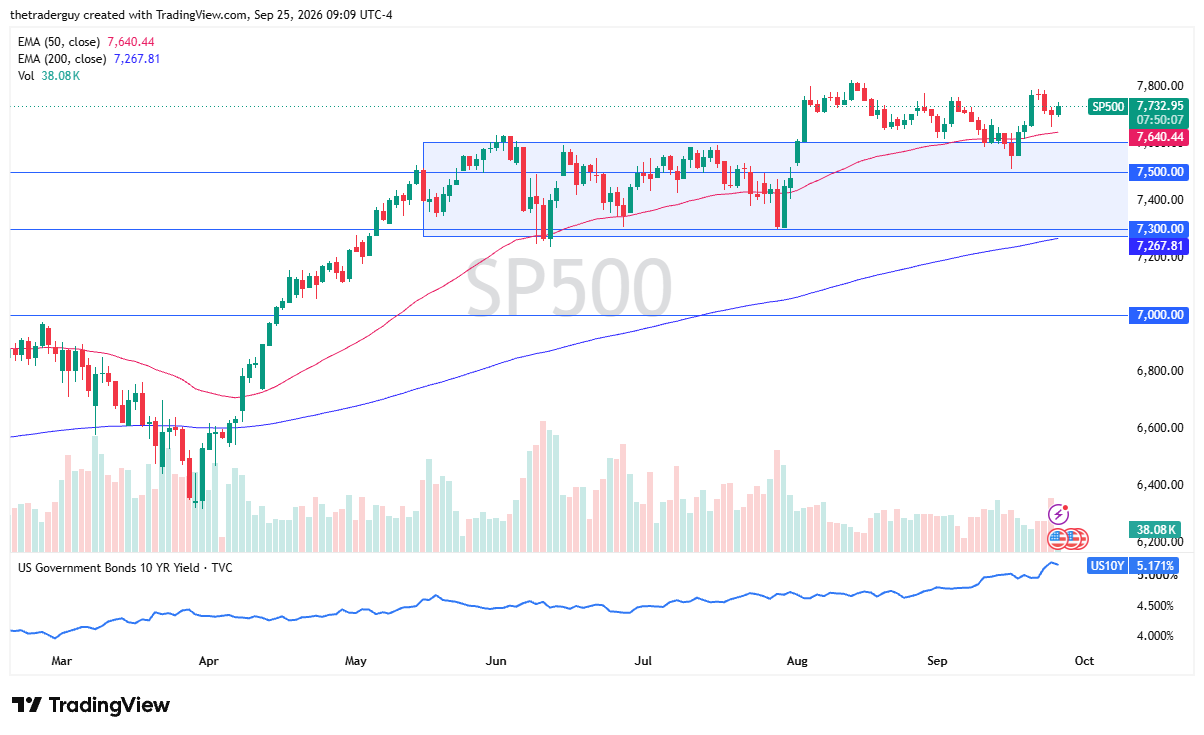
The S&P 500 rallied a bit during the trading session here on Friday, as we have broken above the top of a hammer that did form during the Thursday session. It does look like we are trying to do everything we can to turn things around. The 7,800 level is an area that previously had been resistance. If we can break above that area, it would be a very bullish sign.
As things stand right now, the 50-day EMA at 7,640 continues to be a little bit of a floor here. Interest rates trying to roll over during the session may help U.S. indices, but they are still pretty elevated.
If you’d like to know more about chart patterns and how to trade them, please visit our educational area.