


Completed Target Brings a Pause
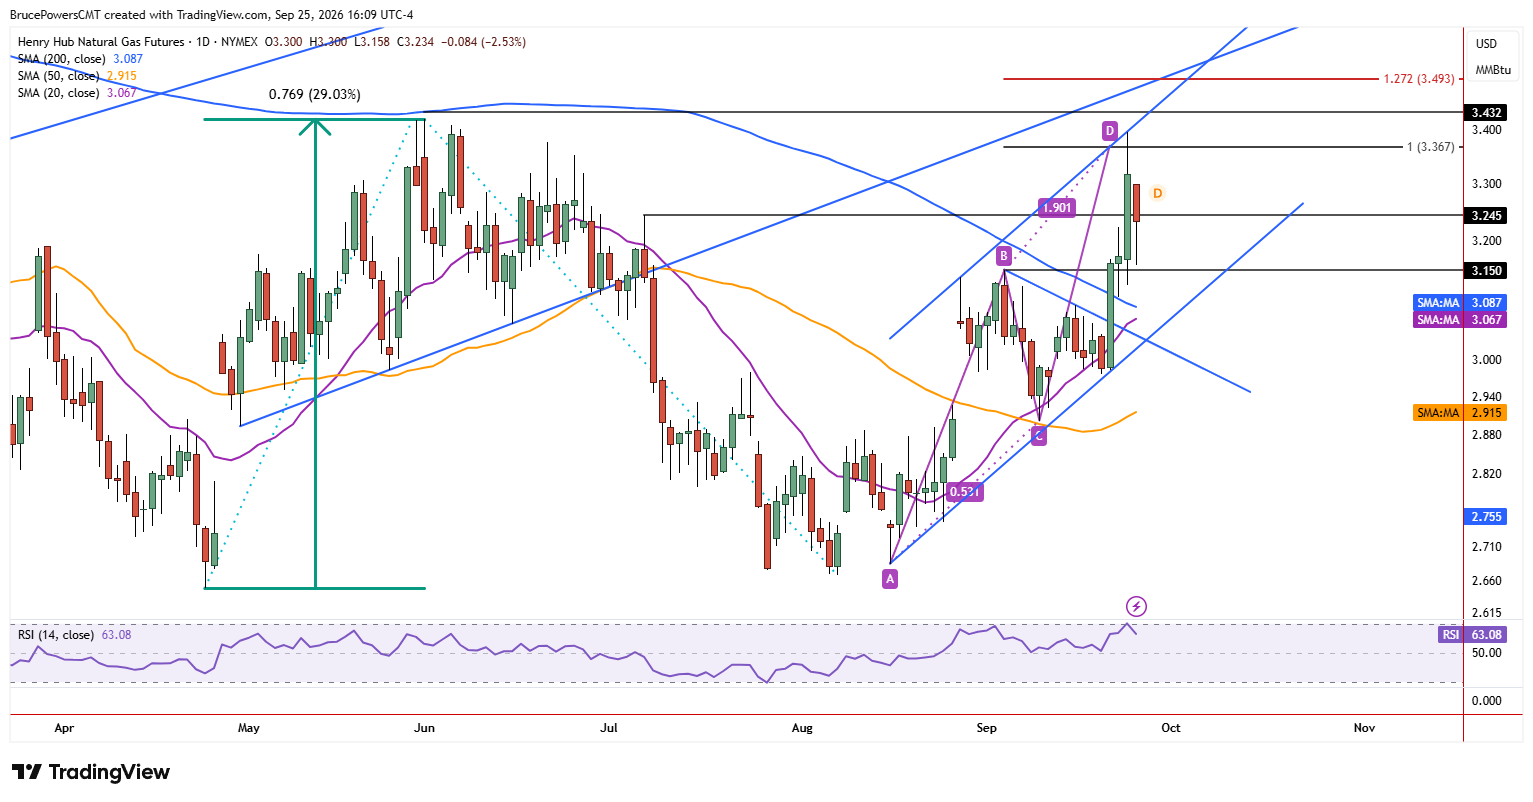
Natural gas pulled back and consolidated on Friday, following a new high of $3.395 and the completion of a key upside target. Trading resulted in an inside day with a higher daily low of $3.158 and a lower daily high of $3.30, establishing these levels as short-term support and resistance, respectively.
The corrective price action followed the completion of a 100% projected target from a rising ABCD pattern at $3.367 (D), which was reached on Thursday and reinforced as resistance by the upper boundary of a rising parallel trend channel. With both the ABCD target and channel resistance now identified, a deeper pullback or consolidation looks more likely before another attempt at new highs.

Support Zone Emerges Below Channel Resistance
Initial support near the prior high of $3.097 was tested with Friday’s low and held, at least for now. Nonetheless, the rejection of price near the top of the rising channel suggests a potential decline to the lower boundary for another test of support. Notably, price symmetry between the two consecutive upswings coincided with the discovery of key resistance. A rejection from the upper channel boundary increases the potential for support to be tested at the 200-day moving average, currently around $3.09. This level is closely aligned with the prior breakout area, adding to its technical significance.
20-Day Moving Average Approaches a Key Cross
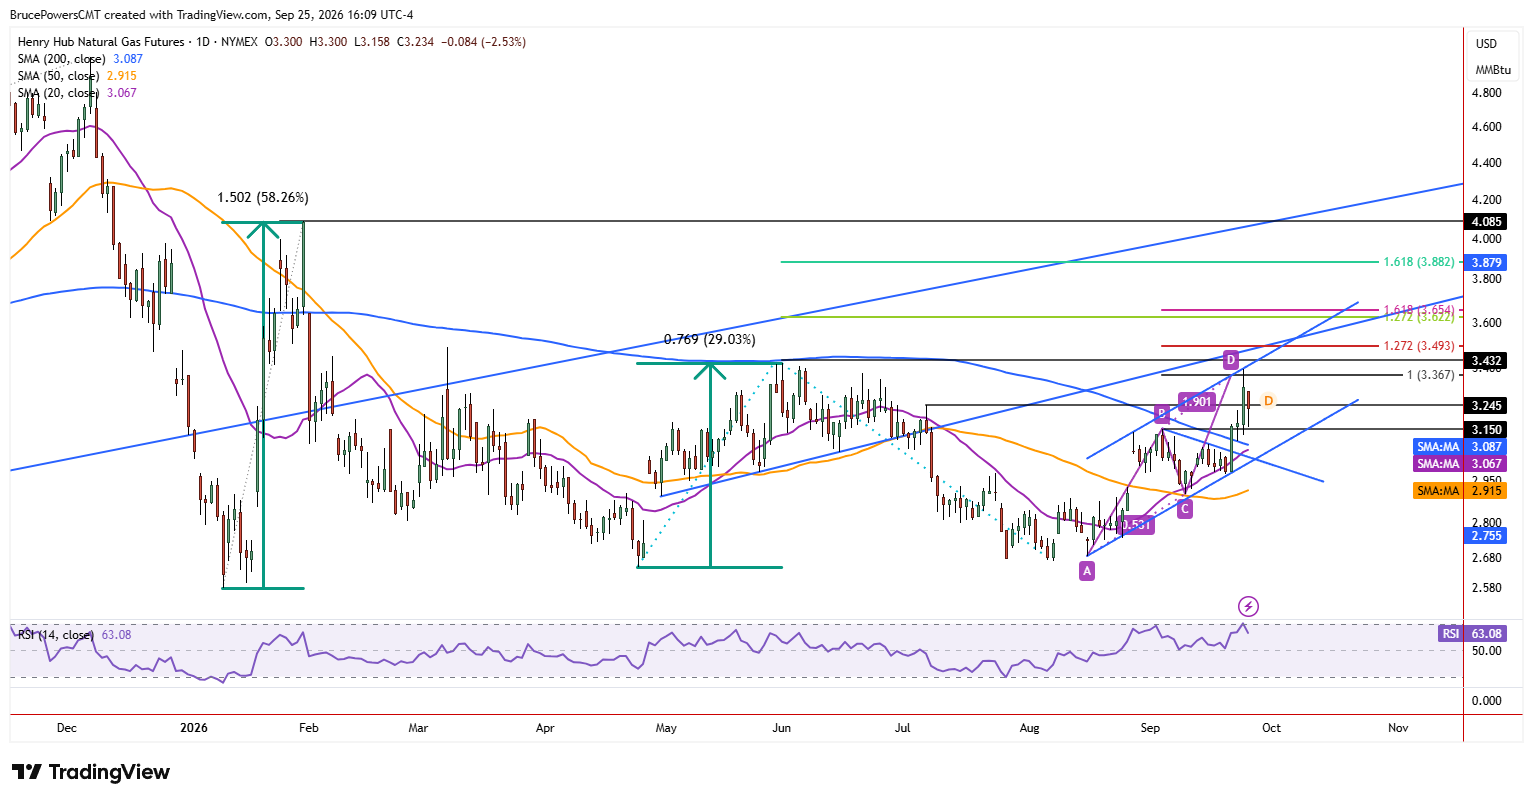
Also, the rising 20-day moving average near $3.07 will soon cross above the 200-day moving average, potentially replacing it as near-term dynamic support for the developing advance that began from the August lows. That would also indicate improving bullish momentum. Going forward the 20-day moving average would then be a key area to look for support that could help trigger another advance. A successful test there would strengthen the case that the current pullback is corrective rather than a reversal of the broader advance.
Consolidation Could Set Up Another Breakout
Now that a key target has been reached and confirmed as resistance, natural gas may enter a period of diminished volatility as it develops a corrective phase. Following a pullback and the establishment of a higher swing low, natural gas may be ready to attempt a breakout above $3.395, which would open the way toward a challenge of resistance near the June high of $3.418. Thus, the current consolidation could ultimately serve as a pause within the larger advance, provided key support levels continue to hold.
If you’d like to know more about how to trade natural gas, please visit our educational area.



