
Gold Found Buyers After Thursday’s Break but the Weekly Loss Is Still Running
Spot Gold is higher Friday after the dollar, Treasury yields, and crude oil all eased overnight. Buyers stepped in near the same price area tested after the September 16 Fed decision. That area held again. Gold is still headed for a weekly loss.
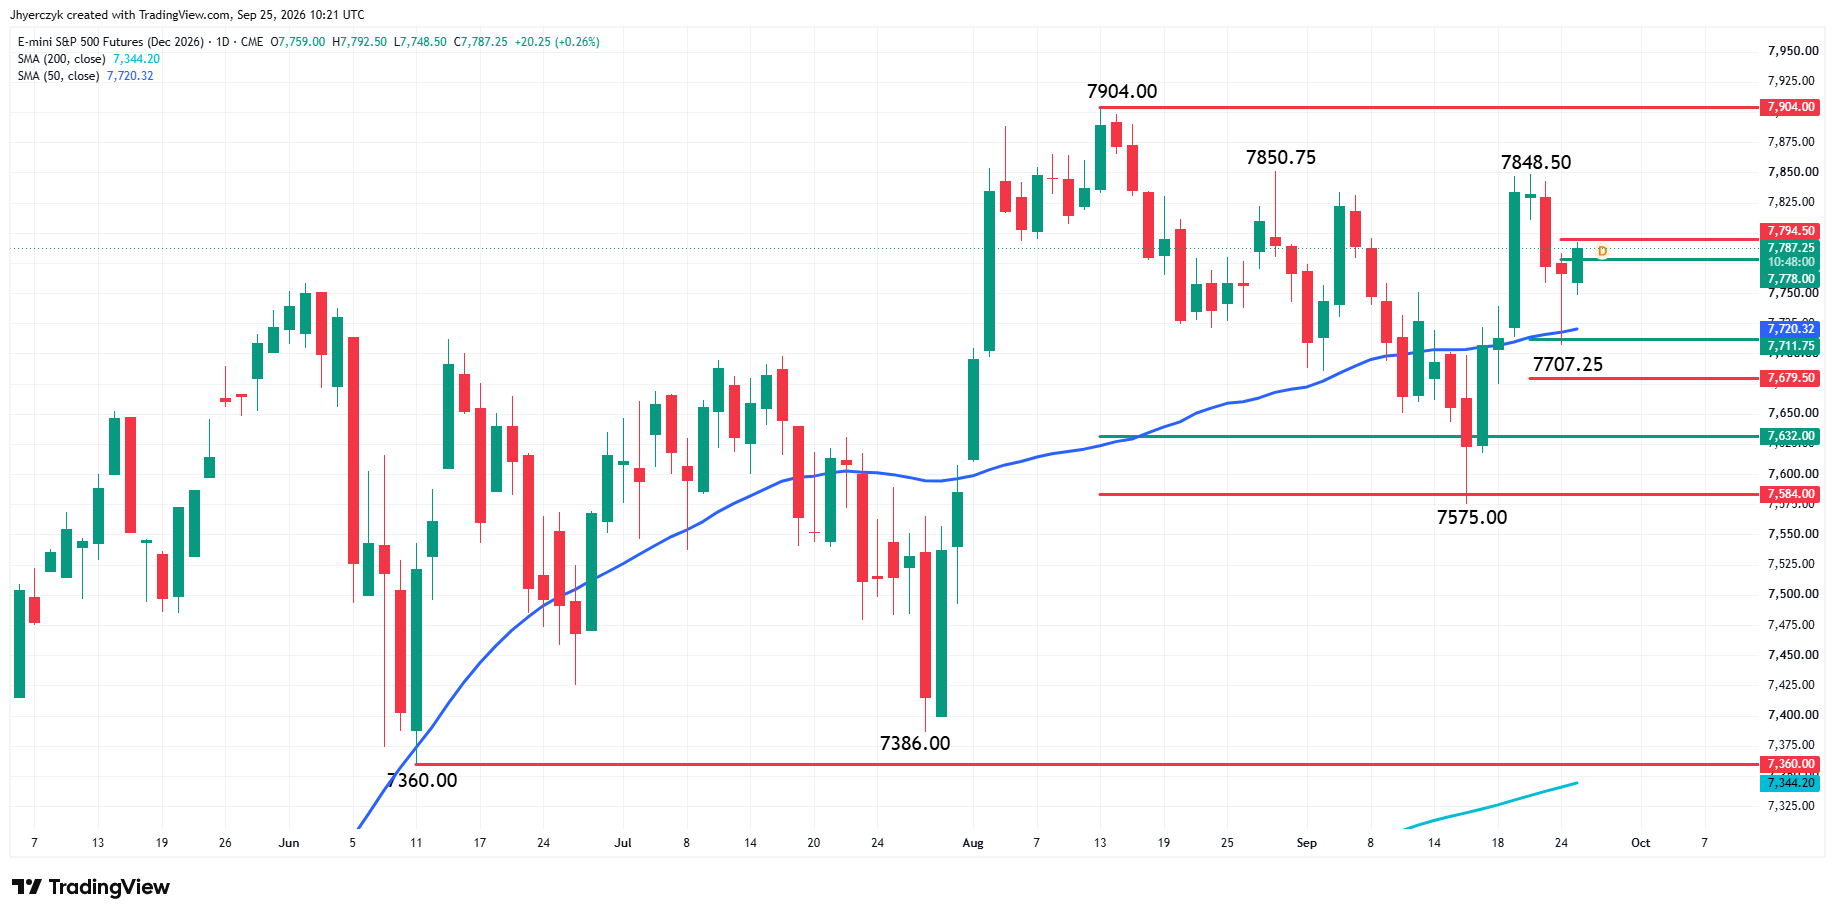
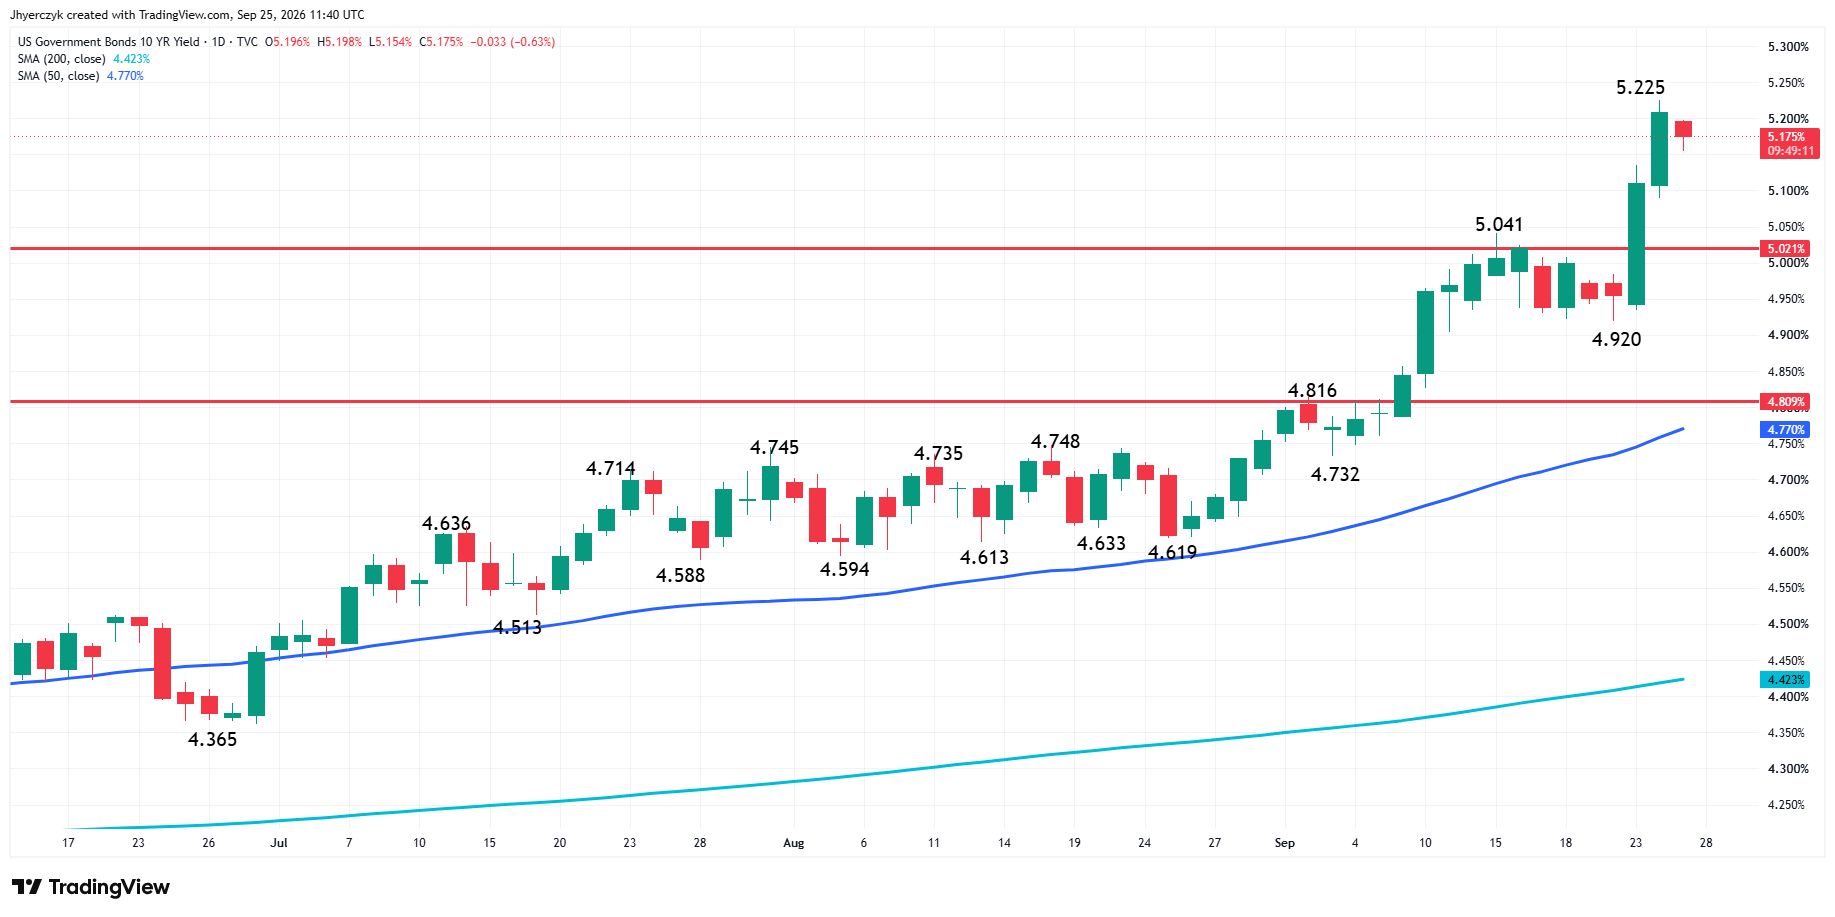
The 10-year Treasury yield remains near its highest since 2007 and the 30-year near its highest since 2004. Fed funds futures are carrying about a 66% chance of another hike in October and a 93% chance of a December increase. Friday’s bounce is a reaction to less pressure from the three markets that drove Thursday’s selling.
At 11:32 GMT, Spot Gold is trading $4,305.43, up $31.63 or 0.74%. The session high is $4,315.80 and the low is $4,256.36.

Crude Came Off the Highs and the Metals Followed
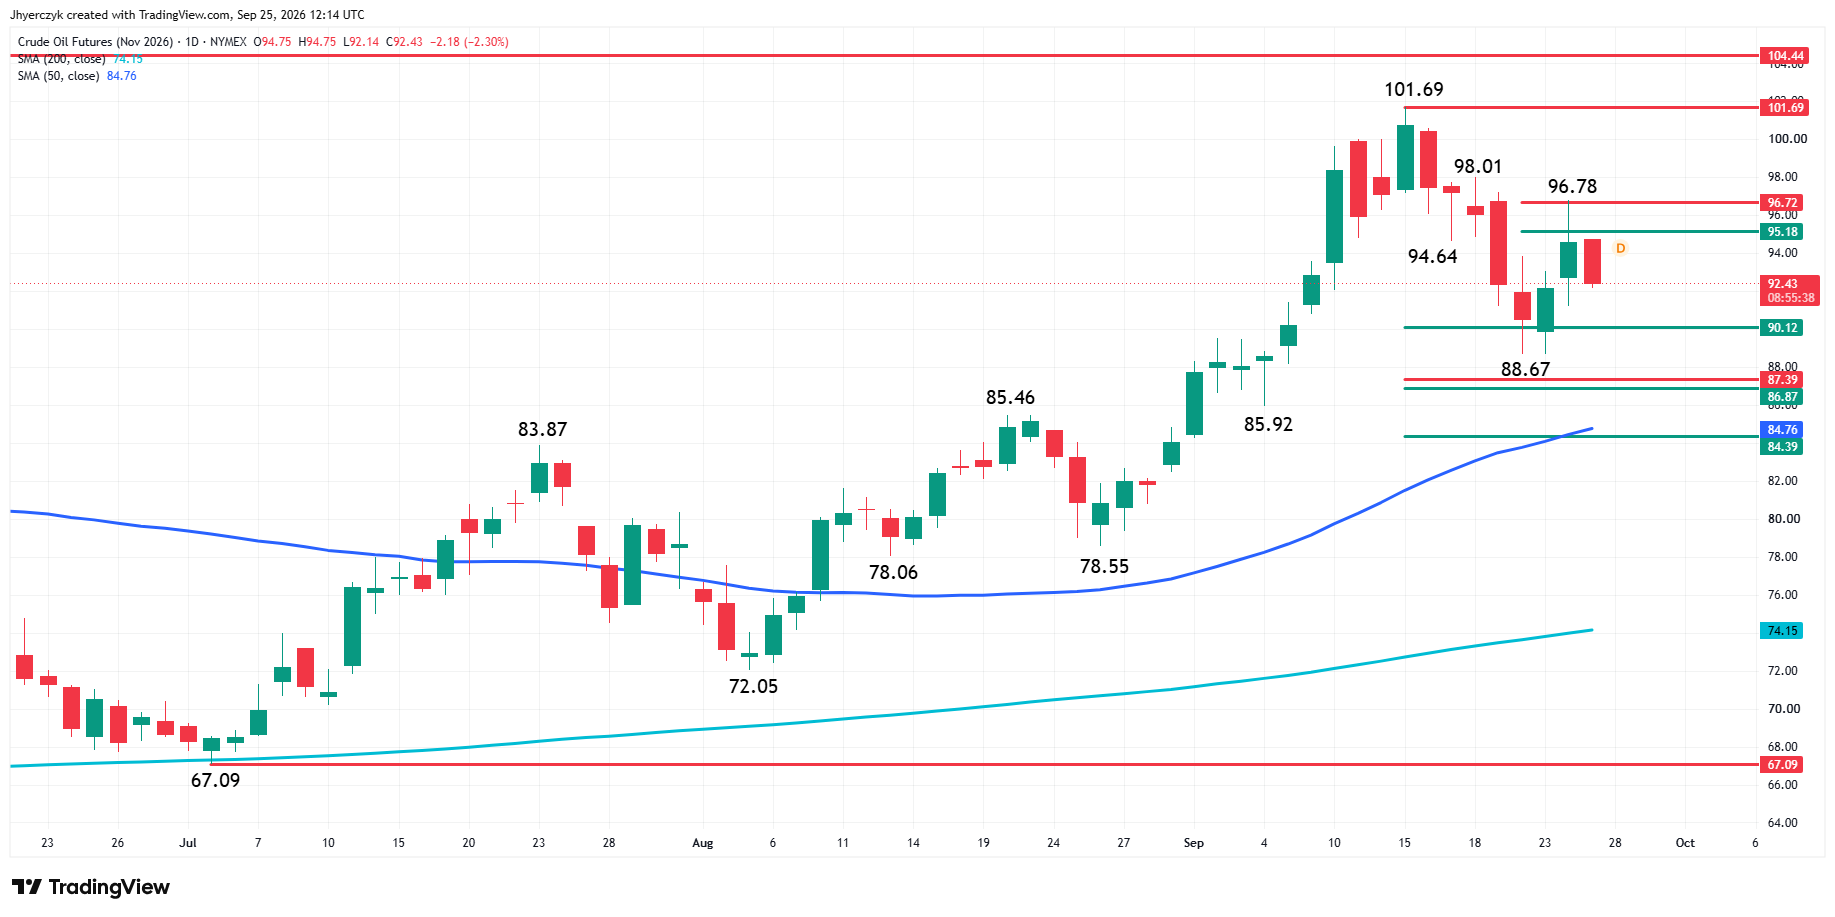
Crude oil backed off Friday as traders revisited reports that U.S. and Iranian negotiators are discussing a phased agreement tied to reopening the Strait of Hormuz. The report is not a signed deal. Tanker traffic has not returned to normal. It was enough to ease the energy side of the trade heading into Friday.
Gold did not need a new headline. It needed crude, yields, and the dollar to stop pressing at the same time. All three turned lower overnight. Buyers showed up near the September 16 level where initial selling also failed to hold two weeks ago. Two tests of the same area in two weeks and both attracted buying.
Thursday was the opposite session. Crude rallied. Yields ran to 5.23% on the 10-year. Gold lost ground. Friday reversed the inputs and gold responded. The bounce makes sense against Thursday’s session. It does not change what the bond market did this week.
The Dollar Is Softer Friday but Up More Than 1% for the Week
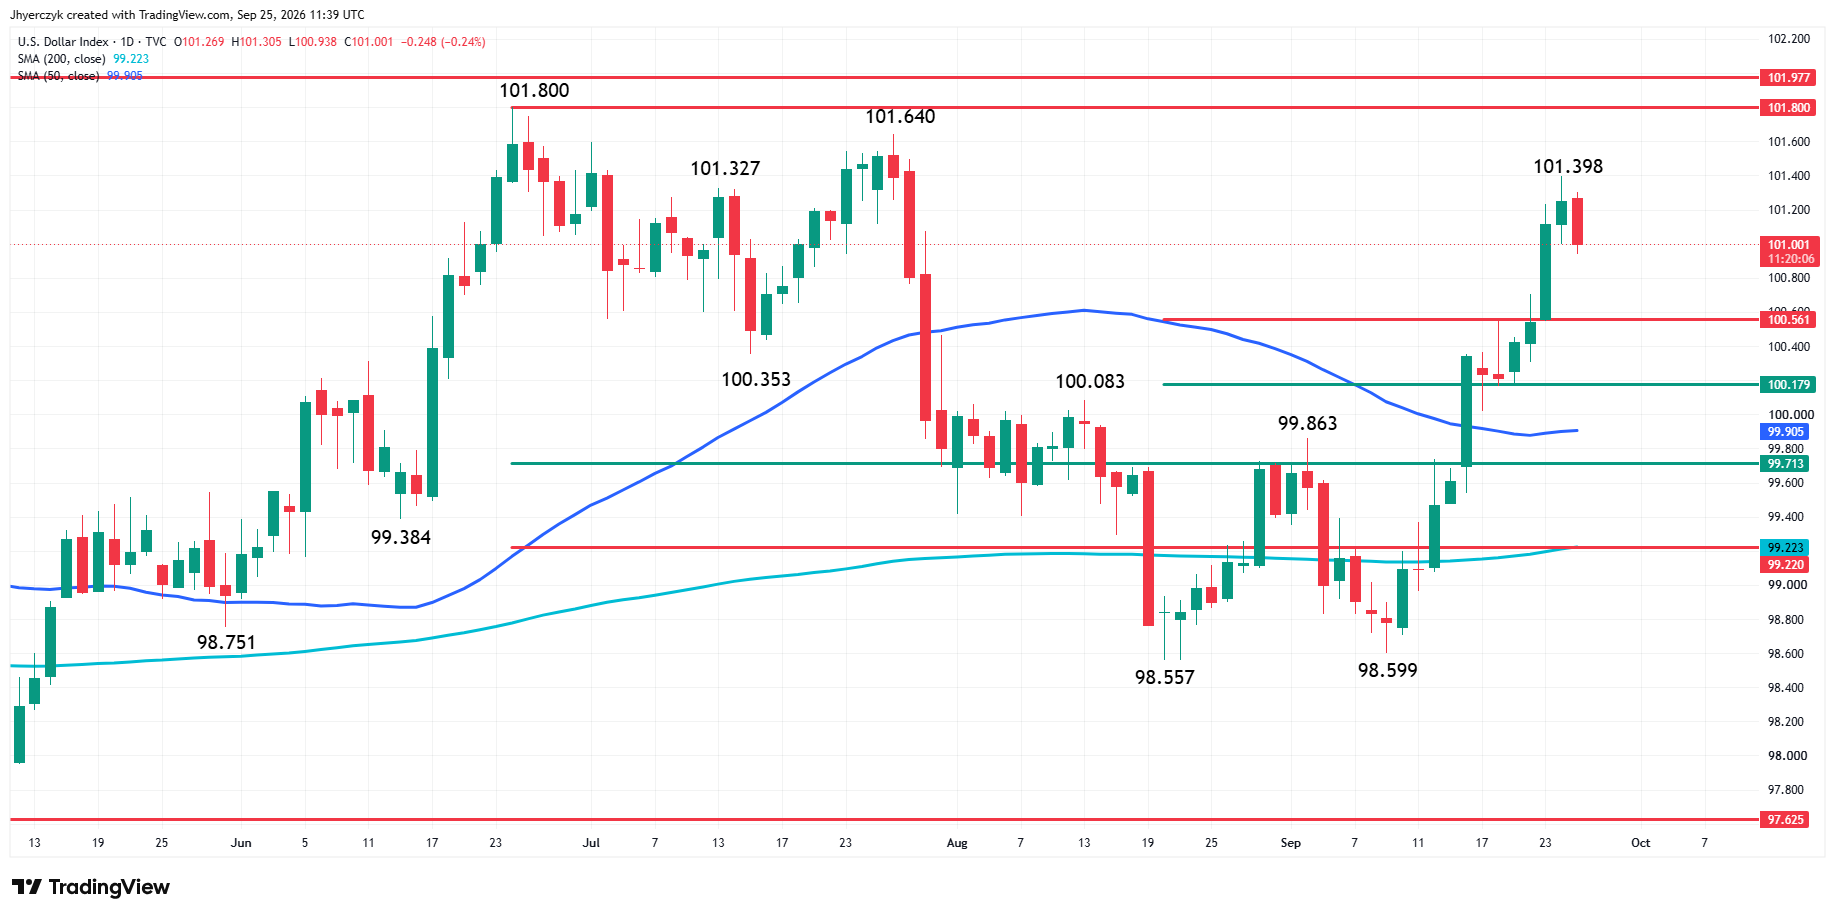
The U.S. Dollar Index is slightly lower near 101.20 Friday. It is still on track for its first back-to-back weekly gain in more than three months. The weekly edge belongs to the dollar and one softer session does not take it away.
Gold Price Forecast
Every new Gold analysis as it publishes, today's technical signal and key levels, live price — on one page.
See all Gold forecastsIndia’s physical gold demand improved modestly this week as lower prices attracted buyers ahead of the festive season. Central bank demand and fiscal concerns remain longer-term support for hard assets. Those are background factors. The immediate trade Friday morning is the direction of yields, the dollar, and crude. All three eased together and that is the entire reason gold is higher.
Friday’s Data Can Extend the Bounce or End It
The University of Michigan consumer-sentiment report and durable-goods orders are Friday’s data risks. The rate market has been responding to strong numbers all week. Wednesday’s PMI from S&P Global pushed the 10-year through 5%. October hike odds went from roughly 53% to 66% in two sessions.
Strong numbers Friday morning keep yields elevated and limit how far gold can extend the recovery. Softer data gives yields a reason to ease further and gold gets more room. The bond market is running the gold trade this week. Friday’s data either confirms the repricing or gives it a pause.
Daily Spot Gold (XAUUSD) Technical Analysis
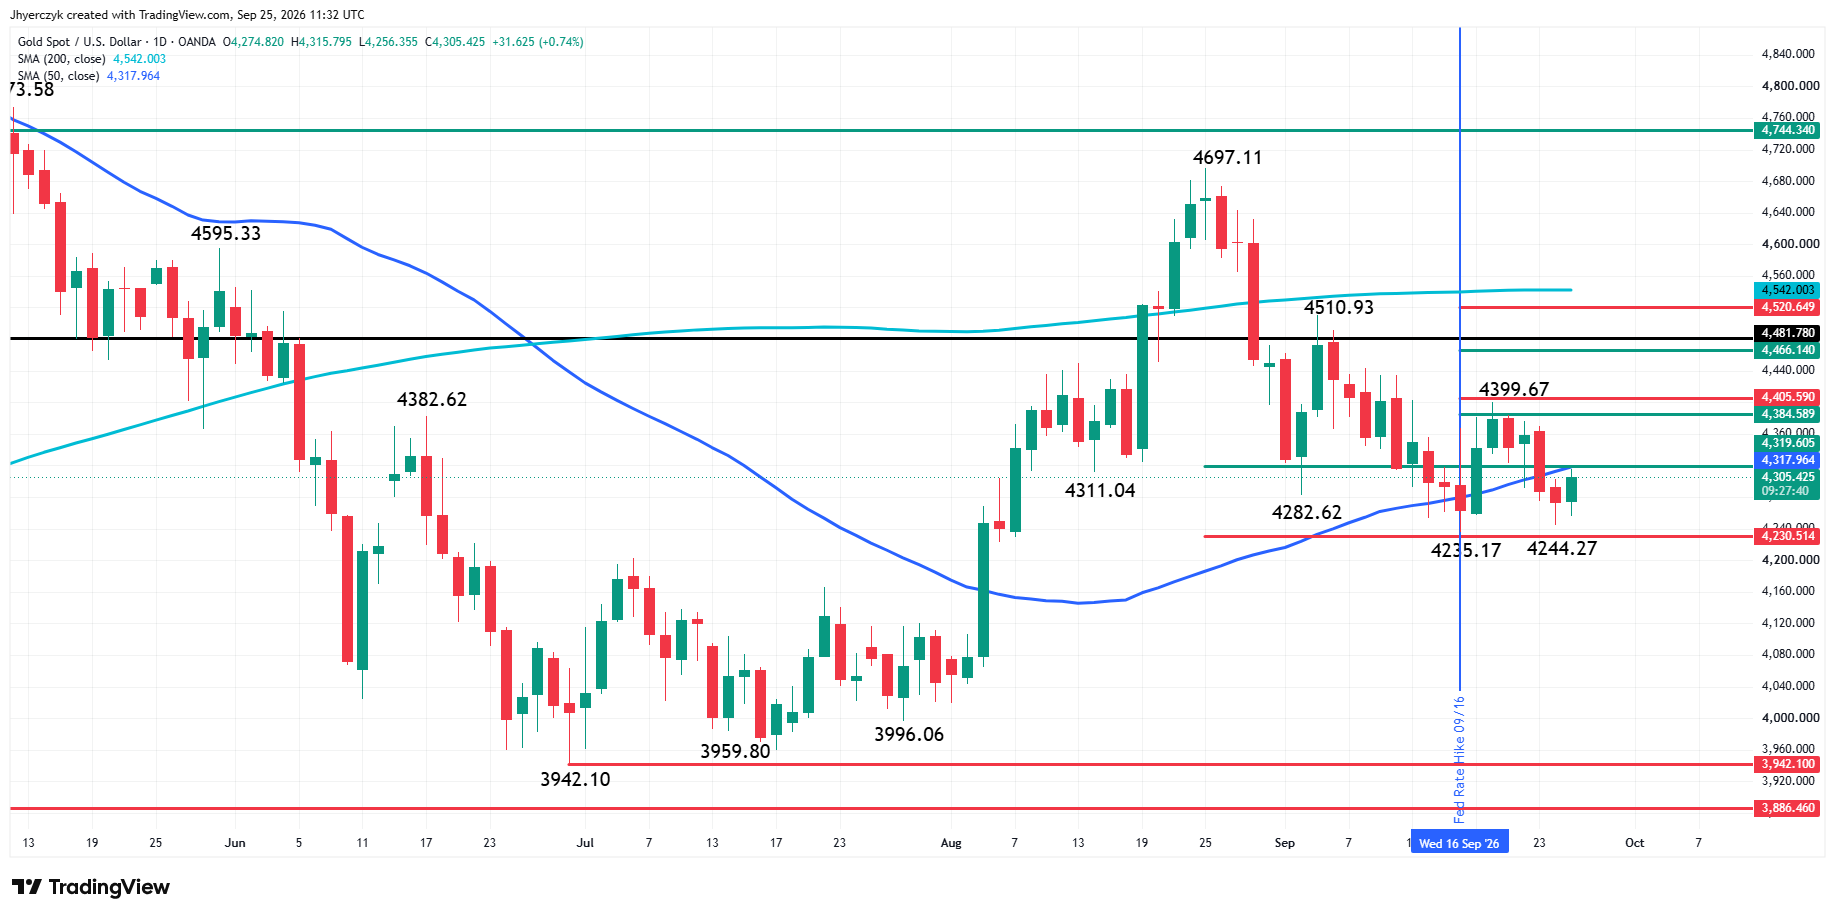
Spot Gold is edging higher early Friday after a successful test of the main bottom at $4,235.17, just above the short-term 61.8% support level at $4,230.51. Traders are now eyeing the resistance cluster formed by the 50-day moving average at $4,317.93 and the short-term 50% level at $4,319.61.
The main trend is down according to the daily swing chart. A trade through $4,235.17 will reaffirm the downtrend. The main trend will change to up on a trade through the last swing top at $4,399.67.
The major support zone is $4,319.61 to $4,230.51. It has been tested successfully three times since early September. The first resistance zone is $4,384.59 to $4,405.59. Sitting inside this zone is the main top at $4,399.67.
Trader reaction to the resistance cluster at $4,317.93 to $4,319.61 is likely to set the tone on Friday. A sustained move over $4,319.61 could generate the upside momentum needed to challenge $4,384.59 to $4,405.59. A sustained move under the 50-day MA would indicate that sellers are still in control with $4,230.51 the next potential target.
What to Watch
Gold has buyers after a third successful test of the support zone since early September. The 50-day at $4,317.93 and the 50% level at $4,319.61 are sitting directly above the market. That cluster is where Friday’s session gets decided.
The dollar eased Friday but is still up more than 1% for the week with back-to-back weekly gains. Treasury yields are off Thursday’s highs without reversing the move. Crude is lower on the Hormuz-talks headline. Gold is bouncing on the combination. University of Michigan and durable-goods data are the next inputs. The bond market has been repricing on strong numbers all week. Friday’s data tells the market whether the repricing continues or the week ends with a pause.
If you’d like to know more about how to trade gold, please visit our educational area.