



USOIL, UKOil & Natural Gas Outlook: Iran Truce Talks Ease Crude Risk as Saudi Attacks Keep Supply Fragile
Oil markets took a more balanced approach on Friday, with U.S. and Iranian diplomats working to end the seven-month old conflict. A resumption of Iranian shipments would release a significant amount of crude and other petroleum products. Keep in mind, crude and other petroleum products have been restricted on global markets since February, when the current disruptions began. If Iran reopens the Strait of Hormuz and the U.S. removes its sanctions and blockades on Iran, crude and other petroleum products would again be available on the global market.
Tehran and Washington are said to be considering a phased approach to the present restrictions. Negotiators are meeting in New York. In the meantime, Saudi Arabia has intercepted a total of six Houthi missiles since Thursday. One of the locations, Taif, is the site of a major oil processing facility and the other, Yanbu, is the terminus of the EAP (East-West) Pipeline of Saudi Arabia. Continued conflict is increasing the risk premium on crude and other petroleum products.
Ship-to-ship transfers off Oman are on the rise, and, according to Reuters sources, flows of Hormuz crude have almost completely recovered, reaching 6.5 million barrels a day in September. While the use of this workaround has increased, so have costs. Tanker freight on some routes out of the Gulf has been over $30 a barrel. The U.S. natural gas outlook is also softer, but the weather outlook is currently forecast for cooler temperatures. Recently, a resumption of storage injections has also signaled a return of summer demand for air conditioning. Elsewhere, particularly without Iranian exports, the natural gas market has even tighter fundamentals. The loss of about 36 million tons of LNG from the Middle East has meant even more gas supply has been taken off the market.
While many buyers are still looking to Russia, there has also been a shift to other exporting regions like North America, West Africa, Australia, and Indonesia.

Natural Gas Technical Analysis: NG Holds Above $3.15 as $3.24 Resistance Becomes the Immediate Test
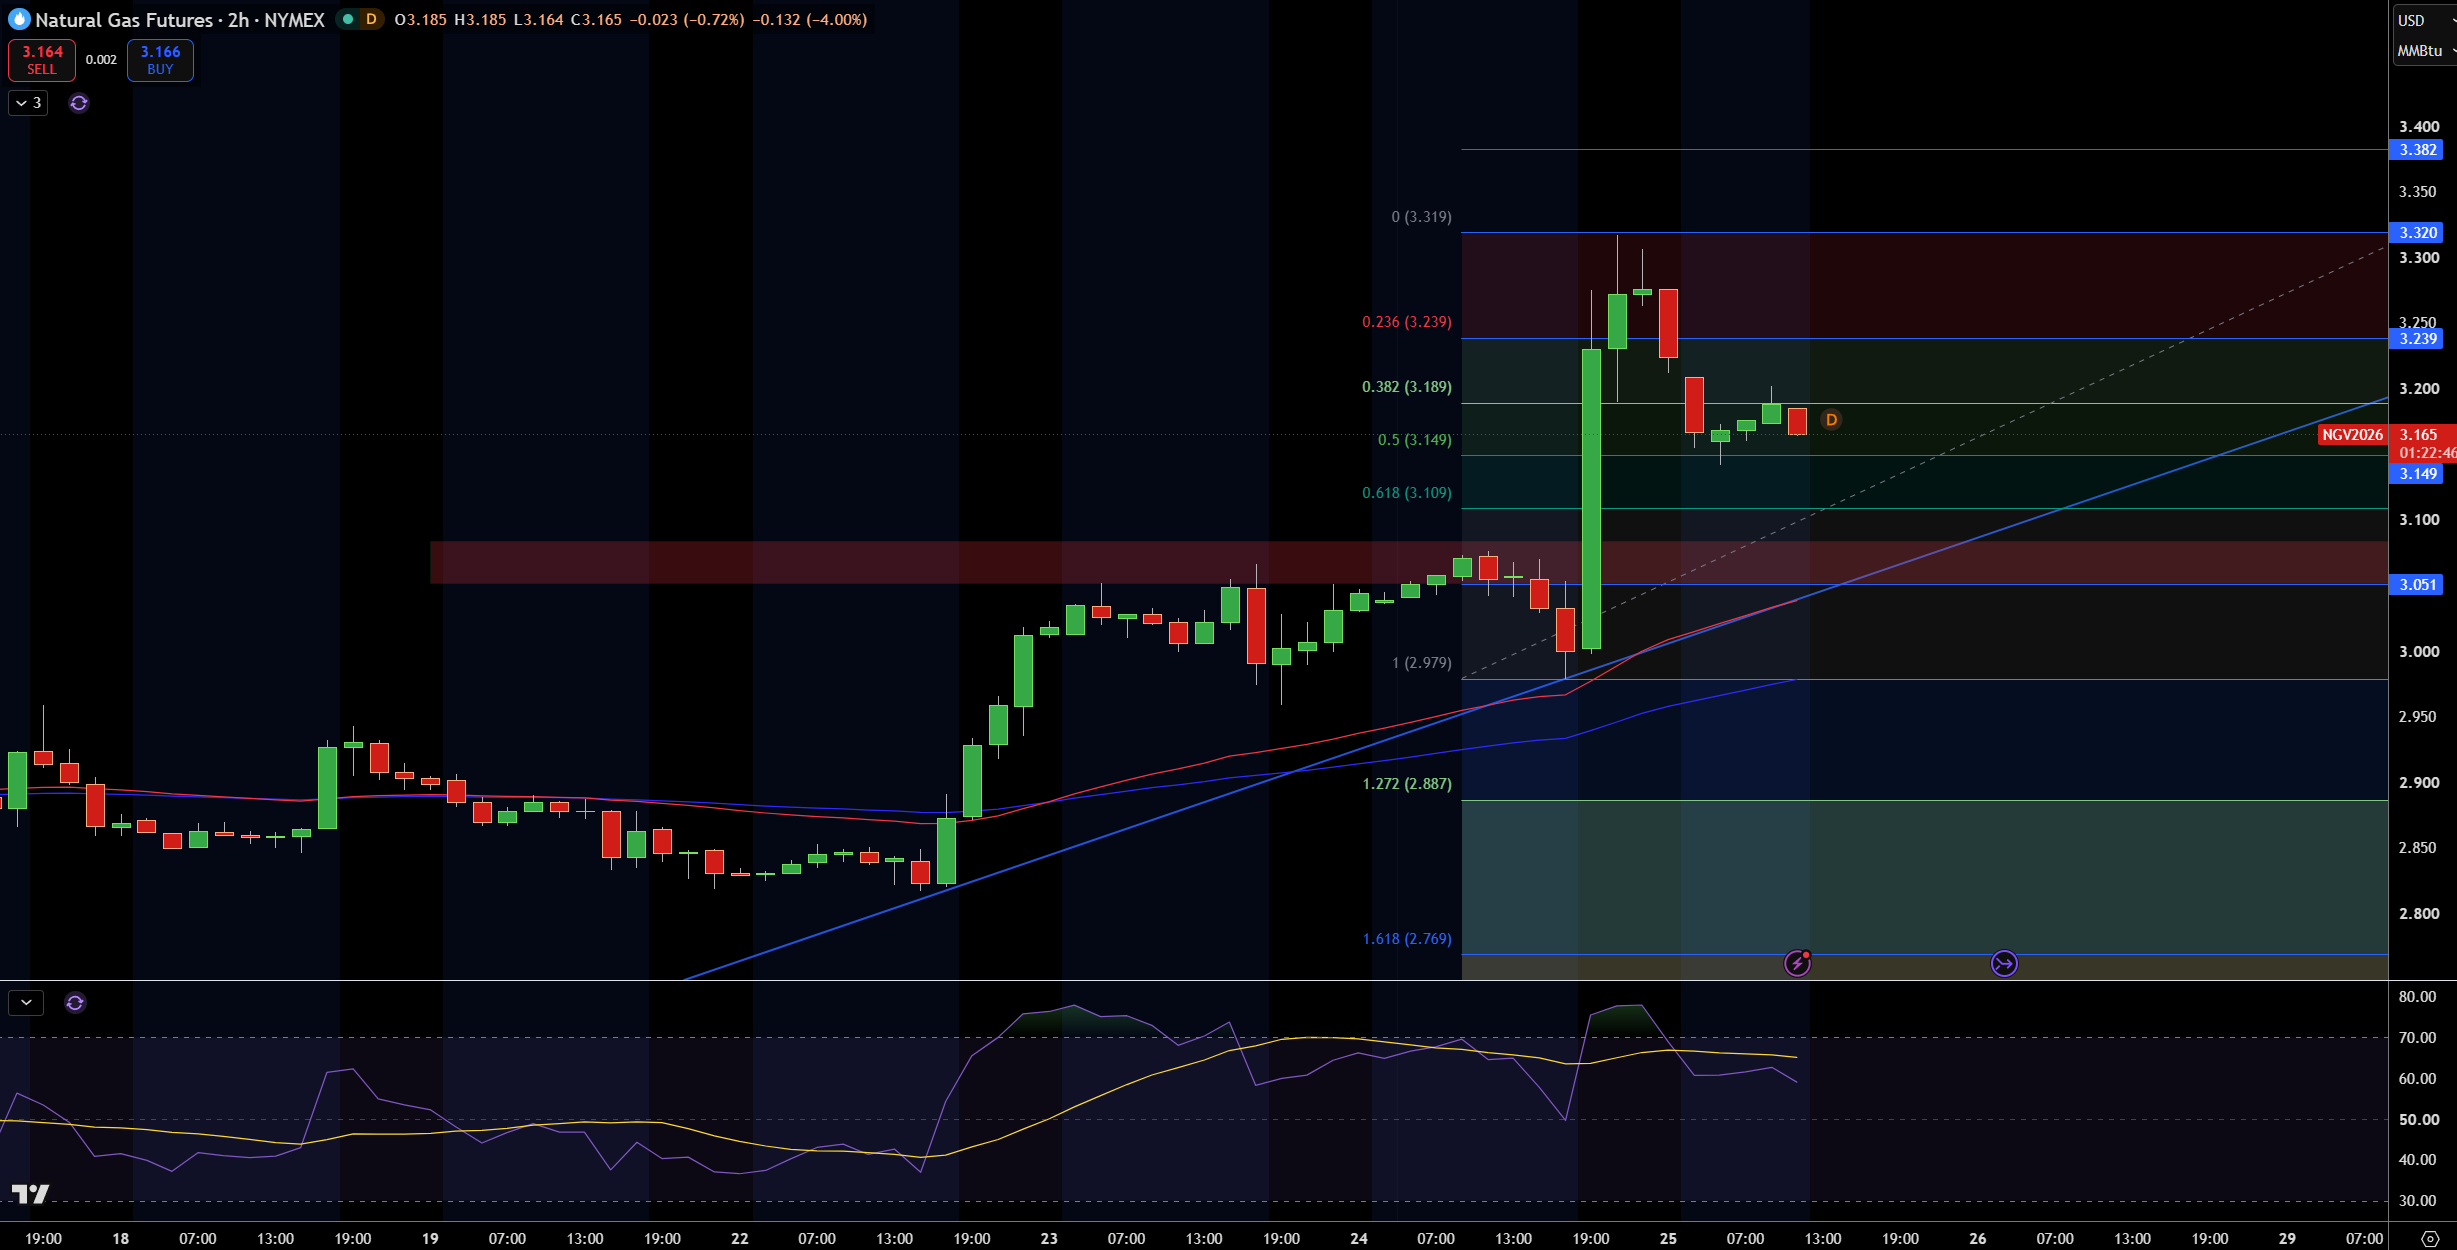
According to the 2-hour chart, natural gas is trading at $3.17. Recent price action has natural gas pulling back from $3.32. Natural gas is currently trading above $3.15, a key level of support, as well as both the moving averages.
The overall pattern is bullish and will remain bullish as long as price stays above $3.15. I am looking for price to reach $3.24 in the near-term. If $3.24 is broken to the upside, price action should target $3.32, $3.38. Support can be found at $3.15, $3.11, and $3.05.
The RSI has moved to a more neutral level from overbought, but is still bullish. As long as price remains above $3.15 I would agree with the bullish outlook. A break below $3.11 would be bullish. If price breaks above $3.24, $3.32 and $3.38 would be next.
Natural Gas Price Forecast
Every new Natural Gas analysis as it publishes, today's technical signal and key levels, live price — on one page.
See all Natural Gas forecastsWTI Crude Oil Technical Analysis: USOIL Holds $92.97 as $95.60 Resistance Caps the Recovery
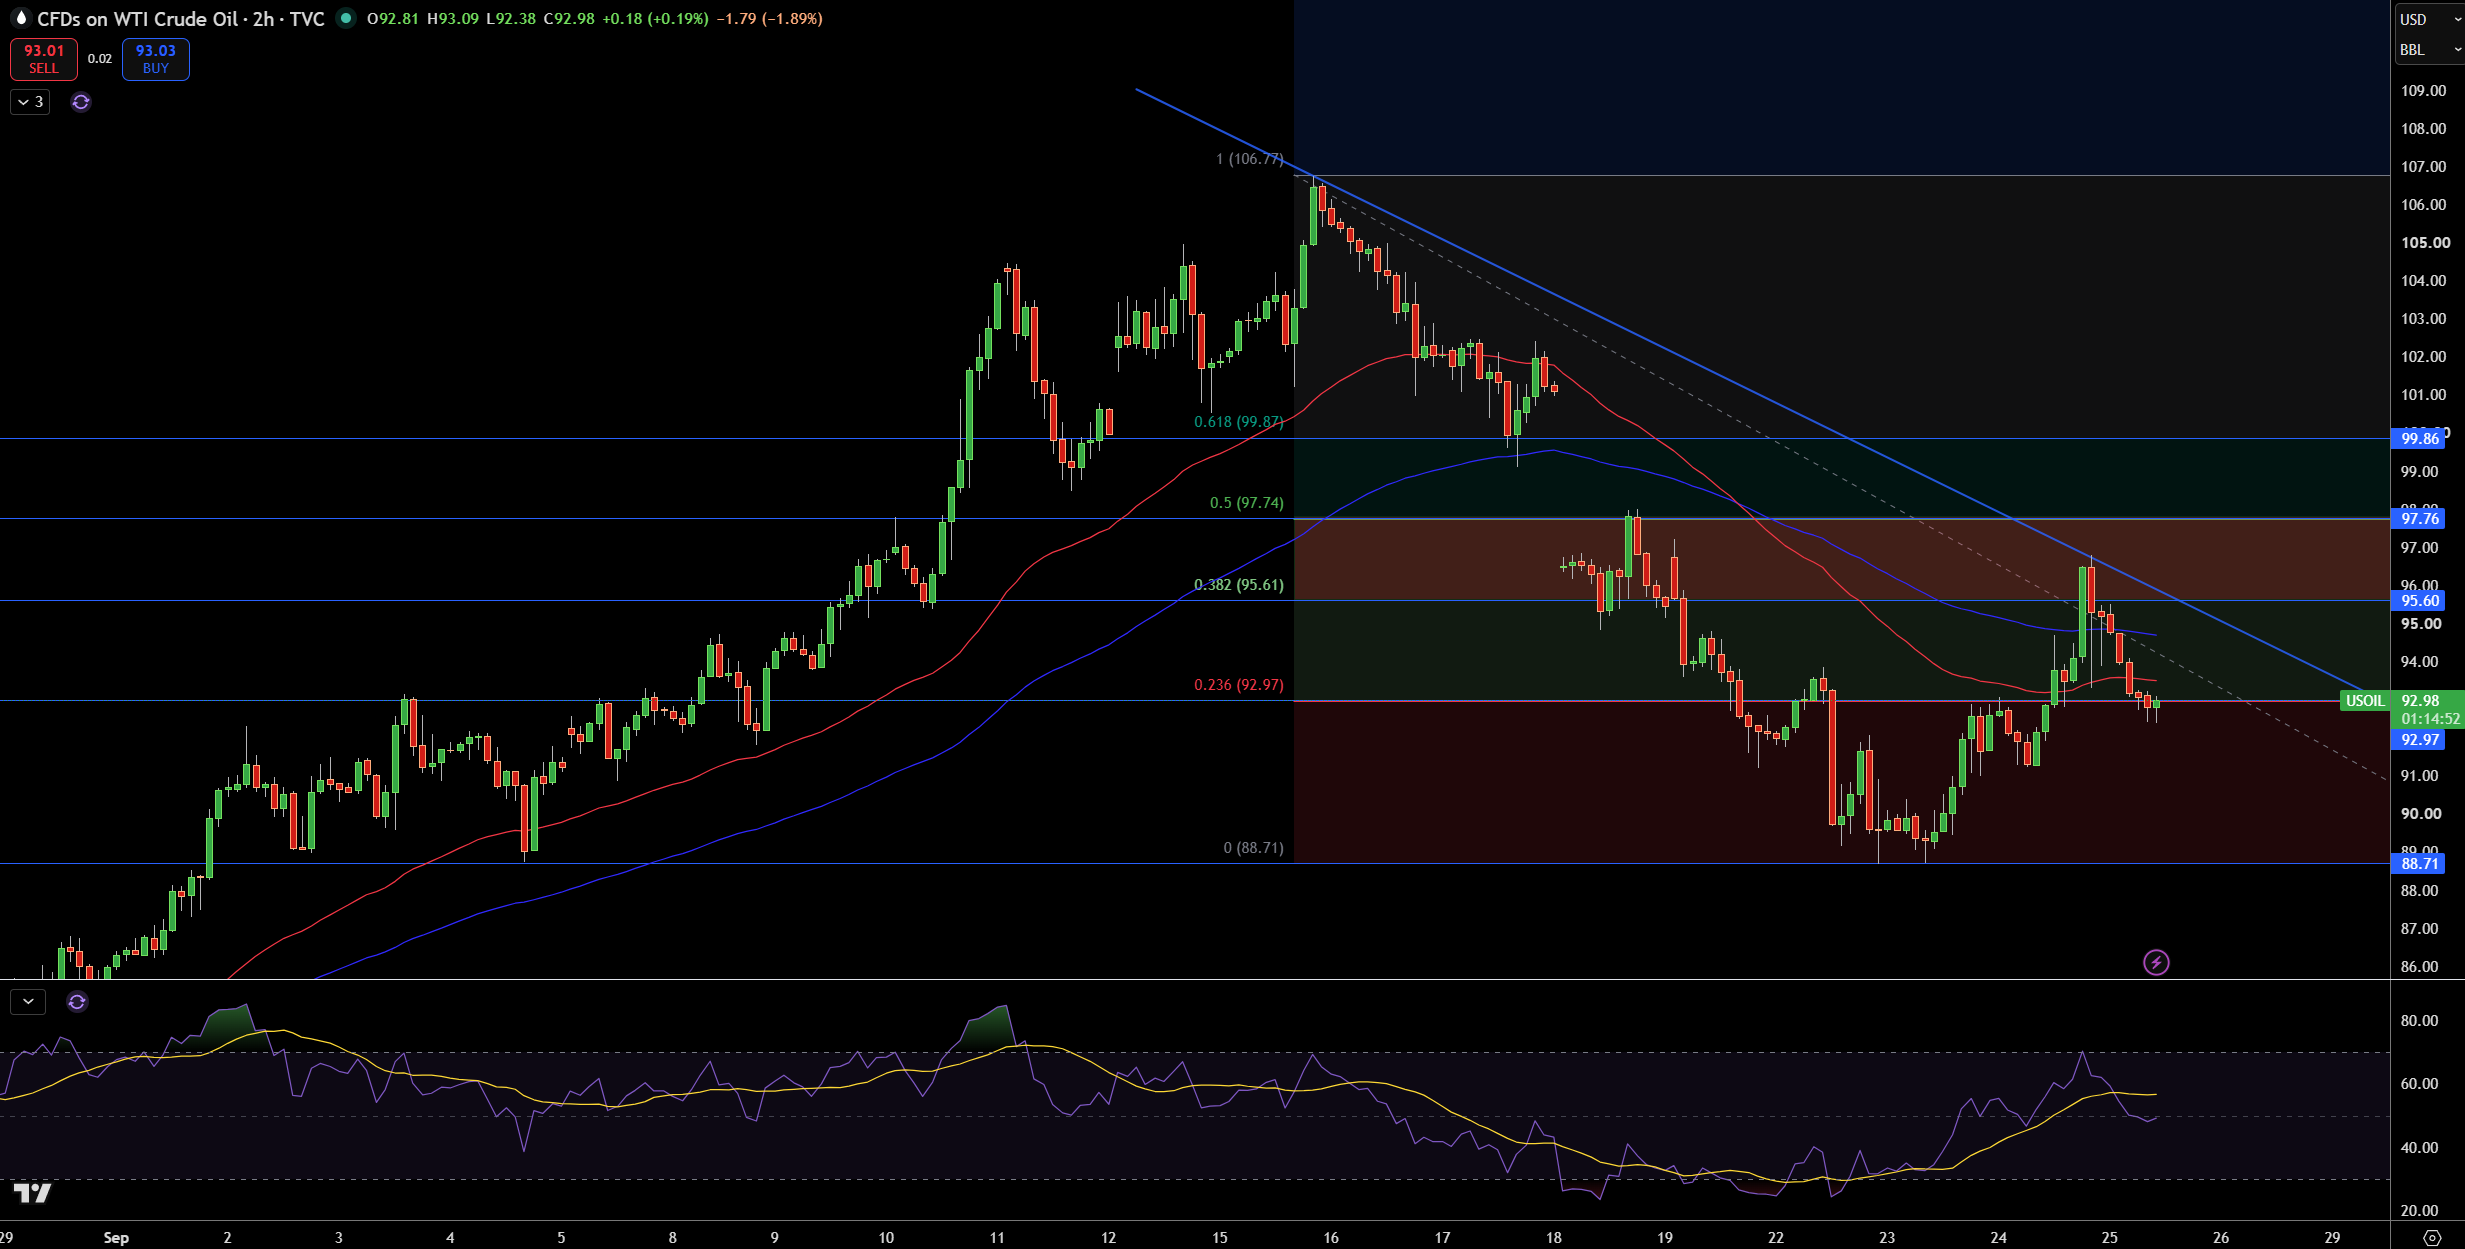
WTI is currently trading at $92.98, with the 2 hour chart showing price action touching the $92.97 fib support level. Price bounced from the moving average convergence/divergence (MACD) and the descending trend line. Price bounced from the trend line and MACD previously and fell lower. Price did not make a higher high and lower highs during the recent bounce and is currently trading within the lower highs and lower lows trend.
The upper trend line resistance comes in at $95.60. If price action falls from $95.60, $97.76 and $99.86 come into play to the downside. If price action breaks trend line and fib support at $92.97, $88.71 comes into play to the downside. MACD and price are currently showing a balance between the bulls and the bears. The recent bounce has WTI neutral to slightly bearish. I would become bullish if WTI broke and closed above $97.76. I would become bearish if WTI broke and closed below $92.97.
Brent Crude Oil Technical Analysis: UKOIL Holds $97.24 Trendline Support as $100.23 Becomes the First Recovery Test
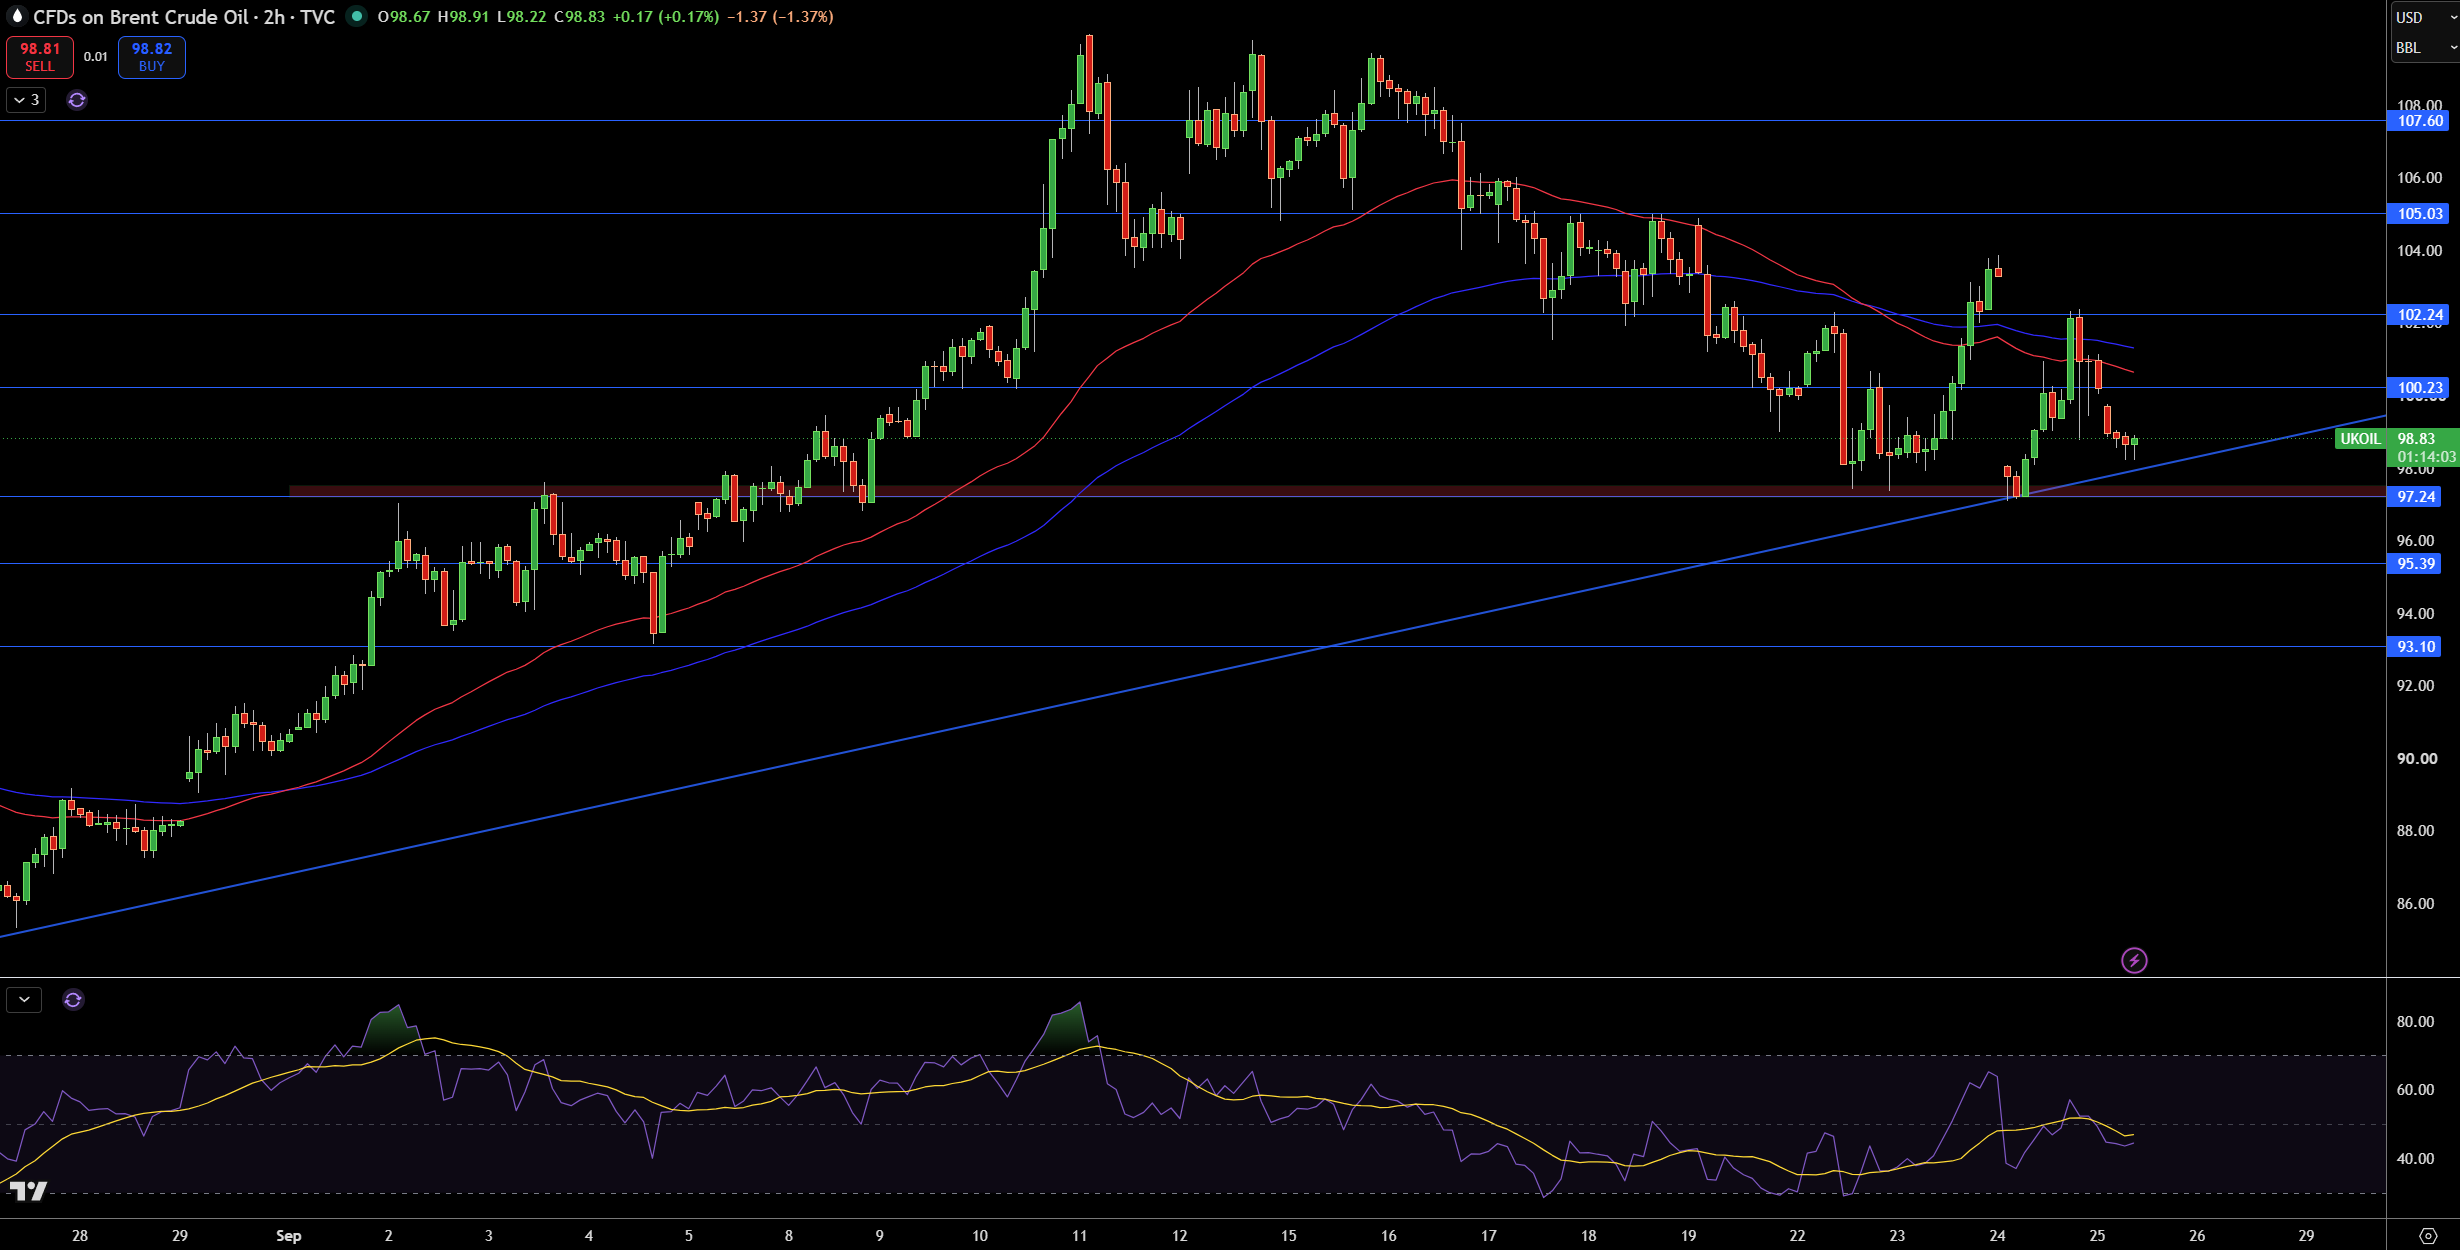
Brent crude oil is currently trading at 98.83. On the 2 hour chart it has pulled back and is now trading against the rising trend line and the support area of 97.24.I see that 97.24 has been a support area and has held despite many tests by the sellers, but it is still trapped in a lower high and above the 2 moving averages.The next resistance is expected at 100.23, above which further resistance is expected at 102.24 and 105.03.
The support areas are expected at 97.24 first, then at 95.39 and then at 93.10. The rising trend line is violated. The RSI is below the 50 line, but has a flat trend, indicating no clear trend in the market. I am neutral on Brent as long it trades between 97.24 and 100.23. I will change my view to bullish if it trades above 100.23. I will change to bearish and look for a move toward 95.39 if it trades below 97.24.


