Litecoin (LTC) could rally nearly 90% toward $135 if it confirms a breakout from a multi-year descending resistance trendline, with momentum improving sharply on the two-week chart.

LTC Tests Major Breakout Zone Near $80
Litecoin was trading near $71 on Sept. 25, up more than 30% from its recent low around $50.
The rebound has pushed LTC back above its 20-period exponential moving average (EMA), currently near $59, while bringing it directly into a major resistance cluster between roughly $72 and $80.
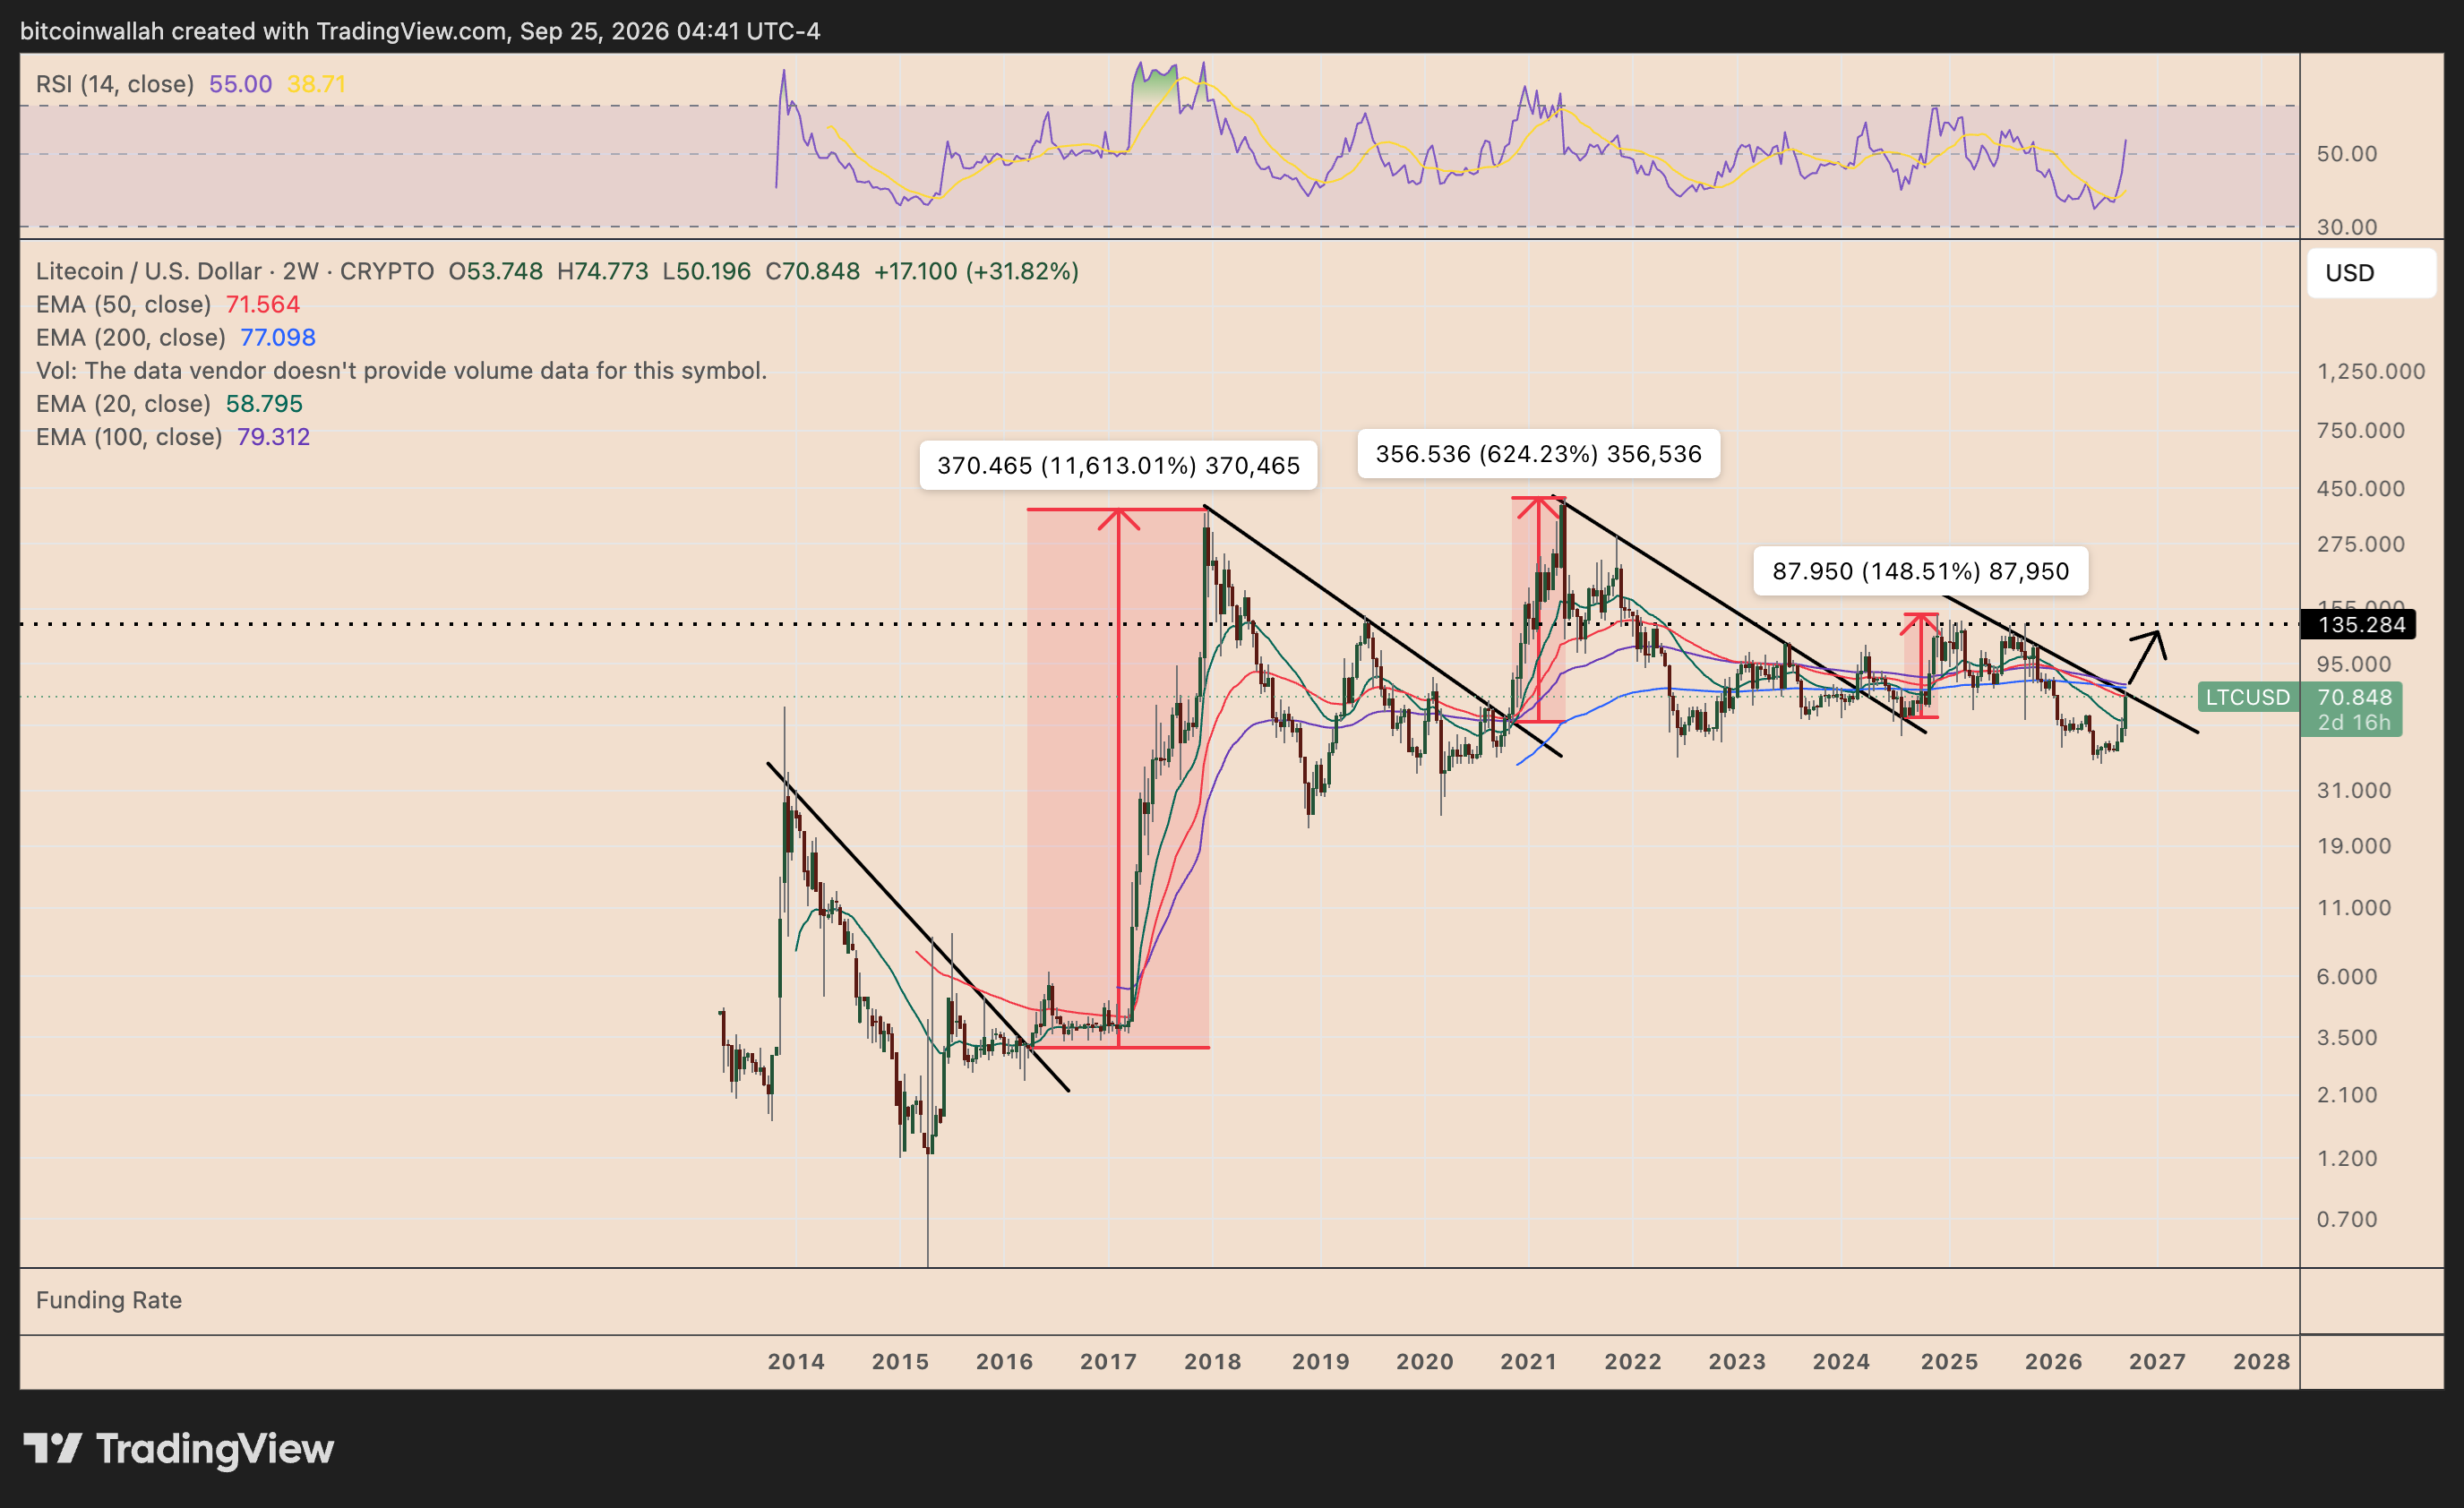
That area includes Litecoin’s 50-period EMA near $71.56, 200-period EMA around $77.10, and 100-period EMA near $79.31.
More importantly, the same zone overlaps with a descending trendline that has capped LTC’s upside attempts since its 2021 peak.
A decisive two-week close above $80 would break the long-term resistance structure while reclaiming several major moving averages.
That could open the door for an advance toward $95-$100 initially, followed by the broader $125-$135 resistance zone.
From the current price, a rally toward $135 would amount to gains of roughly 90%.
Litecoin’s Macro Fractal Favors $135
Litecoin’s broader chart also shows a recurring pattern of prolonged consolidation beneath descending resistance followed by explosive upside moves.
A similar structure preceded LTC’s massive 2017 rally, while another breakout cycle culminated in a roughly 624% advance into the 2021 market top.
More recently, Litecoin rallied approximately 148% during its 2024-2025 expansion phase.
Historical returns have clearly diminished with each cycle, making another multi-thousand-percent advance increasingly unrealistic. However, repeating even the magnitude of LTC’s latest major rally could push the cryptocurrency toward the $125-$135 area.
That target is particularly relevant because $135 also represents a major horizontal resistance level visible across Litecoin’s multi-year chart.
LTC’s two-week relative strength index (RSI) has rebounded to around 55, moving above the neutral 50 level without entering overbought territory. That suggests buyers are gaining control while leaving room for further upside.
Conversely, another rejection from the area could send LTC back toward its 20-period EMA near $59. A breakdown below the recent $50 low would weaken the broader bullish setup.