
Dollar Index Outlook: Surging Yields and Fed Hike Bets Strengthen Dollar as EUR and GBP Retreat
The U.S. dollar benefits from a strengthening fundamental edge over the euro and the British pound at the end of the week, widening the interest rate policy divergence in the process. The Dollar Index is poised to rise for a second straight week. Bonds around the world have sold off recently because of increasing concerns about inflation and government borrowing. U.S. economic activity has picked up. As a result, many expect the Fed to hike interest rates again this year. Fed officials have said that an interest rate hike this year is on the table. The yield on U.S. debt has increased and so has the dollar. The euro has moved in the opposite direction.
The U.S. dollar is anticipated to end the week higher against most currencies, extending its two-week winning streak. The ECB’s interest rate hike last week coupled with energy costs and inflation contributing to a tightening monetary policy have caused the EUR to weaken. Many expect the ECB to enact one or more interest rate increases in 2023. Meanwhile, the Bank of England, where interest rates are currently at 3.75%, is expected to increase rates in the next bank meeting. The GBP is expected to continue weakening with the EUR and USD.
Energy costs and inflation are likely to remain elevated in Britain. Falling wages and an anticipated recession from tighter monetary policy make an increase in interest rates less likely. The policies of the Middle East, particularly the reopening of the Hormuz strait, are expected to benefit all three countries by lowering energy costs and inflation. A greater focus is on the European Central Bank to ease monetary policy. Fundamental bias: DXY and EUR/GBP bearish.

U.S. Dollar Index Technical Analysis: DXY Holds 101.01 as 101.40 Resistance Caps the Advance
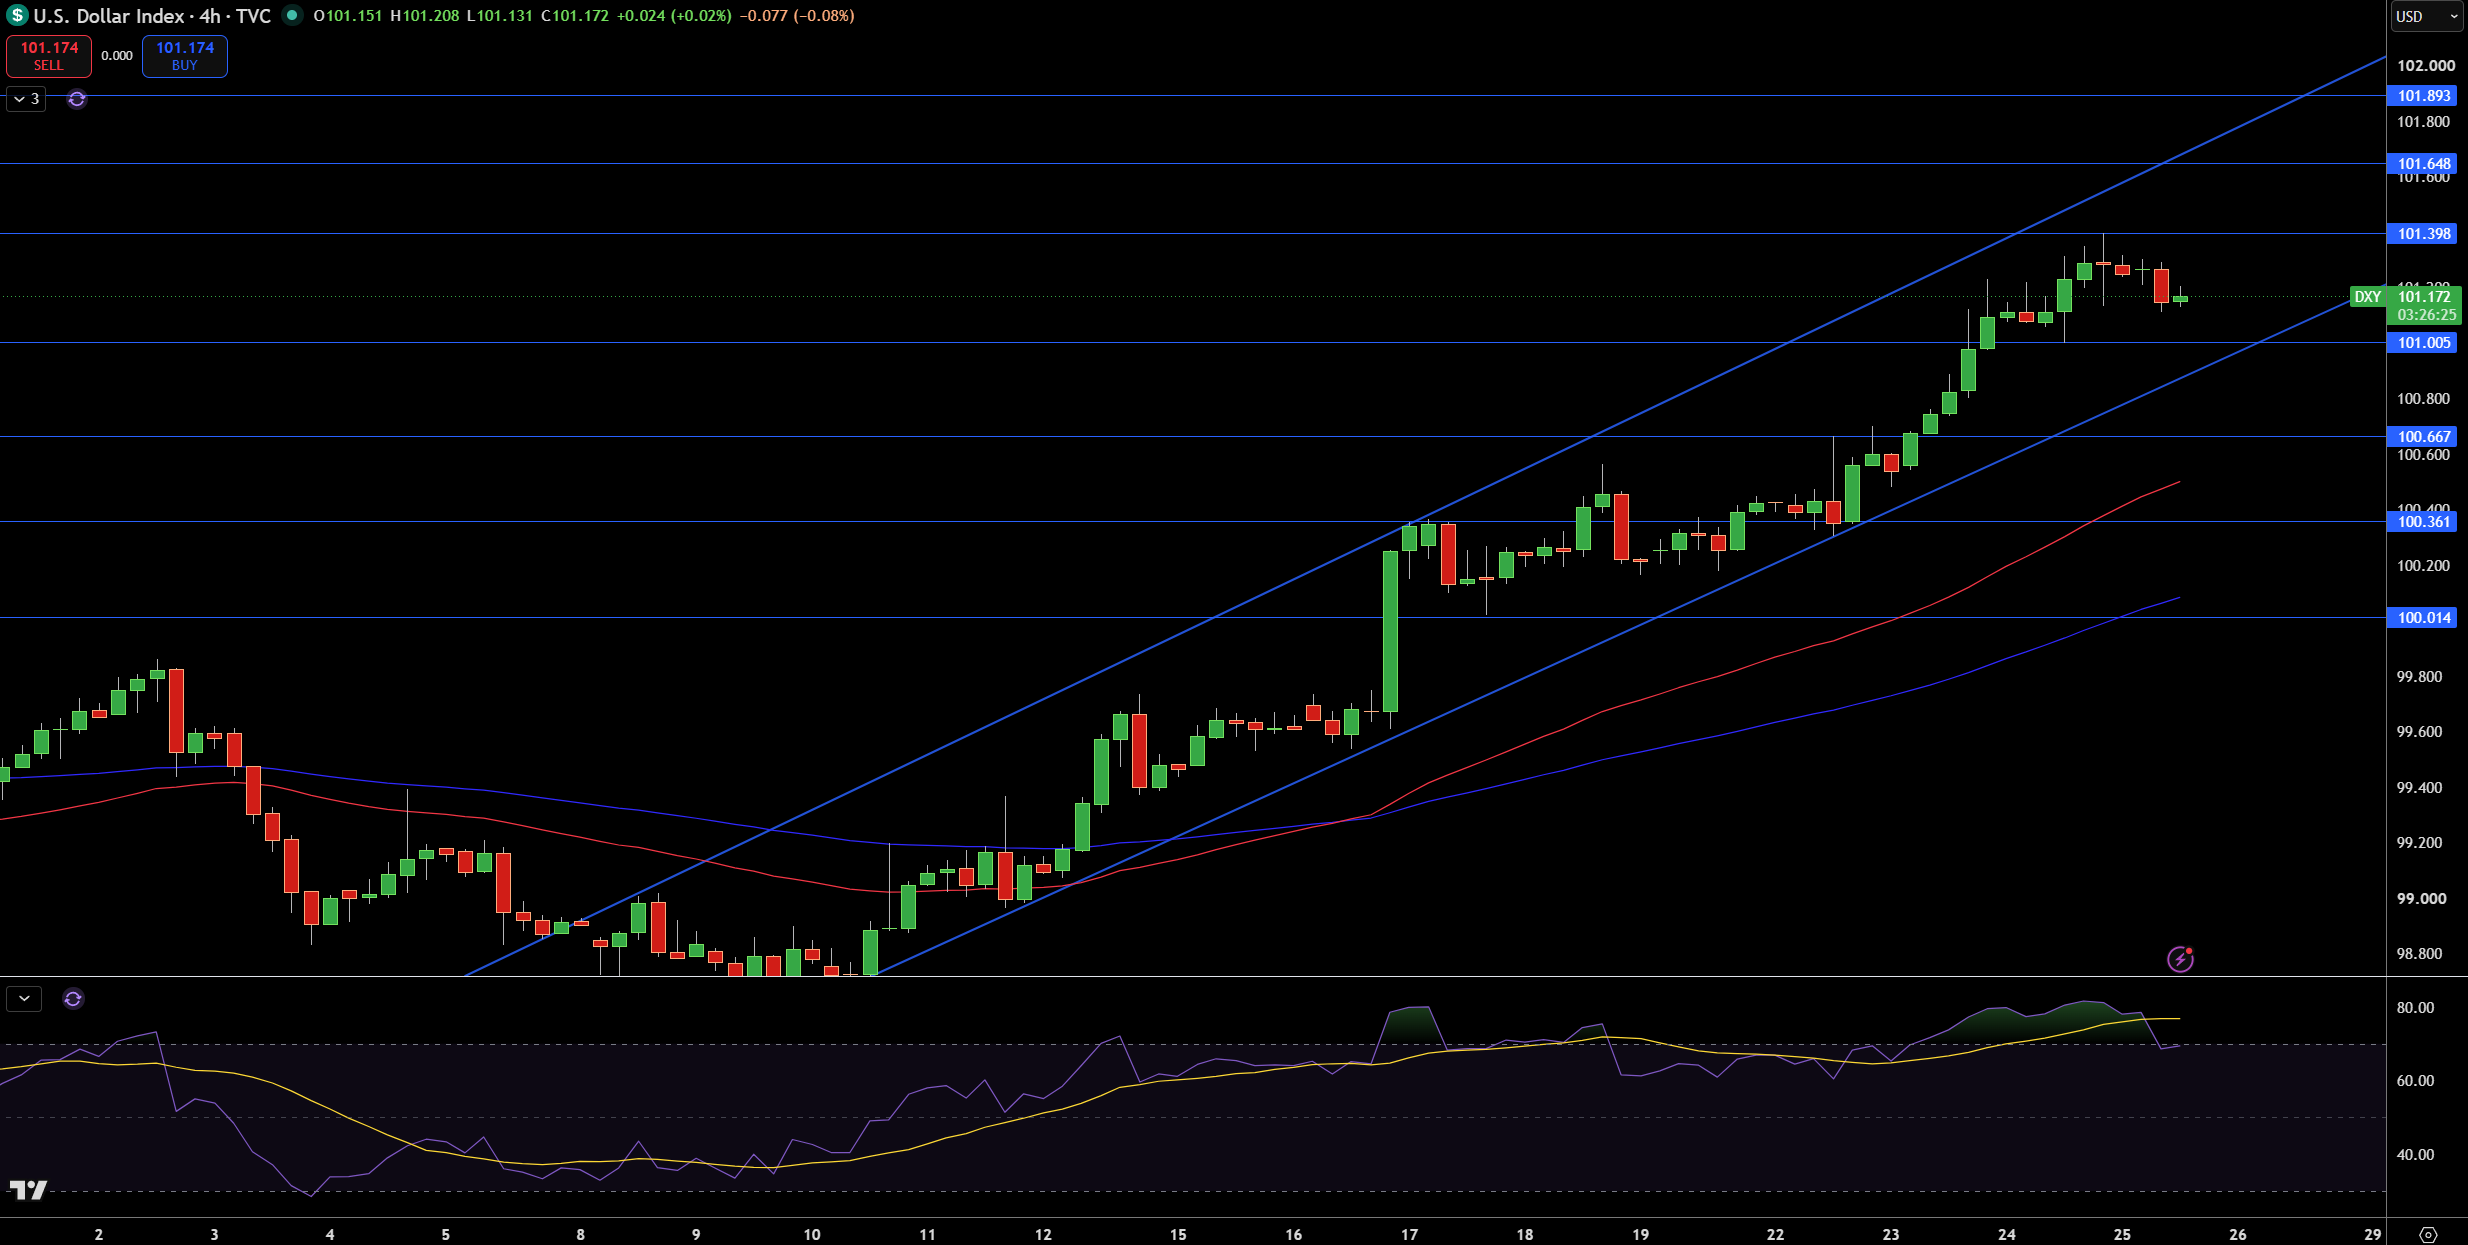
The US Dollar Index is currently trading at 101.17. The index is currently trending within a rising channel and above both of its moving averages. It is also currently ranging above the 101.01 support level, showing that the current bullish trend is still in place.
There is potential for the index to rise towards the 101.40 resistance level in the short term. A break above this level would potentially lead to an extended trend towards the 101.65 and 101.89 resistance levels.
There is potential for the bullish trend to continue as the RSI is currently indicating that the index is trending within overbought territory. Support levels can be found at 101.01, 100.67, and 100.36 in order from highest to lowest. A break below 101.01 would invalidate the bullish thesis.
The US Dollar Index is currently ranging above its rising trendline and 101.01, making a break below 100.67 unlikely in the short term. If 101.40 is broken to the upside, it is likely that 101.65 and 101.89 would be tested in the short term as well.
GBP/USD Technical Analysis: Sterling Holds 1.3205 as 1.3250 Resistance Becomes the First Recovery Test
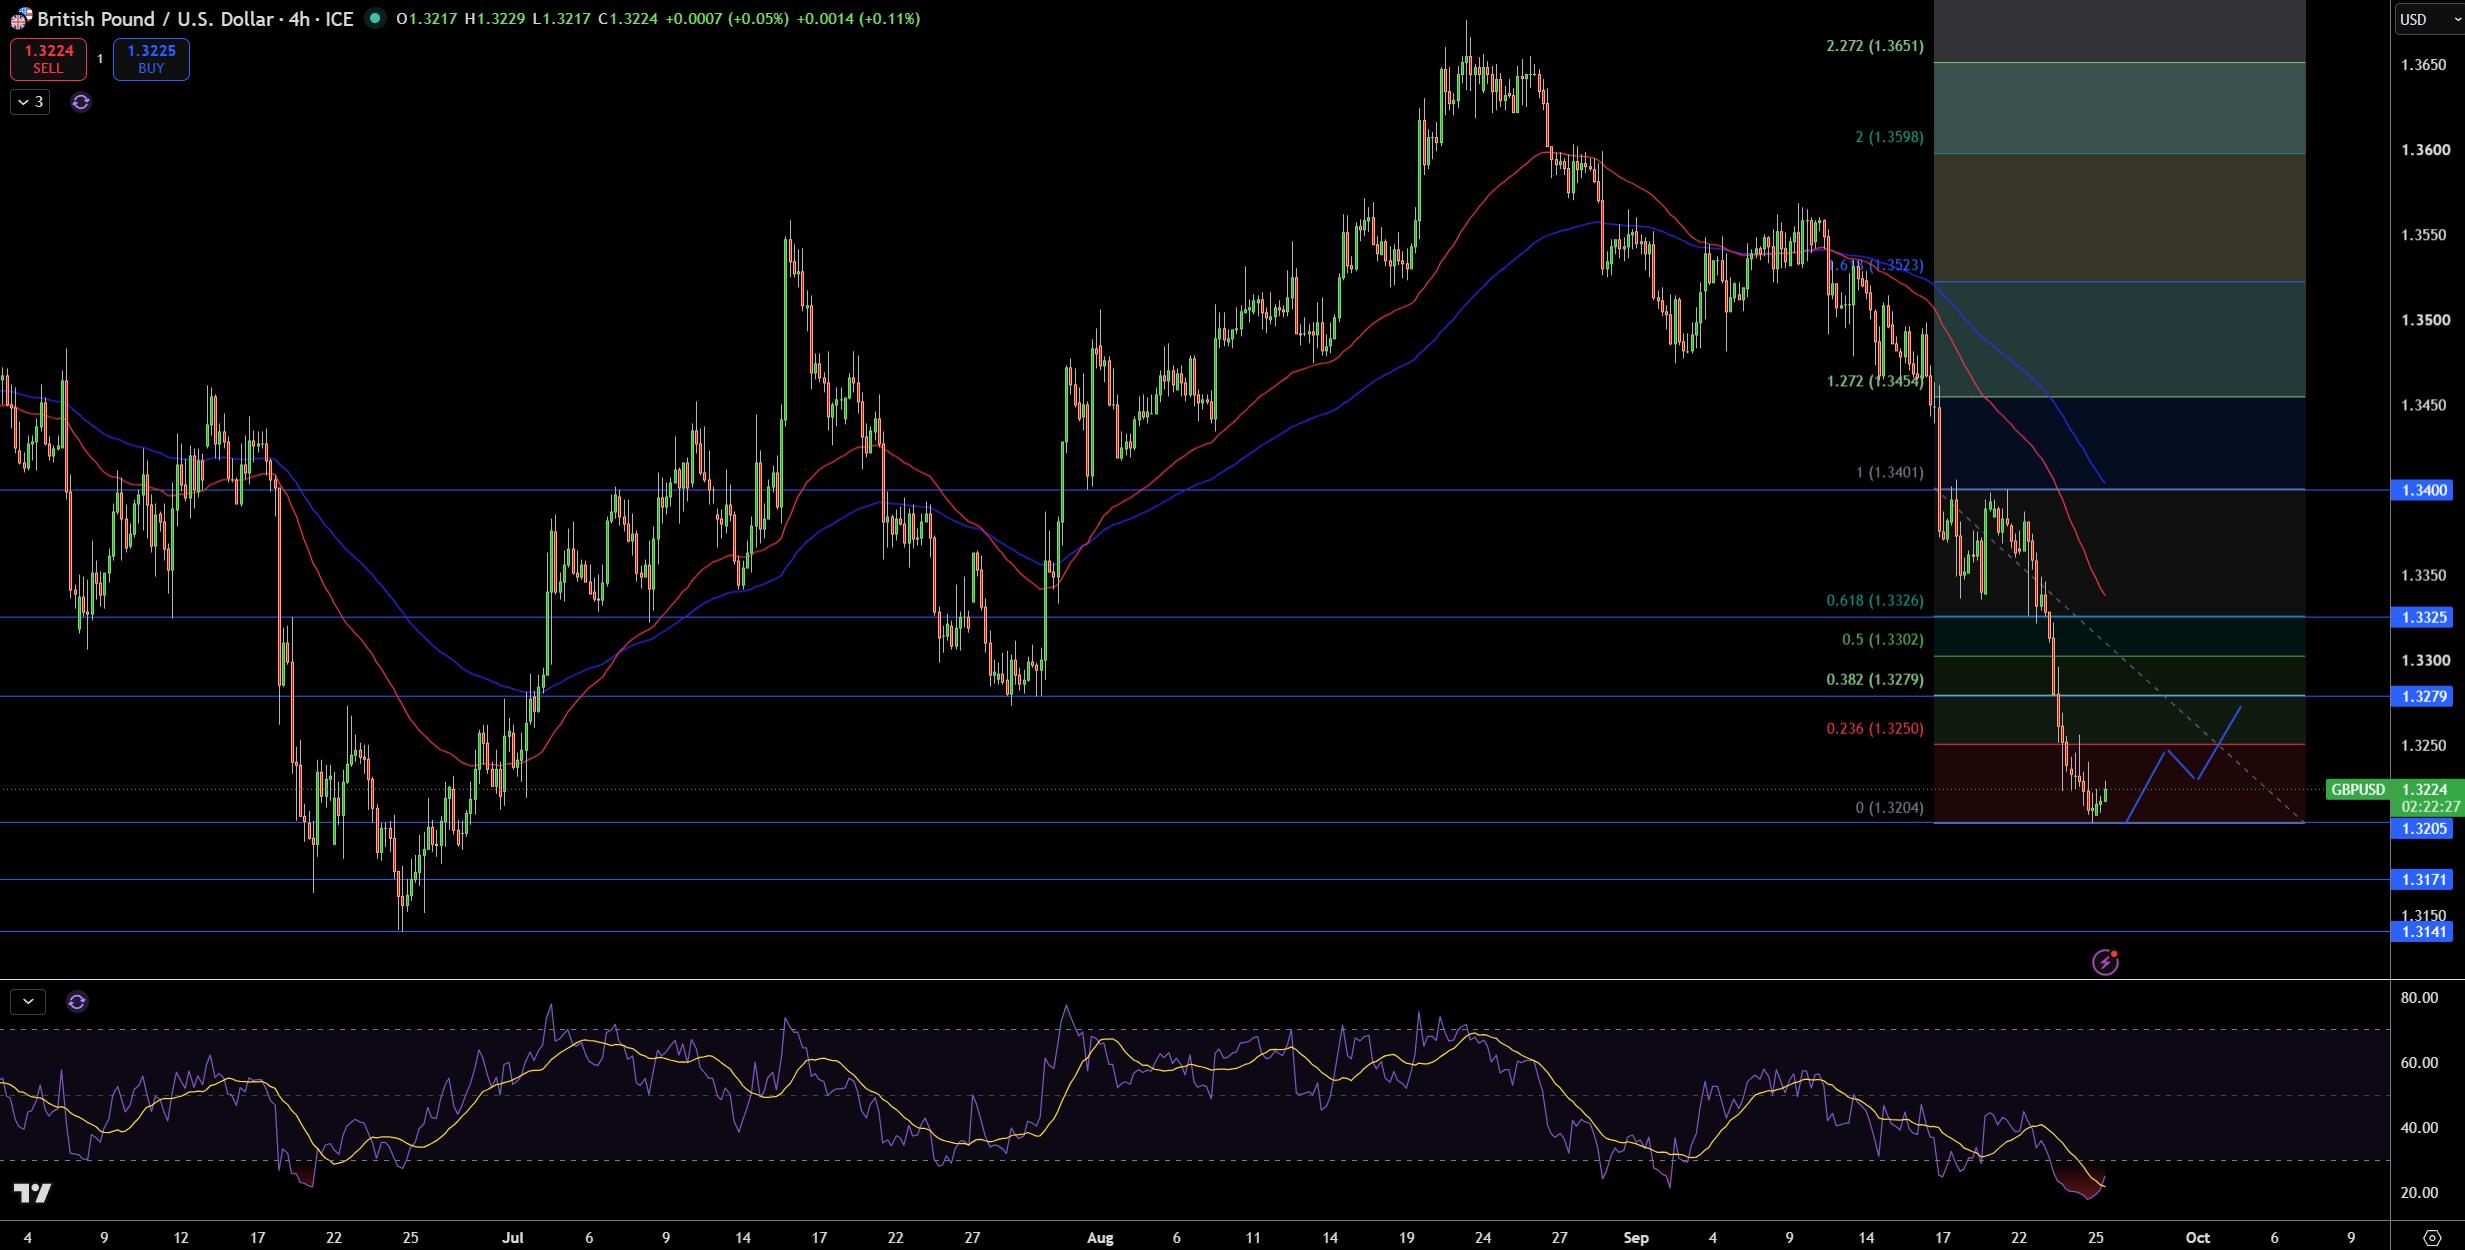
Currently, the GBP/USD pair is around 1.3224. It recently dropped from higher levels. I am focusing on the bearish trend, and the recent move lower, because the pair is trading well below both of the moving averages. I think the trend will remain lower until there is a move above the 50 SMA.
Moving on to areas of interest, 1.3250 is the first of the resistance levels. Above this level, additional resistance is located at 1.3279 and 1.3302. On the other end of the trade, 1.3205 is the first support, and below this, support is located at 1.3171 and 1.3141.
I think the RSI is still slightly oversold. Because of this, a minor bounce is likely. If the pair is to bounce, I expect 1.3250 to provide resistance. I expect a bearish continuation of the trend and believe that 1.3279 will provide resistance, with 1.3302 and 1.3325 providing additional resistance. A break of 1.3205 would open the 1.3171 and 1.3141 support levels.
EUR/USD Technical Analysis: Euro Tests 1.1366 Support as 1.1458 Remains the Recovery Hurdle
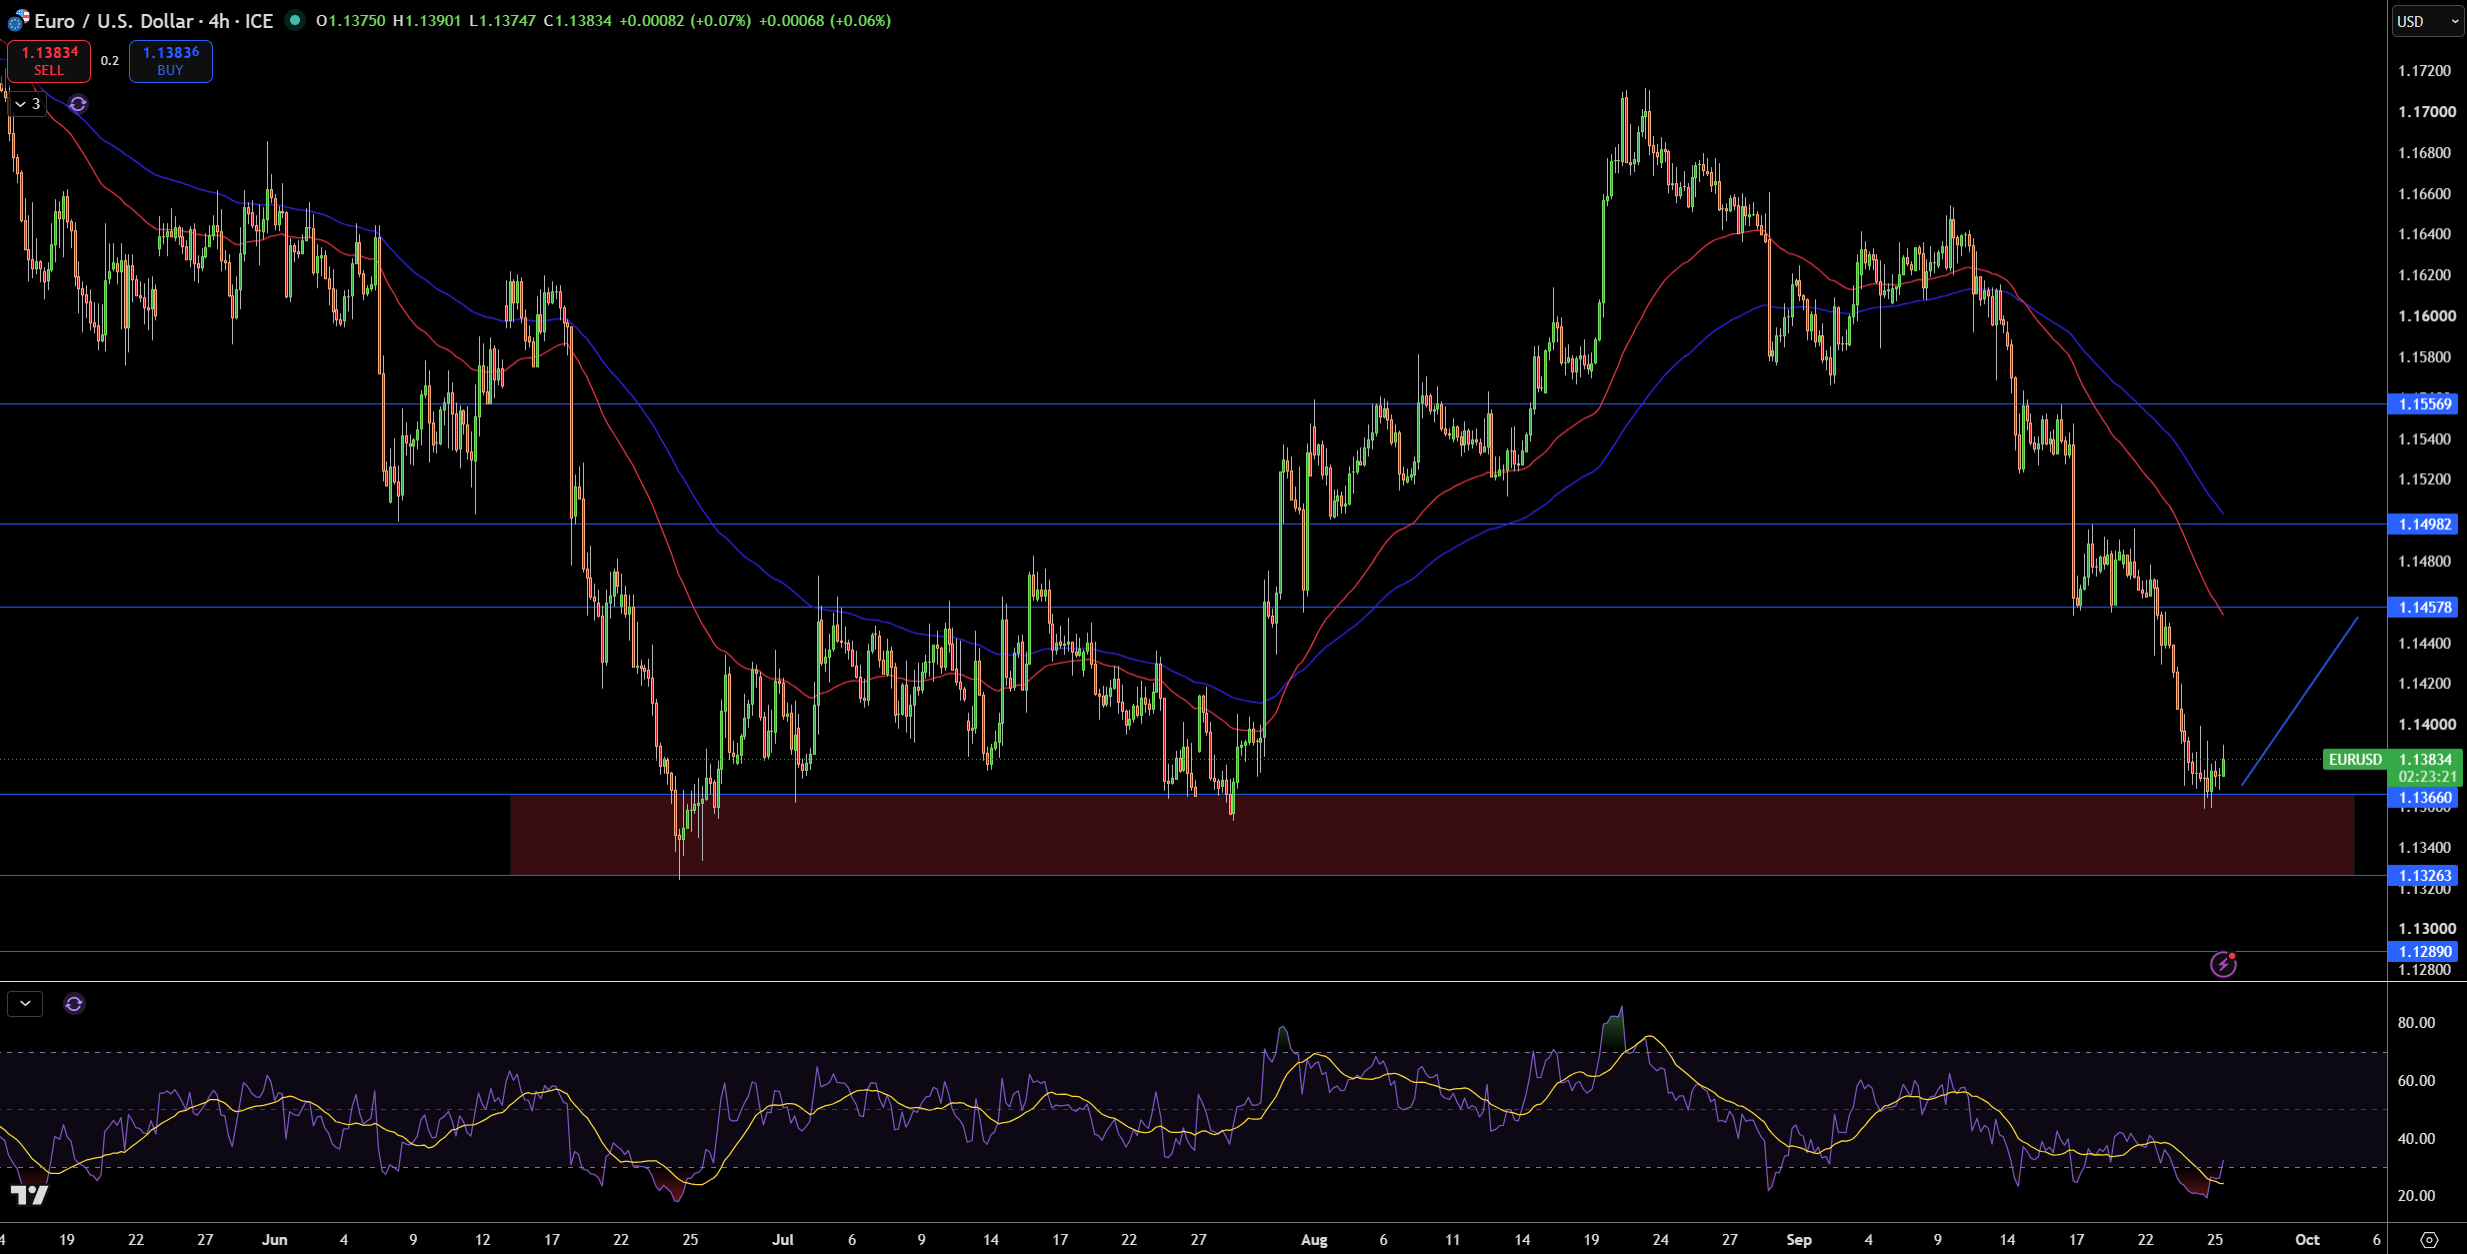
The EUR/USD pair dropped down to the 1.1366 support and is currently trading at 1.1383. Price is also below both moving averages and is trading in a lower highs trend. Additionally, multiple attempts to pull back have been sold down. The recent bounce from the 1.1366 level is not enough to change the larger trend and therefore, stays in line with the larger bearish trend.
In the bigger picture, 1.1326 and 1.1289 are the next key levels to the south. Resistance is first seen at 1.1458, with 1.1498 and 1.1557 located above that.
RSI is also at levels that indicate a possible reversal, however, a bounce from over sold territory is more likely. Therefore, the outlook remains bearish and a move below 1.1366 will most likely be followed by a move to the 1.1326 level. Conversely, a move above the 100 SMA and 200 SMA at 1.1498 will change the trend to bullish.