Chainlink (LINK) is beginning to validate the bullish accumulation setup I highlighted in August, with its latest breakout bringing the $18-$18.60 resistance zone back into focus.

LINK Breakout Confirms August Accumulation Thesis
LINK was trading near $13.56 on Sept. 25, extending its recovery from the roughly $8 area seen in early August.
In my Aug. 5 Chainlink analysis, I identified the $7.01-$9.48 region as a major accumulation zone, noting that the same area had preceded LINK’s roughly 550% rally during the previous cycle.
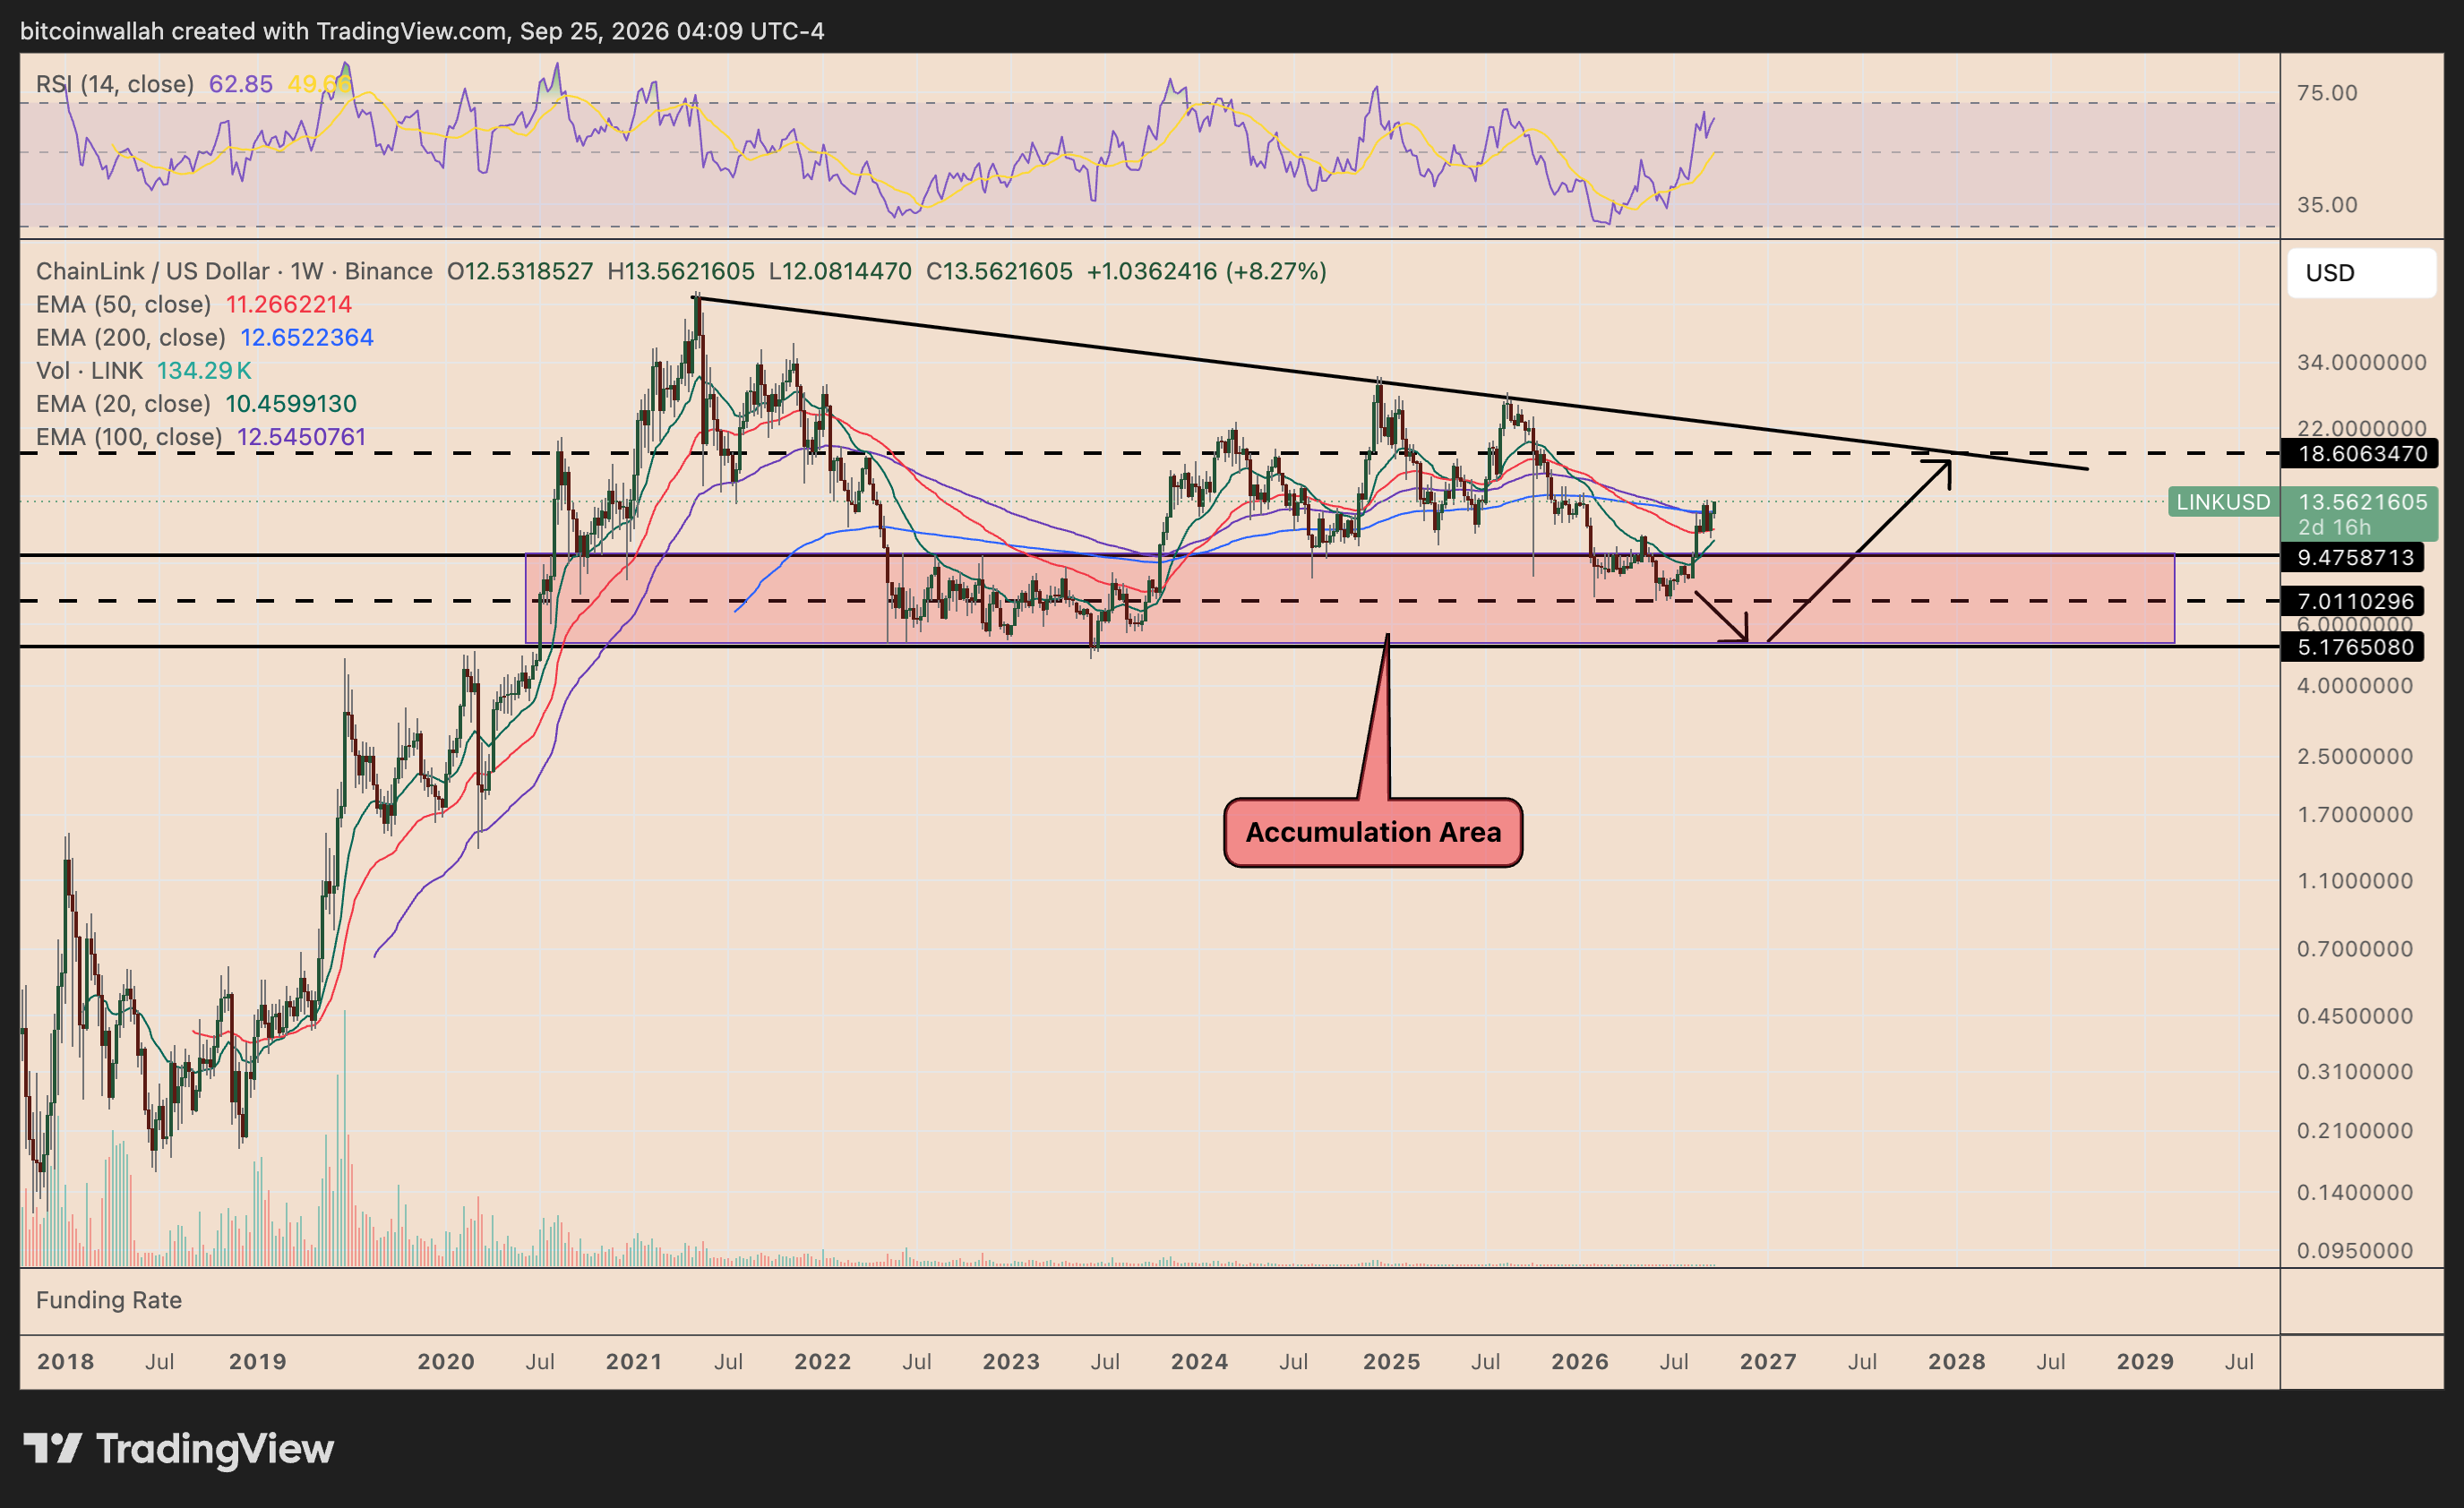
At the time, LINK was trading near $8.15. The bullish scenario required the token to reclaim $9.48, then break above a cluster of long-term exponential moving averages, before targeting the broader $15-$18.60 resistance region, up 35% from current levels.
That setup is now progressing.
On the weekly chart, LINK has moved above its 20-week EMA (green) near $10.46, 50-week EMA (red) near $11.27, 100-week EMA (purple) near $12.55, and 200-week EMA (blue) around $12.65.
Holding above this EMA cluster strengthens the case that the August lows marked a broader accumulation phase rather than the start of another sustained downtrend.
The weekly relative strength index (RSI) has also climbed toward 63, showing improving momentum without yet entering overbought territory above 70.
LINK Cup-and-Handle Breakout Targets $16.80
The four-hour chart now shows a cup-and-handle setup, adding a shorter-term bullish catalyst to Chainlink’s broader recovery.
The “cup” developed after LINK fell from around $13.30 in early September to roughly $10.50 before recovering back toward the same resistance area. Price then entered a brief downward-sloping consolidation, forming the “handle.”
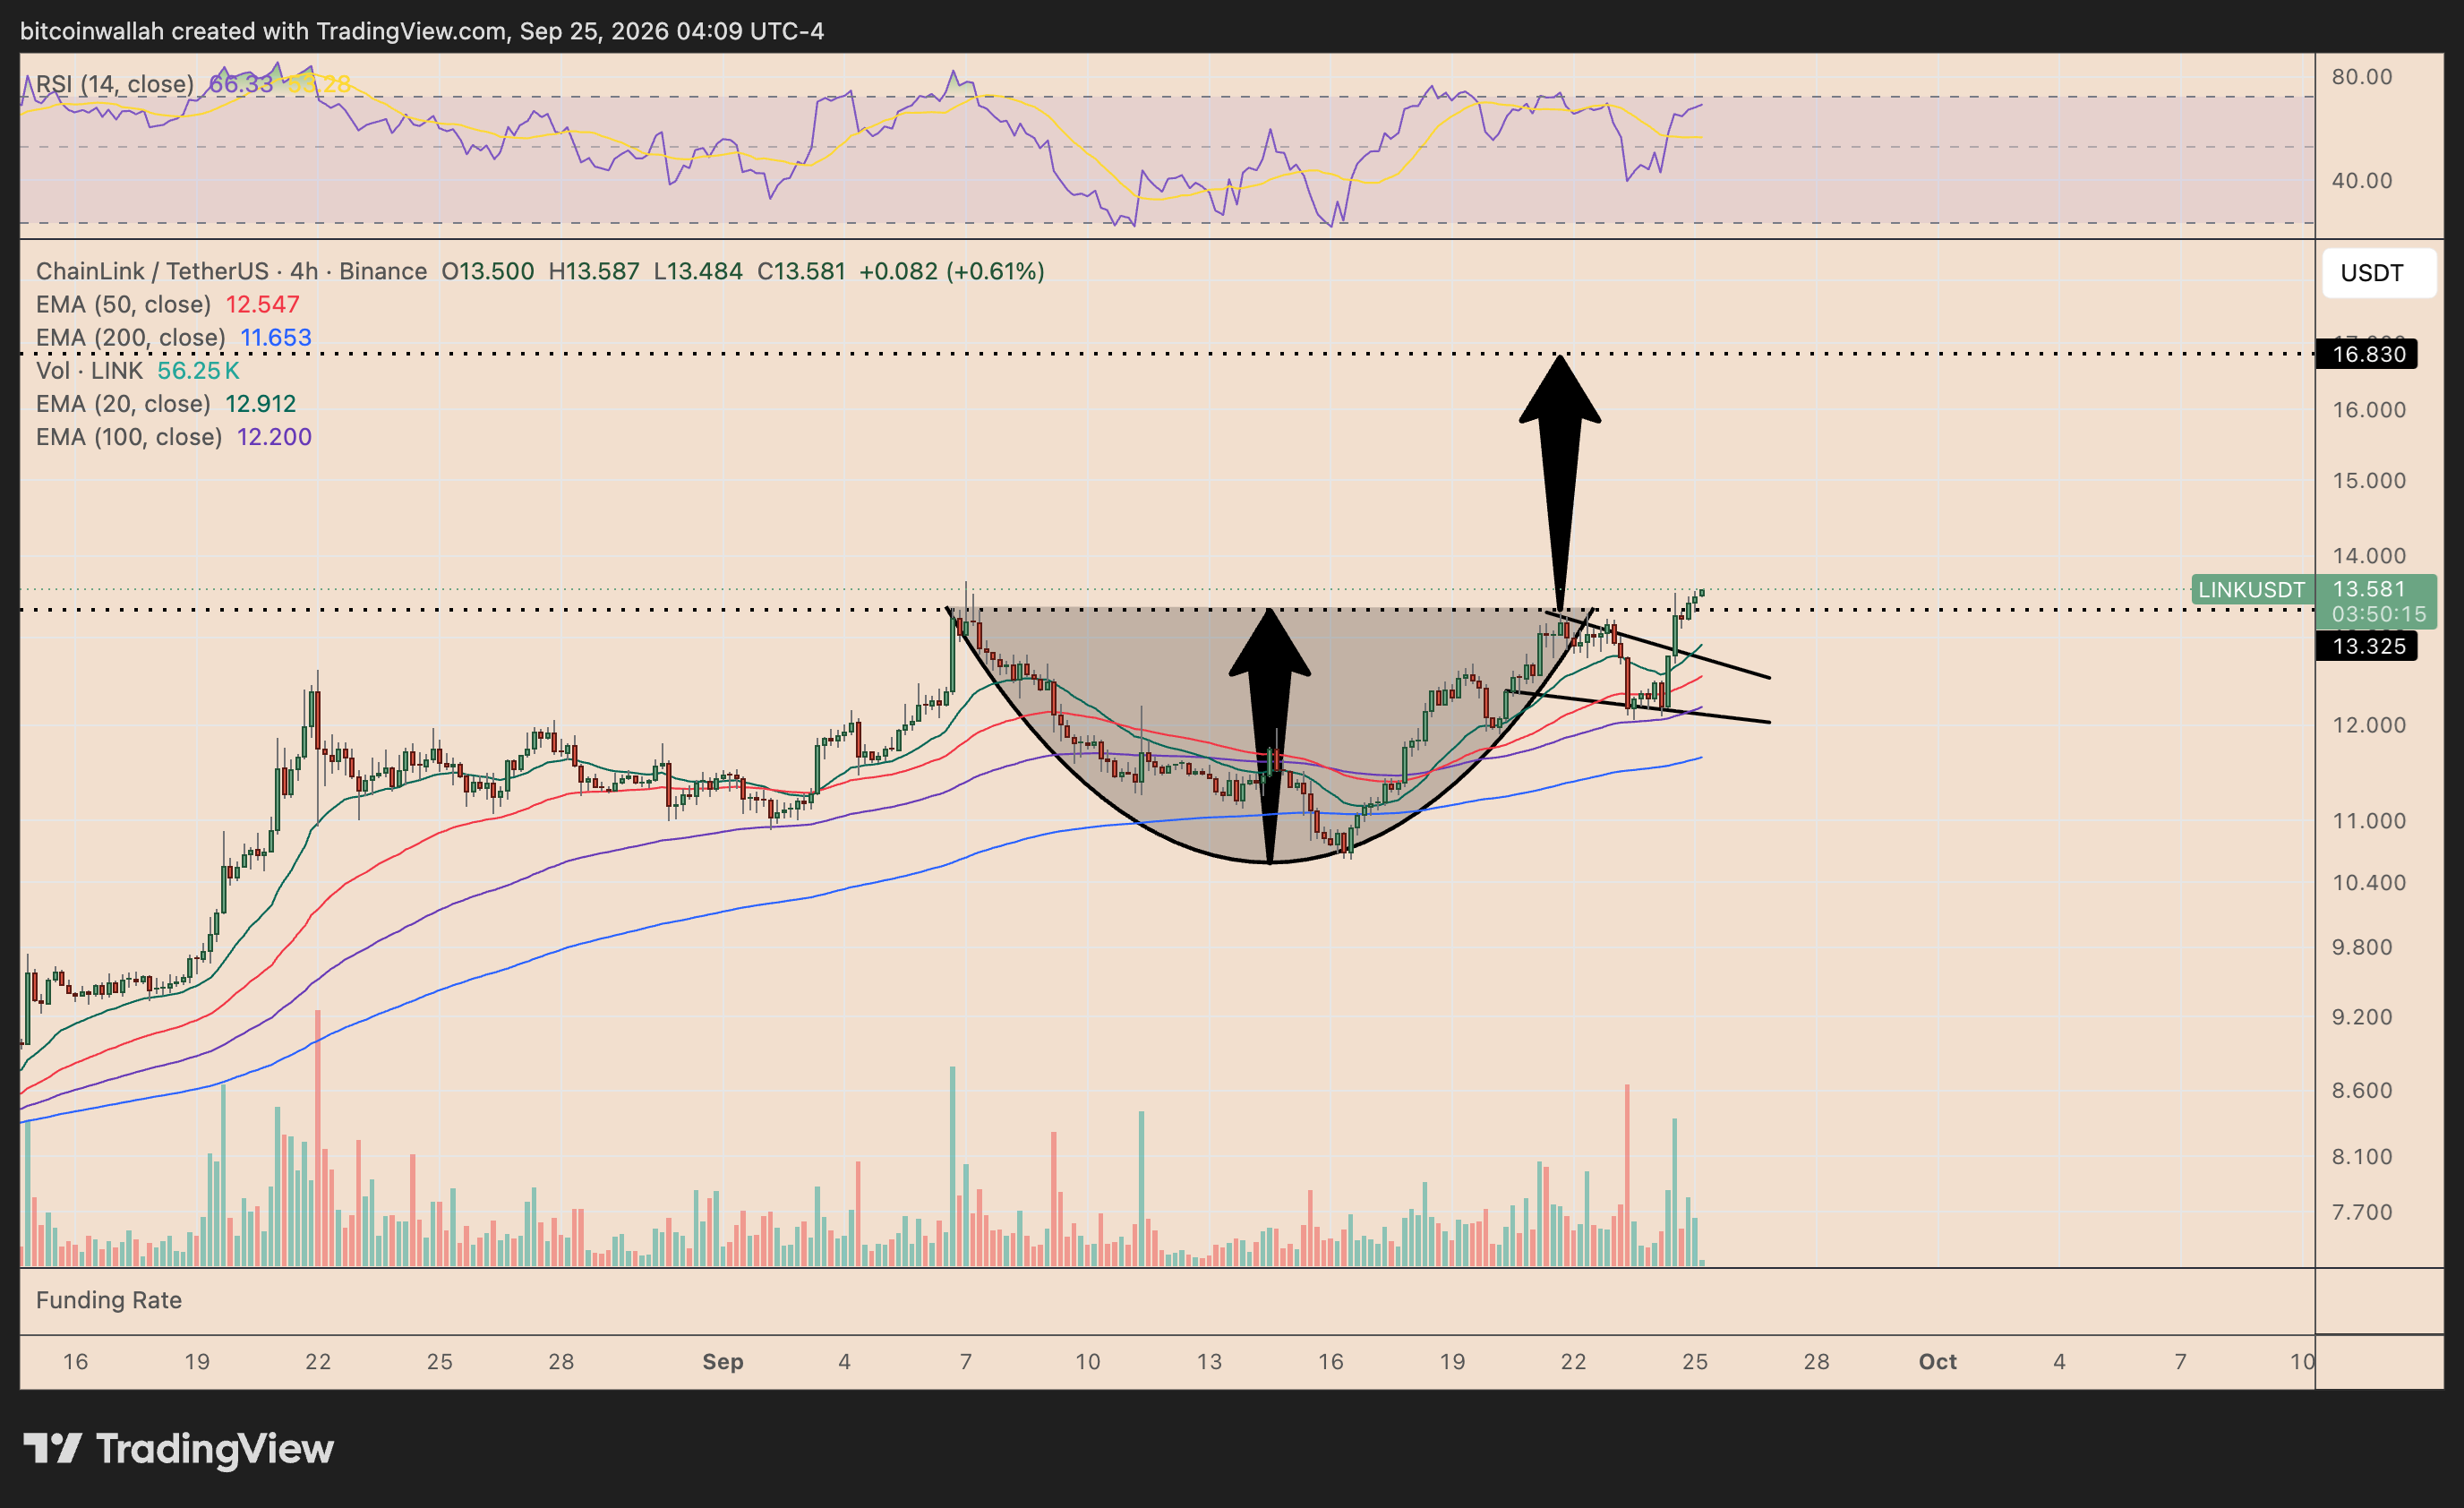
LINK has now broken above both the handle’s descending resistance and the pattern’s neckline near $13.32, suggesting the bullish structure is entering its breakout phase.
A cup-and-handle target is typically calculated by measuring the depth of the cup and adding that distance to the breakout point. In LINK’s case, that projects an upside target near $16.83, roughly 24% above current levels.
A successful move toward $16.80 would also bring LINK closer to the larger $18-$18.60 resistance zone visible on the weekly chart.
Momentum remains supportive. LINK is trading above its key 20-, 50-, 100-, and 200-period EMAs on the four-hour chart, while RSI has climbed to around 66.
The bullish setup would weaken if LINK loses the $13.32 breakout level, potentially exposing the $12.50-$12.65 area again. For now, however, the cup-and-handle breakout keeps $16.80 as the immediate target, followed by $18-$18.60.