Key Support Zone Puts Gold at a Pivot
Gold remains under pressure and at risk of further downside. Concurrently, it continues to test a key support zone that could eventually attract buyers and lead to strengthening. This puts it at a key pivot zone that will help define the next move. However, given the sharp rally that triggered a reversal of the prior decline, an eventual upside resolution is favored. But for now, sellers remain in control overall and a test of lower support before an upside resolution, if that is what happens, remains possible.

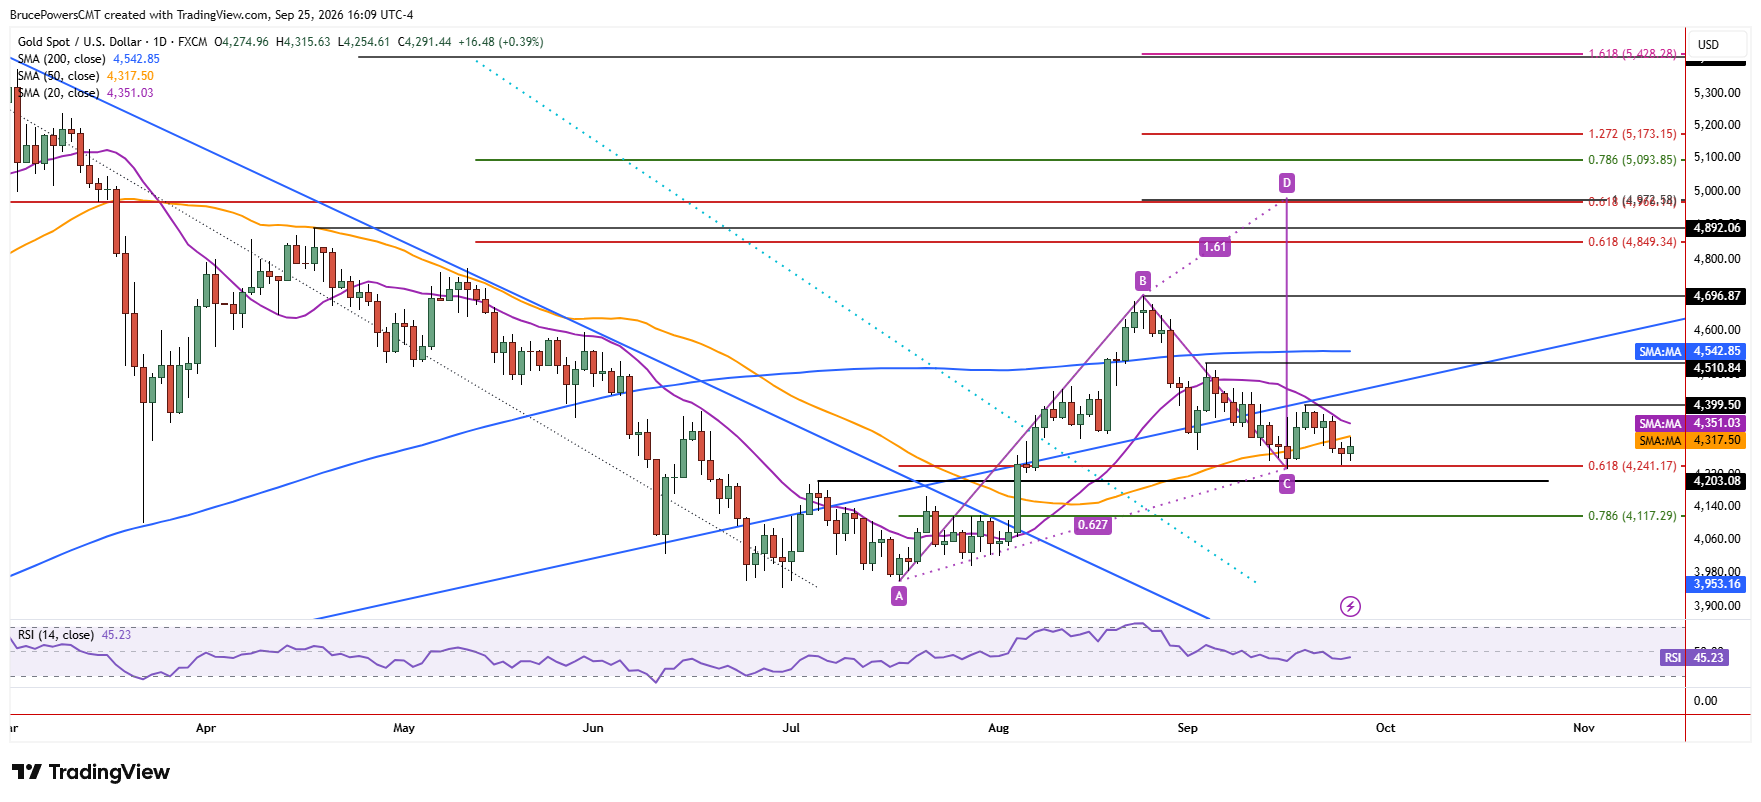
Moving Averages Define Near-Term Resistance
Key structural support is represented by the recent higher swing low of $4,235 (C), as it was higher relative to the $3,959 low in July (A). Another key indicator is the 50-day moving average, which has been tested as support this week but is set to end the week in a relatively bearish position, closing below the 50-day moving average for the third consecutive day. Overhead pressure is closing in as seen by the falling 20-day moving average, now near $4,351. It has been recognized by the market as resistance on four of the past six days. Before gold can go much higher, it needs to first reclaim the 20-day moving average.
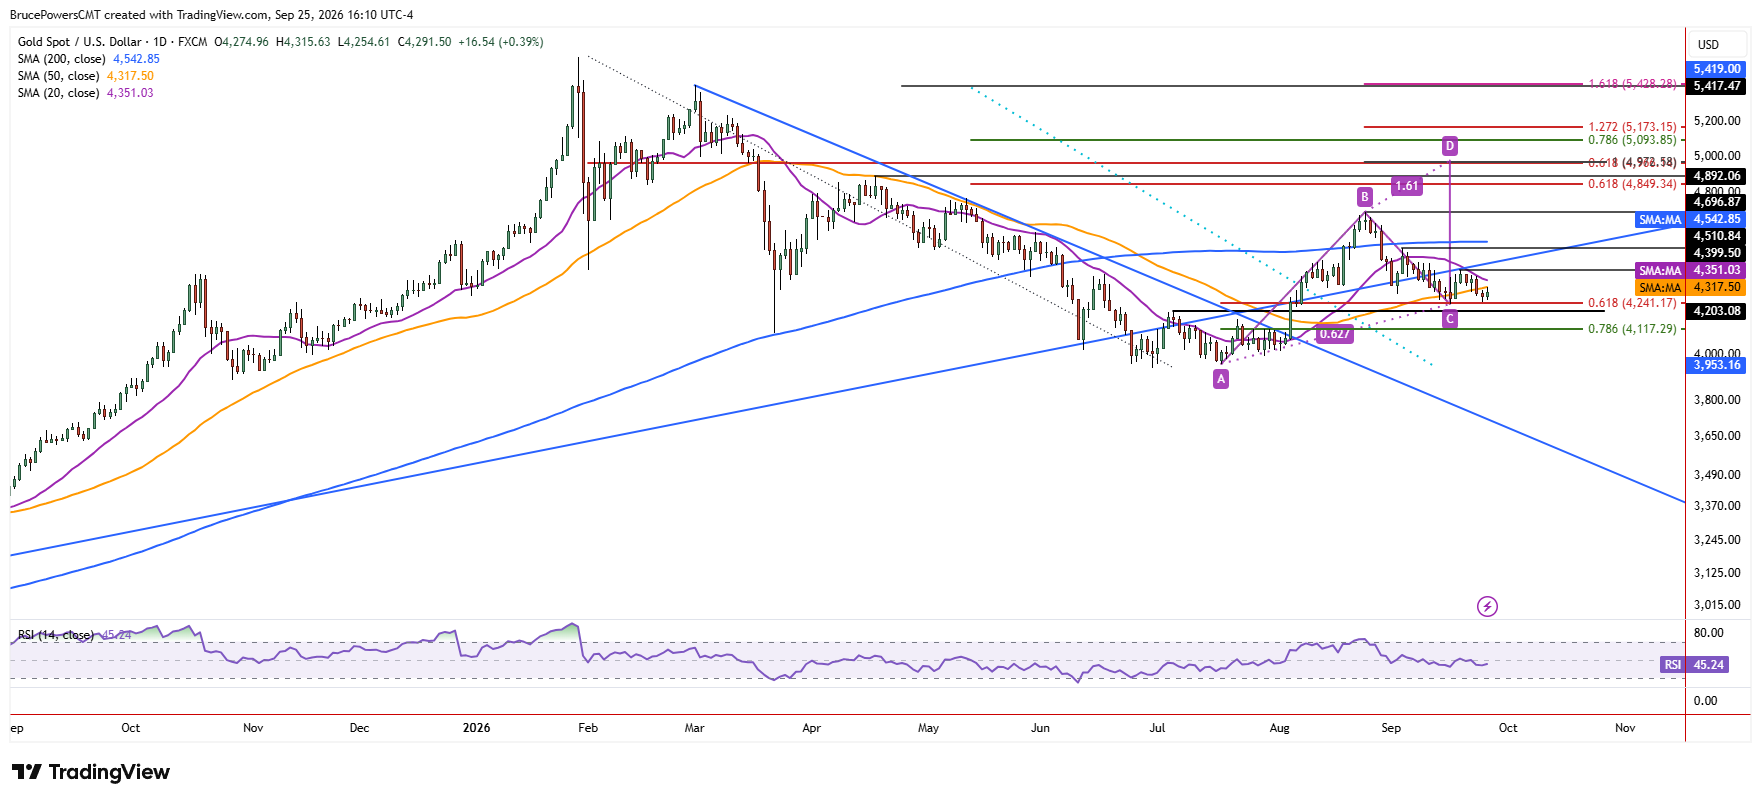
Bullish Reversal Short-Term
Despite continued signs of downward pressure, a one-day bullish reversal signal triggered on Friday, resulting in a higher daily low of $4,255 and a higher daily high of $4,316. Notably, resistance was seen at the 50-day moving average. A rally above Wednesday’s high of $4,369 would show further strength and a reclaim of the 20-day moving average.
If gold does not first fall below $4,235, a double bottom bullish reversal would be signaled on a rally above the recent high of $4,400 on the daily chart, while a weekly breakout would trigger above this week’s high of $4,383. That would also confirm the higher swing low (C). An initial key upside target from a rising ABCD pattern would be at $4,973, reinforced by the 61.8% Fibonacci retracement of the prior decline.
Lower Support Levels Remain in Play
On the downside, key potential support levels remain at the lower swing high of $4,203, which was also the top of a bottom consolidation pattern. Further down is the 78.6% Fibonacci retracement at $4,117.
Gold Price Forecast
Every new Gold analysis as it publishes, today's technical signal and key levels, live price — on one page.
See all Gold forecastsIf you’d like to know more about how to trade gold and silver, please visit our educational area.