
October Natural Gas Gave Back Part of Thursday’s Squeeze
October natural gas futures surged 9.06% Thursday after TC Energy’s Columbia Gas Transmission pipeline declared force majeure on an unexpected mechanical issue. The estimated hit to firm transportation is 1.8 bcf per day, about 1.6% of total U.S. supply. Friday is the other side of that trade. October is giving back 3.64% as the expiring contract unwinds some of the short-covering. November natural gas futures are down 3.41% and testing the first support area from Thursday’s breakout.
At 12:37 GMT, October natural gas futures are trading $3.177, down $0.120 or -3.64%. The session high is $3.209 and the low is $3.124. At 12:38 GMT, November natural gas futures are trading $3.255, down $0.115 or -3.41%. The session high is $3.300 and the low is $3.202.

Daily October Natural Gas Technical Analysis
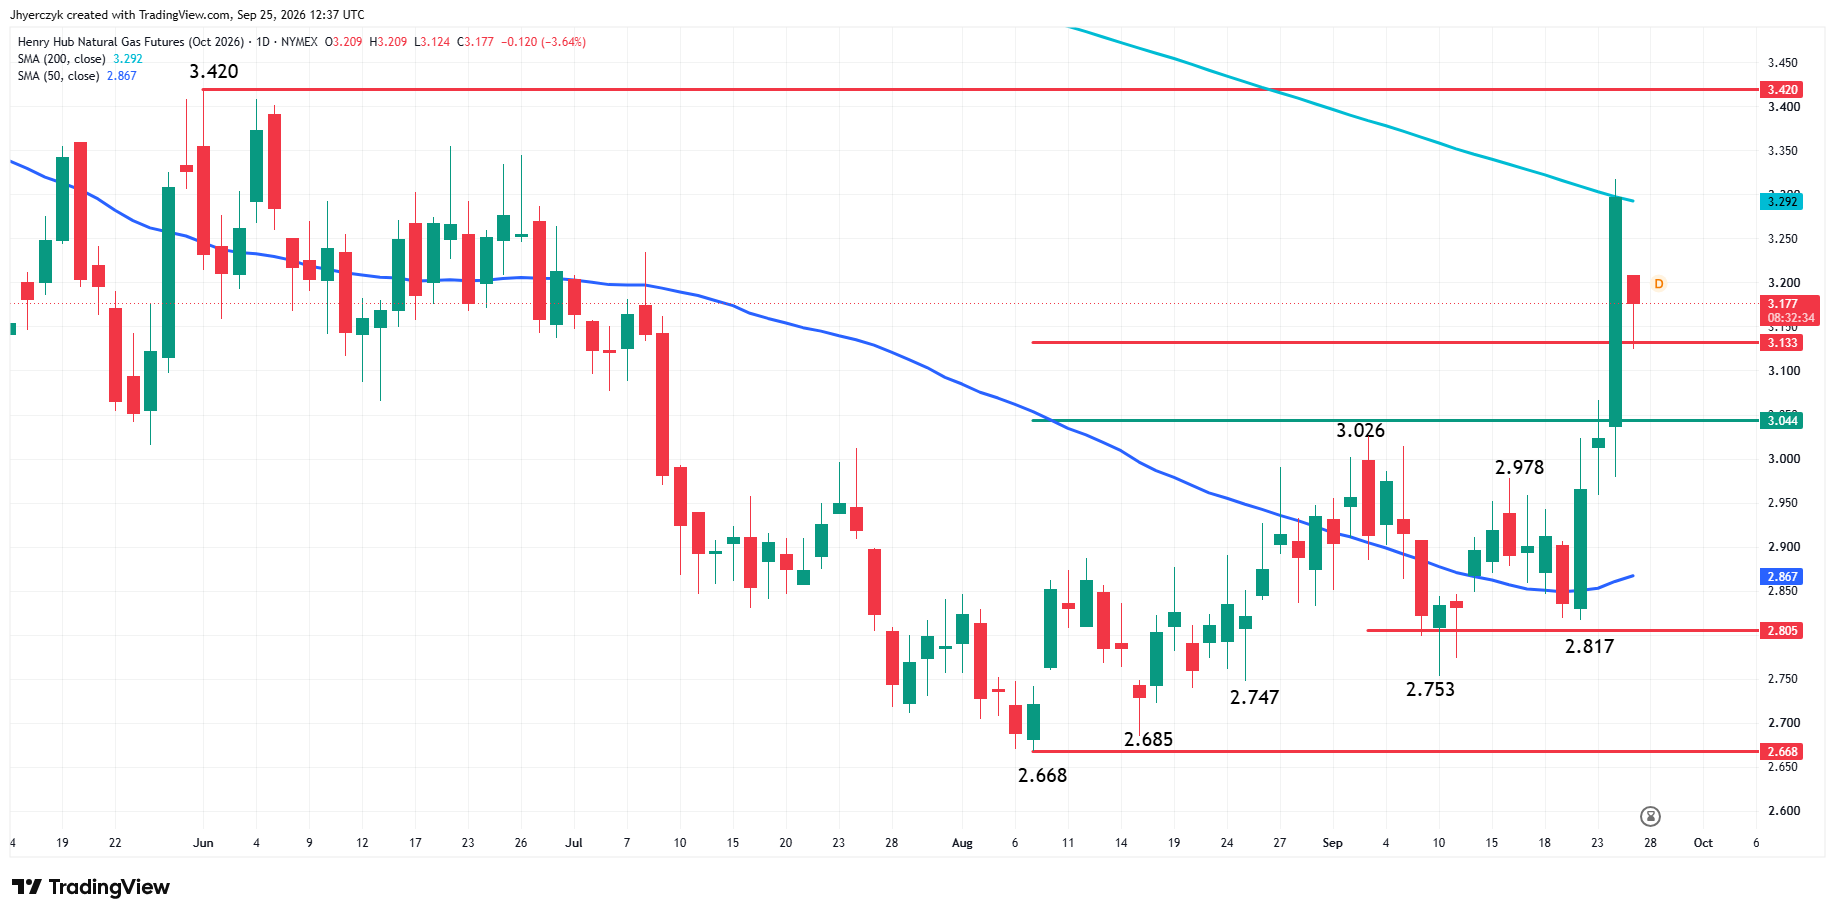
October’s move was the expiration contract getting squeezed through $3.044 and $3.133, then running into the 200-day moving average at $3.292. The pipeline outage gave shorts a reason to cover. The contract is giving back part of that move Friday.
The first level is $3.133. October is trading below it, so the next test is the $3.044 breakout level. Holding $3.044 would keep the decline in the category of an expiration unwind. A sustained break under it would put the 50-day moving average at $2.867 and the $2.805 support level back on the chart.
On the upside, buyers need to recover $3.133 before they can make another run at the 200-day moving average and Thursday’s high. The main top remains $3.420. The spike did not change the larger swing-chart trend.
Daily November Natural Gas Technical Analysis
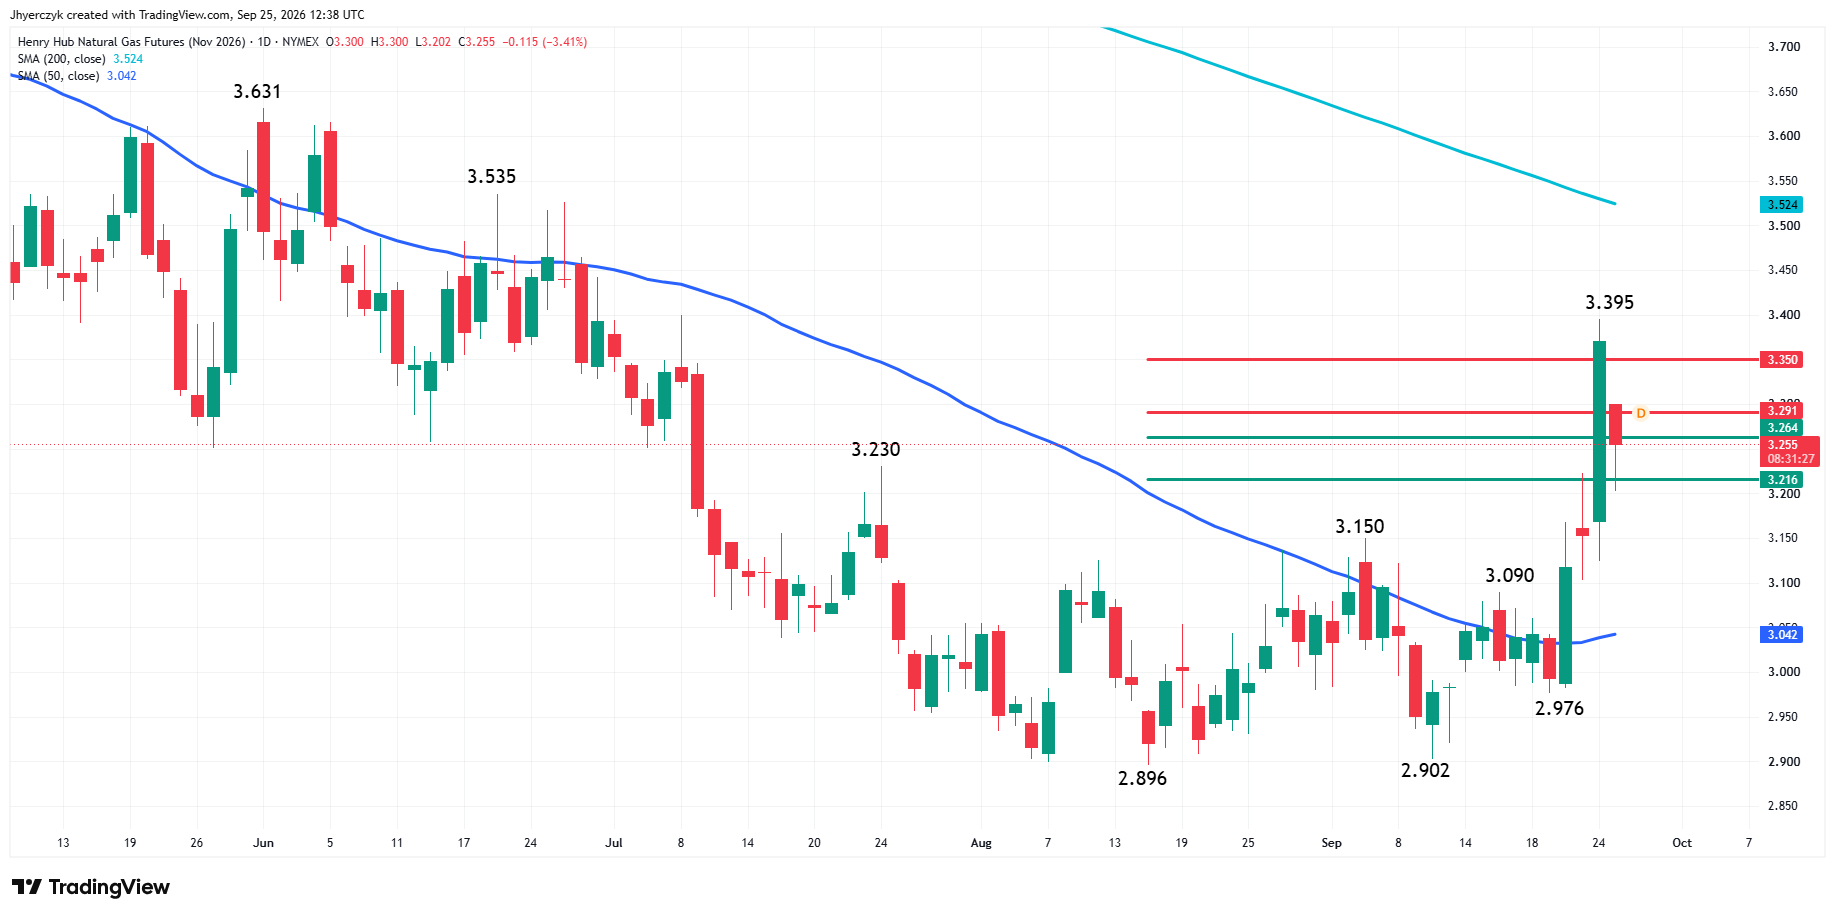
November is the cleaner chart. It took out the $3.150 top, ran through $3.216, $3.264, $3.291 and $3.350, then reached $3.395. Friday’s break has brought the contract back into the first support area at $3.216 to $3.264.
Natural Gas Price Forecast
Every new Natural Gas analysis as it publishes, today's technical signal and key levels, live price — on one page.
See all Natural Gas forecastsThat is the decision zone. A hold above $3.216 says buyers are defending the breakout after the short-covering run. That would keep $3.350 and $3.395 in play, with the 200-day moving average at $3.524 the next major upside target.
A sustained break under $3.216 would tell traders the rally was mostly short-covering and roll activity, not new November buying. That would put the 50-day moving average at $3.042 back on the chart, followed by the $3.00 to $2.976 support area.
The Pipeline Outage Forced Shorts to Cover Into Expiration
October natural gas futures broke through several resistance levels Thursday as managed money covered a large short position into the pipeline headline. The contract cleared $3.00, ran through $3.044 and $3.133, and reached a 2.5-month high before Friday’s pullback started.
October is the expiring contract. Its move exposed the short side. November natural gas futures are the contract that matters heading into next week. Whether new buyers are willing to stay with the market after the forced covering fades is the question Friday is answering. So far November is pulling back to the $3.216 to $3.264 area. That is the first zone where buyers have to show up.
The EIA Build Came in Light Again
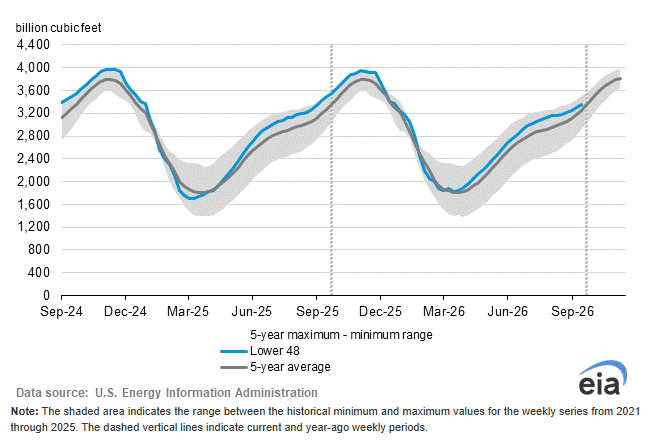
The EIA reported a 53 bcf injection for the week ended September 18. The build was slightly above the 51 bcf estimate but well below the five-year average of 76 bcf and last year’s 77 bcf. Working gas in storage rose to 3,351 bcf. Inventories are 4.2% below a year ago and 2.9% above the five-year average.
Six below-normal injections have changed the storage trajectory. The surplus is still there at 2.9% above average. It has been narrowing for six weeks running and that is what made the short side uncomfortable when the pipeline headline hit Thursday.
European gas storage was 70% full as of September 22 against an 86% five-year average. That keeps the U.S. LNG export story relevant heading into winter even with the domestic surplus intact.
Production Is High and LNG Demand Held Through the Week
Lower-48 dry gas production was tracking at 111.6 bcf per day Thursday, up 1.6% from a year ago according to BNEF. The September average is still near record levels. Demand was 72.8 bcf per day, down 5.9% from a year earlier. The market is in shoulder season and it shows.
LNG flows to U.S. export terminals were 18.6 bcf per day, up 2.2% from the prior week. Exports near record levels while domestic demand falls into the seasonal gap. That is where the balance is coming from right now.
The EIA projects end-of-October storage near 3,985 bcf, the highest in a decade and 5% above the five-year average. The EIA also raised its 2027 dry natural gas production forecast to 116.0 bcf per day from 115.3 bcf per day. Baker Hughes reported 134 active natural gas rigs last week matching the three-year high from February. The production and drilling numbers did not change on Thursday’s squeeze. They are sitting in the same place Friday morning.
What to Watch
November natural gas futures are testing the $3.216 to $3.264 zone after Thursday’s squeeze ran through four resistance levels. The pipeline outage is real. The 1.8 bcf per day loss matters heading into the end of the injection season. Friday is separating the forced covering from the actual supply impact.
The storage surplus at 2.9% above the five-year average has been narrowing for six weeks. LNG feedgas at 18.6 bcf per day is holding. Production is still above 111 bcf per day with the rig count at a three-year high. The pipeline outage shifted the near-term balance. The longer-term supply picture has not moved. November’s reaction around $3.216 by the close Friday tells traders which story the market is trading heading into next week.
More Information in our Economic Calendar.