The S&P 500 closed at 7,650.50 after gaining 0.17% on Friday. The semiconductor stocks supported the index, but the broader market remained weak. The 10-year Treasury yield moved back above 5% while oil stayed near $100 a barrel. President Donald Trump also signed a new Russia sanctions law after the market closed. The law adds a fresh risk of tariffs before the next trading session. In my view, the index may remain volatile until bond yields and oil prices begin to ease. The next move in the index will likely depend on the tariff details, Middle East developments and the strength of the AI trade.

Trump’s Russia Sanctions Law Raises Tariff Risks for the S&P 500
Trump signed the Lindsey O. Graham Sanctioning Russia and Iran Act on September 18. The law directs the president to impose duties of up to 100% on products from countries that qualify if they continue to purchase Russian energy or are one of the top violators of sanctions.
China and India are among the largest buyers of Russian oil but the law does not name either country. The final targets, rates and possible waivers still remain unclear. Trump signed the law after the cash session on Friday so the S&P 500 has not yet shown a direct reaction to it.
The outlook on tariffs is not entirely negative. The United States and China are also discussing reduction or removal of 15% tariff by China on U.S. liquefied natural gas. The talks come before the planned visit of Chinese President Xi Jinping to Washington on September 24.
The LNG proposal may form part of the broader tariff reduction framework to cover about $30 billion of trade. But no final agreement has been announced. This creates two competing signals for investors. The Russia sanctions law raises the risk of escalation while the trade deal between U.S. and China could ease pressure on selected industries.
The broader tariffs would raise costs for imports. Technology hardware, consumer goods, industrial equipment and healthcare sectors may face pressure on margins. The law could also restrict Russian oil flows that may add pressure to global energy prices and inflation.
The surge in inflation may keep Treasury yields elevated and reduce the valuation that investors are willing to pay for future earnings. U.S. LNG exporters may benefit if China removes its tariff but this relief would be narrow compared with a tariff applied to all goods from a major trading partner.
S&P 500 Price Forecast
Every new S&P 500 analysis as it publishes, today's technical signal and key levels, live price — on one page.
See all S&P 500 forecastsMiddle East Tensions Keep Oil Prices Near $100 and Pressure the S&P 500
The geopolitical outlook became more uncertain after the U.S. market closed. Saudi civil defense issued two rounds of danger alerts for Riyadh and Al-Kharj early Saturday before giving the all-clear. These were the first alerts for Saudi capital since the latest escalation by the Houthis. The attacks by the Houthis targeted Saudi vessels and energy infrastructure. This creates fresh risk for S&P 500.
The risk in shipping is also rising around two major oil routes. The Revolutionary Guard of Iran said that it struck the Togo-flagged tanker in the Strait of Hormuz after the unauthorized passage. Maritime officials confirmed that a tanker was hit by an unknown projectile but they reported no casualties or environmental damage. The pressure on both routes could lift costs for crude, diesel, freight and insurance.
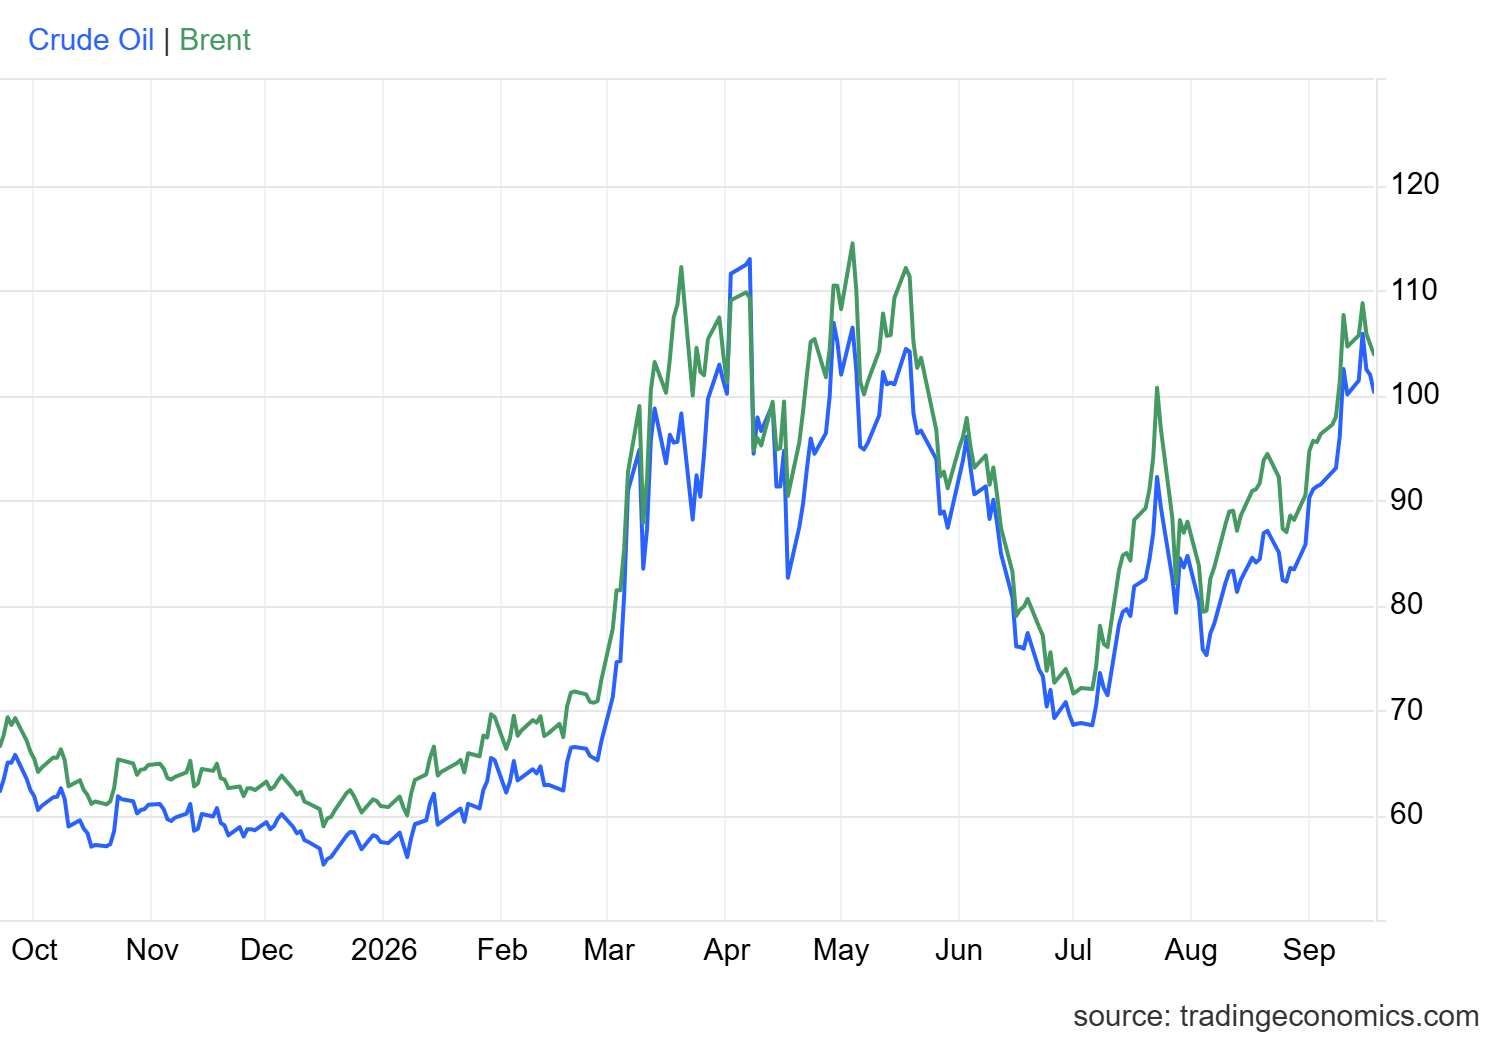
France also said that the G7 would meet to discuss the energy crisis and possible releases from strategic reserves. No new reserve release has been approved. The sustained move below $100 in crude oil may ease inflationary pressure and reduce pressure on Treasury yields. But further attacks would do the opposite and could hurt airlines, transport, manufacturers and consumer companies.
S&P 500 Outlook: AI Stocks Face 5% Treasury Yields
AI and Semiconductor Stocks Drive the S&P 500 Rally
The technology sector led the gains in S&P 500 on Friday while utilities posted the largest sector decline. But the weak breadth reduced the strength of the move. The declining stocks outnumbered advancing stocks on the New York Stock Exchange.
Technology now represents about 38% of the index and has gained more than 20% this year. This heavy weighting allows semiconductor and AI stocks to lift the headline index even if many other shares fall.
The chart below shows that the S&P 500 Information Technology index has broken the bull flag pattern in August 2026. After the breakout, the index has formed a price compression pattern and is now looking to break higher. The break above 7,140 will open the way for a much stronger move to record high. This move may push the headline index to new record levels.
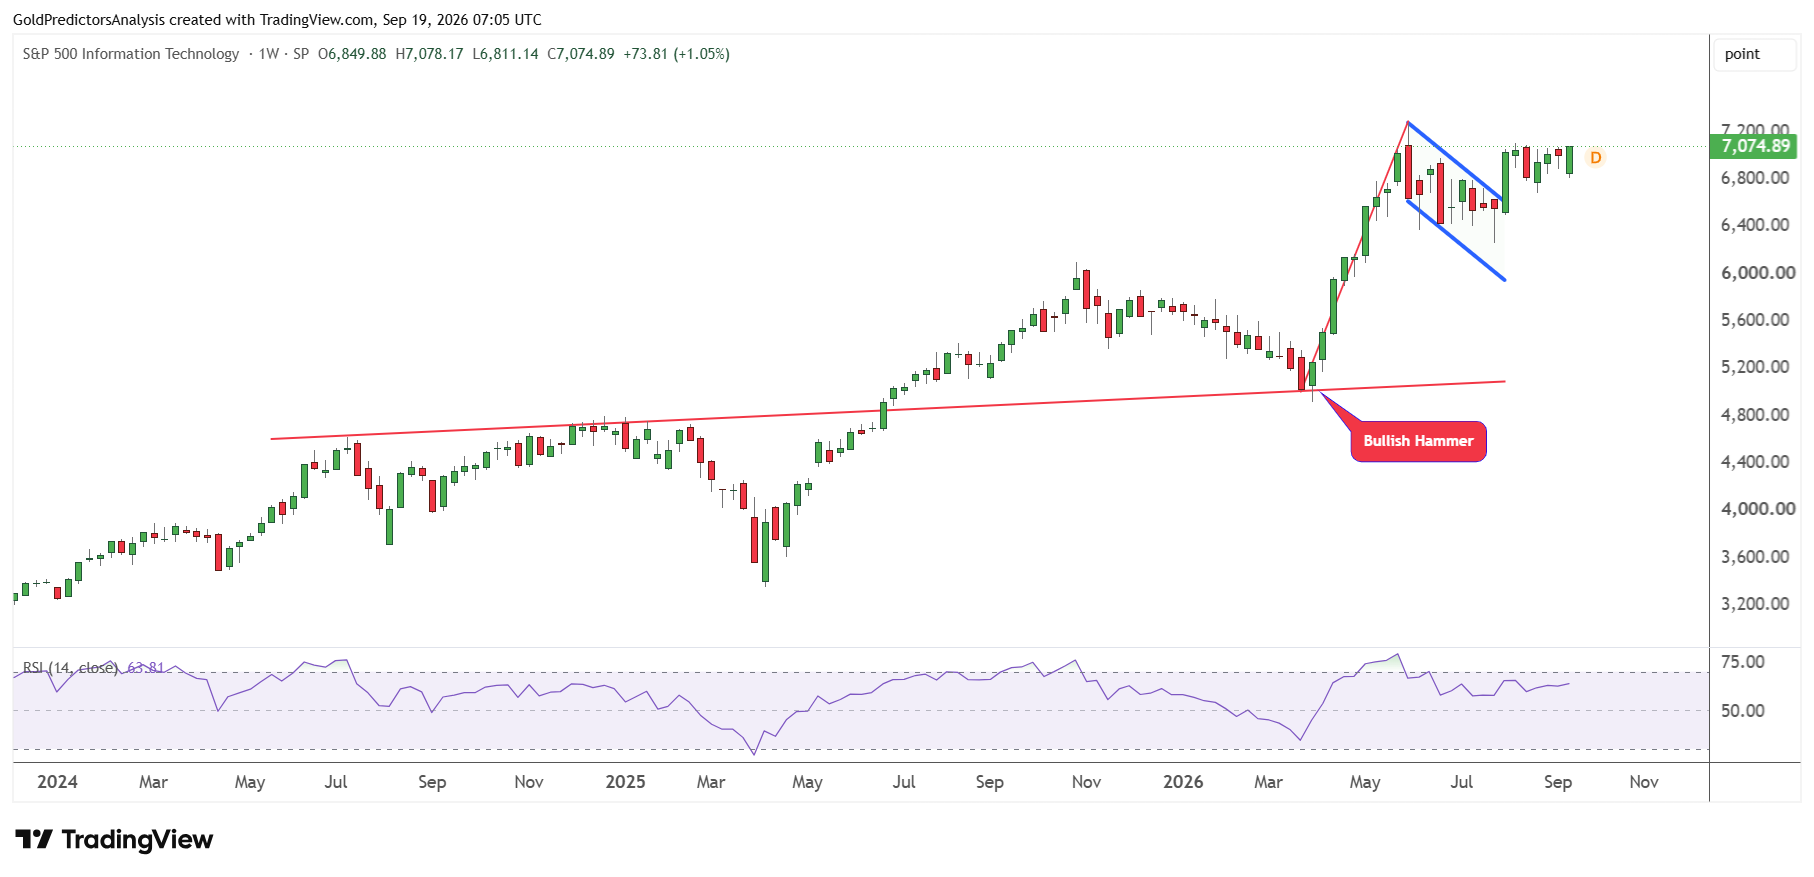
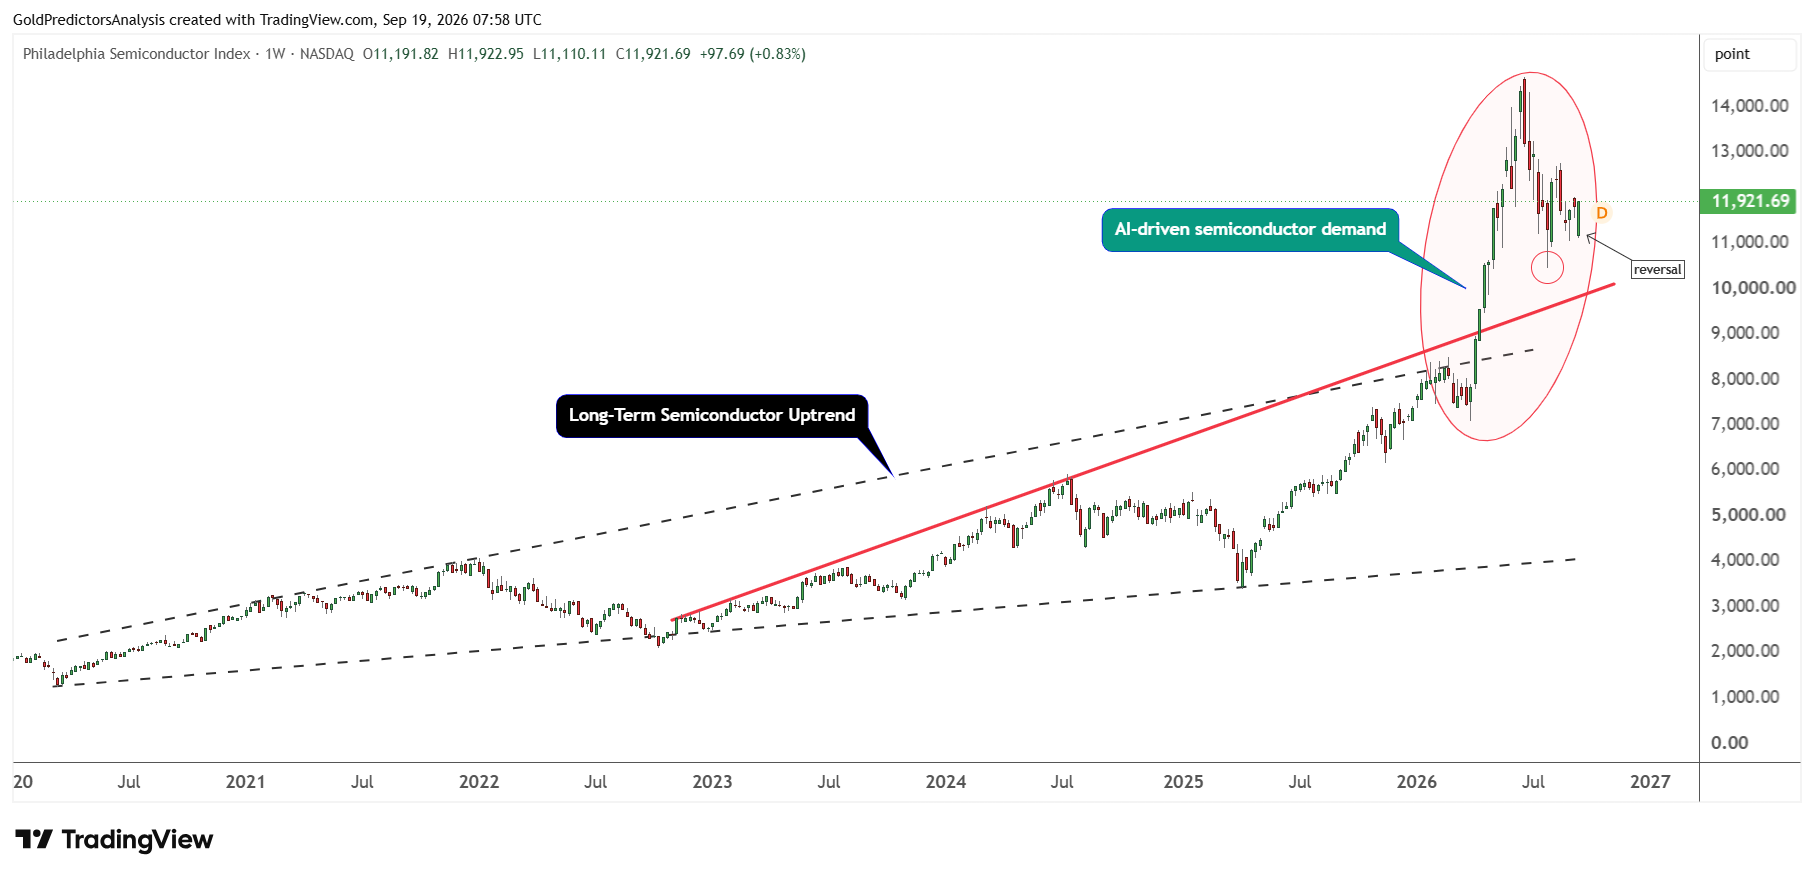
The Philadelphia semiconductor index also gained 0.83% last week and produced a key reversal candle.
Fed Rate Hike and 5% Treasury Yields Pressure Stock Valuations
The Fed raised interest rates by 25 basis points to 3.75%-4.00% on September 16. The median forecast suggests that the Fed may consider another hike this year. The 10-year Treasury yield remained at 5% and the market priced a 57.6% chance of another hike in October.
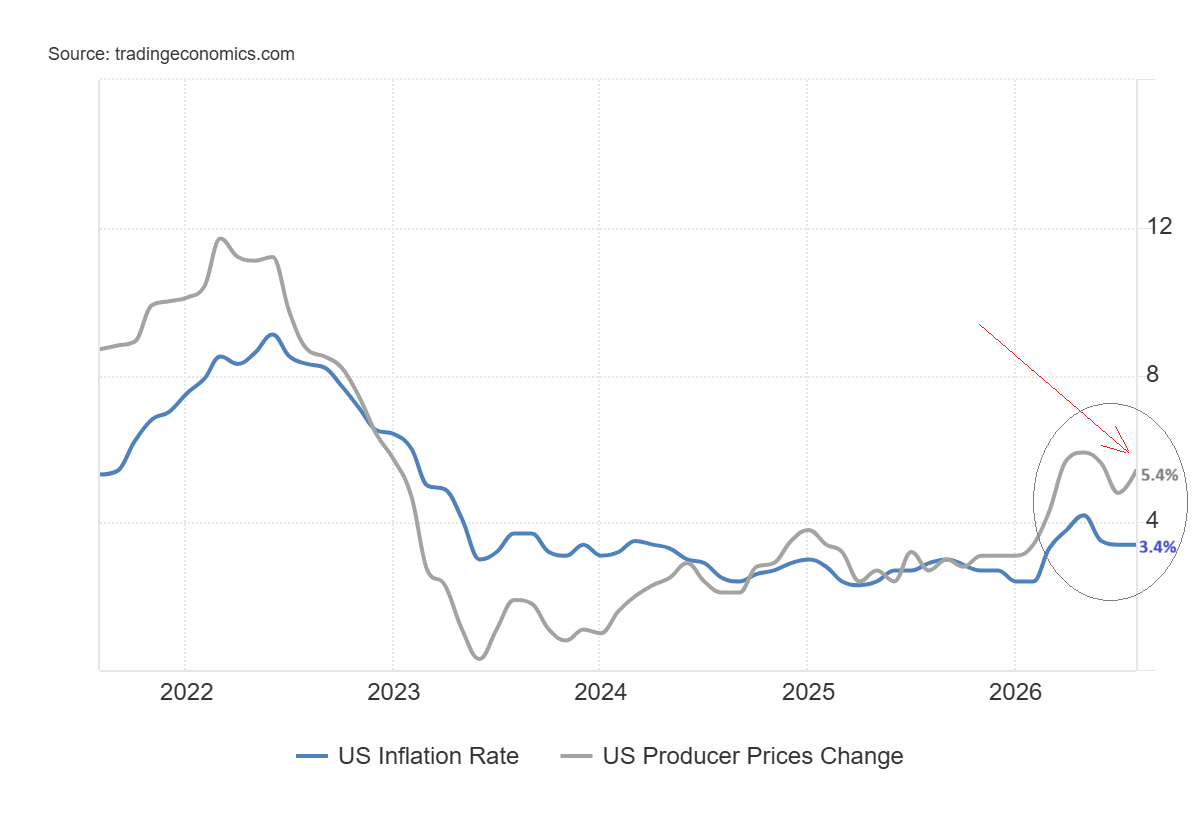
The positive momentum in the US Treasury yields raises costs for borrowing and reduces the present value of future profits. Inflation remains another concern. Consumer prices increased 3.4% from a year earlier in August while producer prices increased 5.4%. These pressures may limit the upside for high valuation growth stocks.
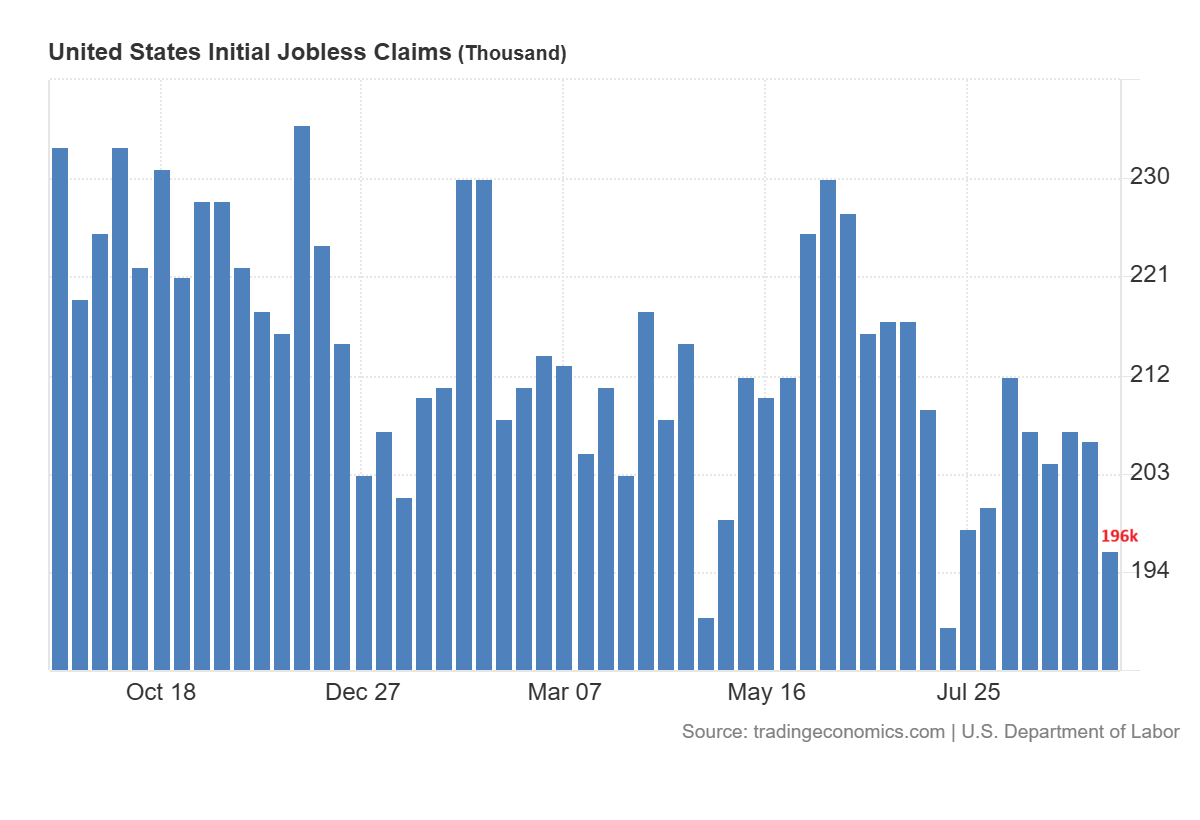
The labor market and the year-to-date momentum in the index still provide support. The initial jobless claims dropped to 196,000, which suggests that layoffs remain limited.
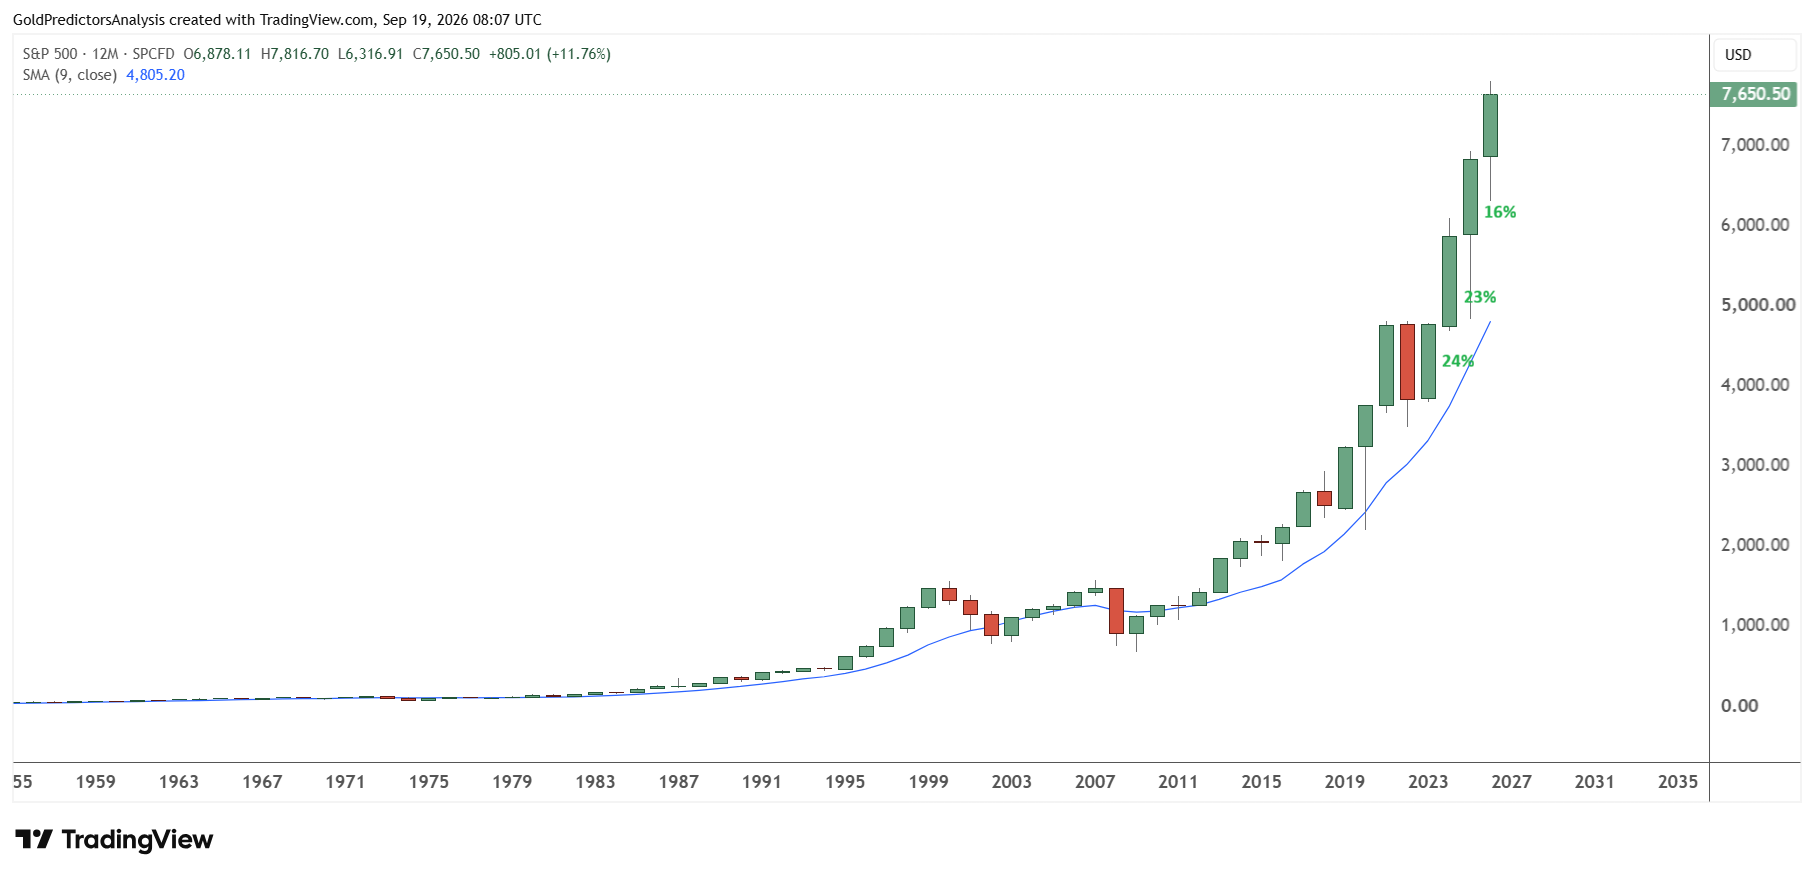
The S&P 500 has also gained about 11.8% this year and remains around 2% below the August record. However, the S&P 500 has been gaining over 15% during the past three years. Despite the extreme conditions, the market remains well above the key averages.
In my view, the S&P 500 may continue to rise if technology stocks remain strong but elevated yields, high oil prices and weak market breadth could increase volatility and limit the pace of gains.
S&P 500 Technical Analysis: 7,500 Support Keeps 8,000 in View
The S&P 500 fell on Wednesday to form a low at 7,500 and reversed higher on Thursday and Friday to close at 7,650.50. The index closed above the 50-day SMA after forming a low at the significant long-term support of 7,500. This indicates the index is forming a bottom again and moving higher. A break above 7,700 will likely open the way for further upside towards the 8,000 level.
The price structure on the daily chart remains strongly bullish. This bullish structure is seen by the formation of an inverted head and shoulders pattern from January 2025 to June 2025 and then ascending broadening wedge pattern from July 2025 towards the recent high. These patterns suggest a strong positive structure. The 50- and 200-day SMAs are rising and the index remains above these moving averages.
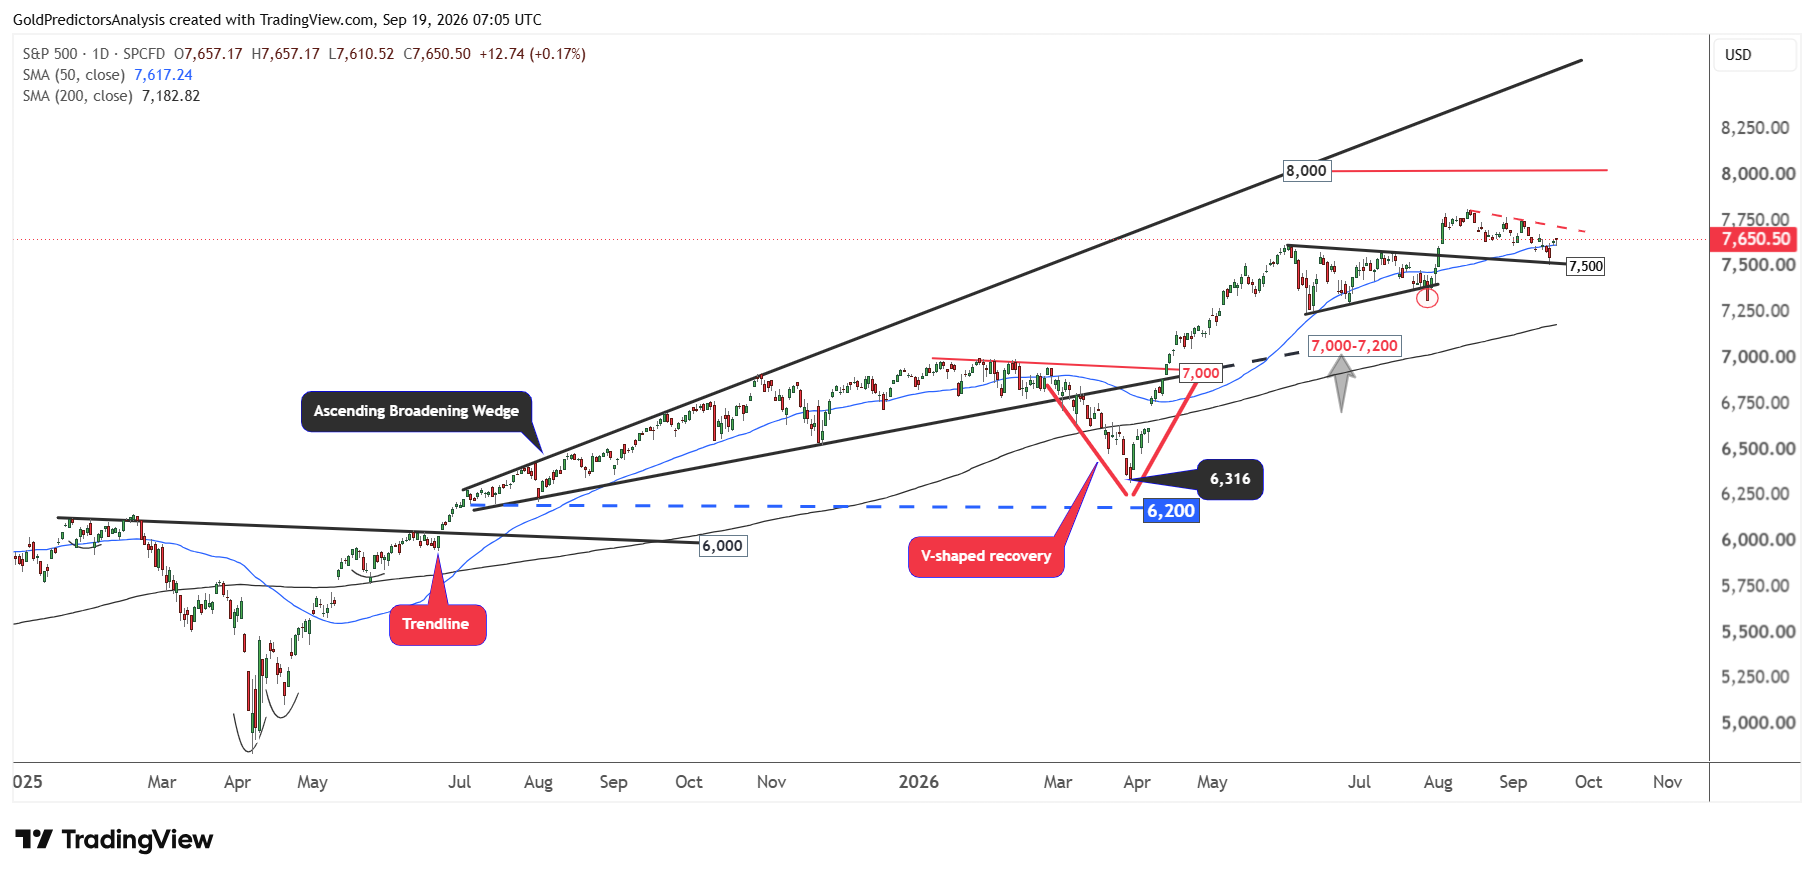
The index has already recovered from the immediate support at 7,500. This recovery indicates that the index is preparing for the next upside move.
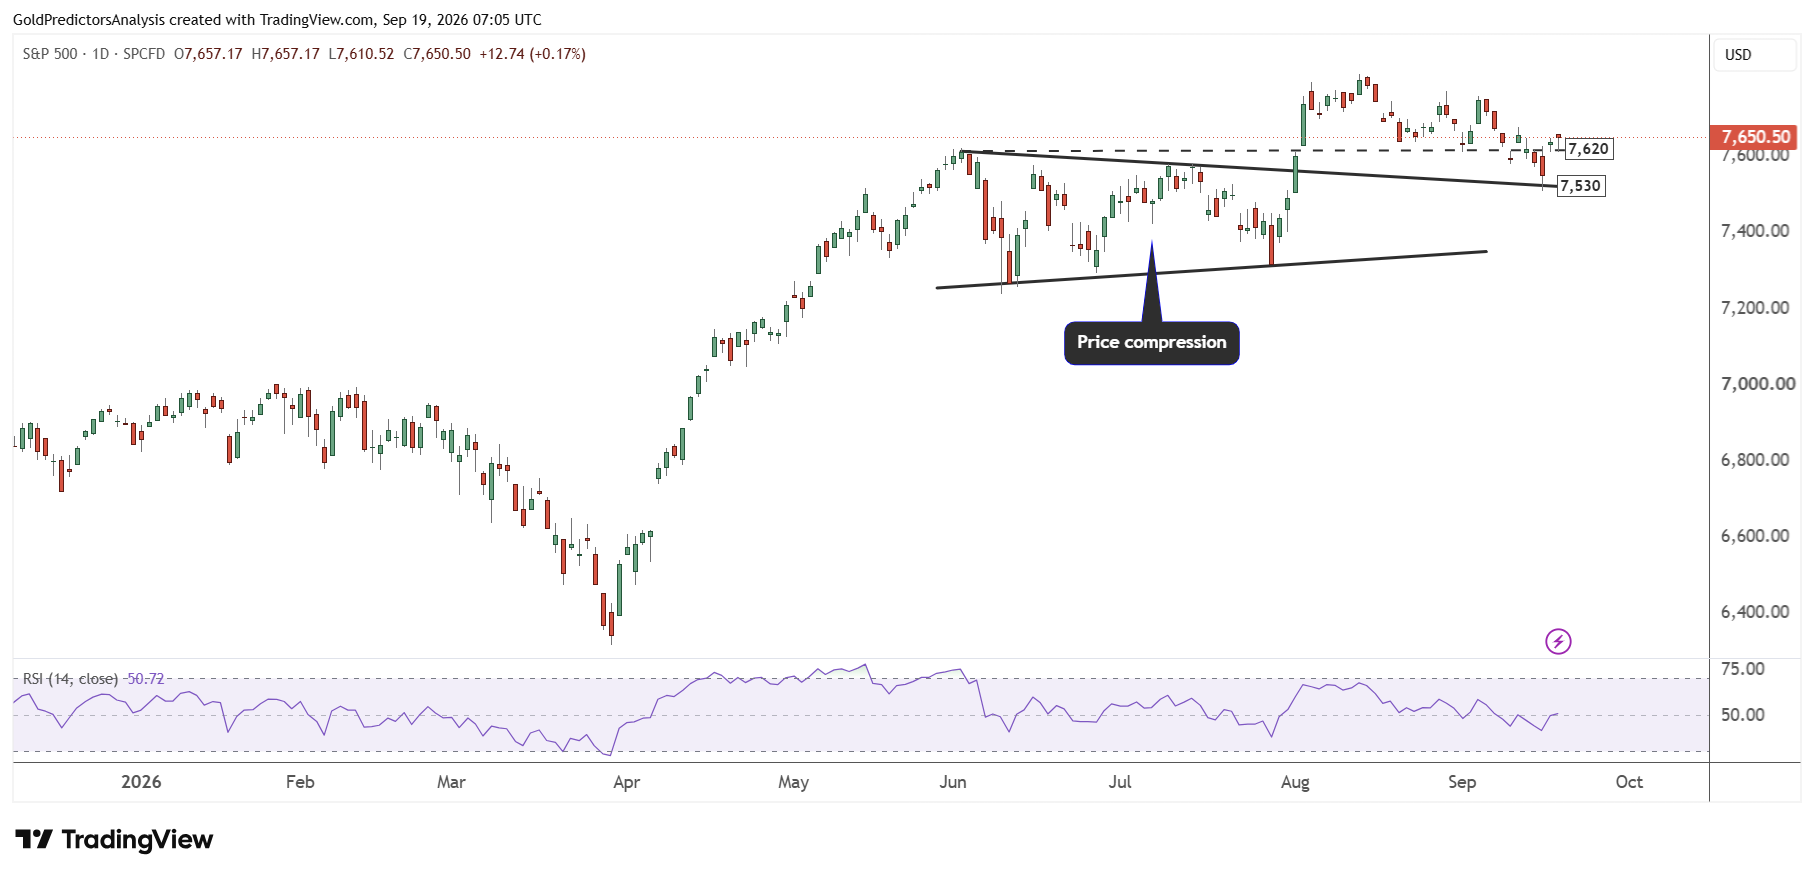
The chart below shows the price compression pattern in the short term. This compression is observed from June 2026 until September 2026. The recent weakness hit the key 7,500 support level, which is defined by the descending trendline that stretches from the June 2, 2026, high.
The reversal from this support pushed the index to close above 7,620, which suggests a positive move next week. Moreover, the RSI closed exactly at the midline. However, if prices drop below 7,500, it will likely increase the risk of deeper corrections.
What to Watch Next for the S&P 500
The S&P 500 remains in a bullish structure after rebounding from 7,500 and closing above the 50-day SMA. Technology and semiconductor shares continue to lead the recovery. A sustained break above 7,700 would strengthen the bullish outlook and could open the way toward 8,000. But broader market participation would make the rally more sustainable.
The risk remains higher in the short term. Treasury yields near 5%, oil prices near $100, tariff uncertainty and tensions in the Middle East may increase volatility in markets. These factors could pressure valuations and corporate margins for companies. A break below 7,500 would weaken the recovery and increase the risk of deeper correction.
In my view, the technical structure supports a move towards 8,000 as long as the index remains above 7,500 but elevated Treasury yields, high oil prices, tariff uncertainty and tensions in the Middle East may create pullbacks along the way.
Read more: $100 Oil and Treasury Yields Threaten Key 7,500 Level in S&P 500