


Wedge Breakout Gains Confirmation
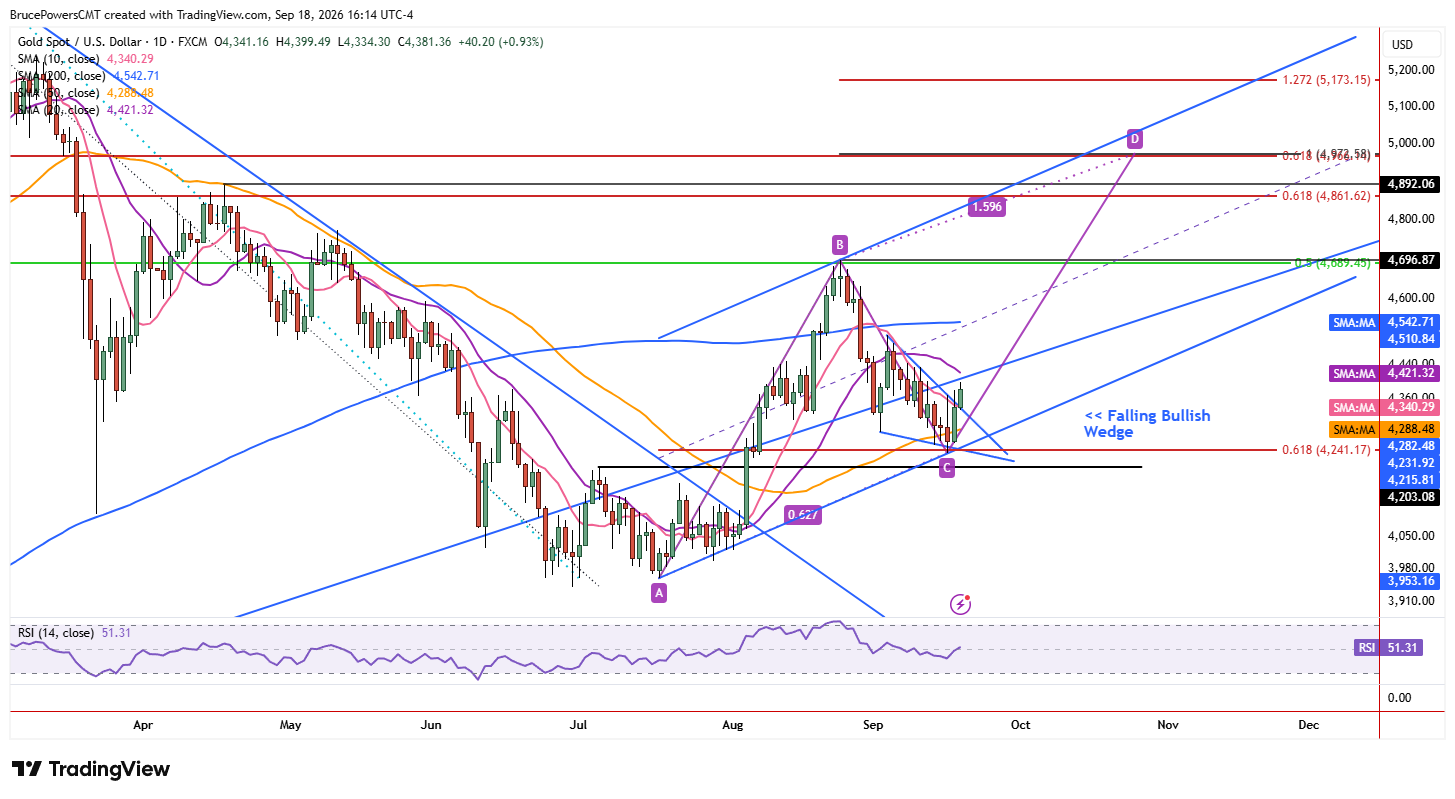
Gold extended its short-term advance on Friday, reaching a five-day high of $4,400 and testing resistance near a trendline. A higher daily low of $4,334 was established, successfully testing support at both the former downtrend line, which now marks the upper boundary of a small falling bullish wedge pattern, and the 10-day moving average. An initial bullish breakout of the wedge occurred on Thursday, but it was not confirmed by a daily close above the upper boundary. Friday’s close is set to provide confirmation, suggesting the breakout is becoming more established.

Higher Low Signals Next Leg
A successful breakout of the falling wedge has the potential to generate strong bullish momentum. Friday’s test of the former resistance line and 10-day moving average as support provides further evidence of buyers regaining control. The breakout suggests the completion of the recent pullback and establishment of a higher swing low, which is bullish. In turn, this points to the likely beginning of the next leg higher in the developing advance that started from the July low of $3,959 (A).
ABCD Symmetry Points Toward $4,973
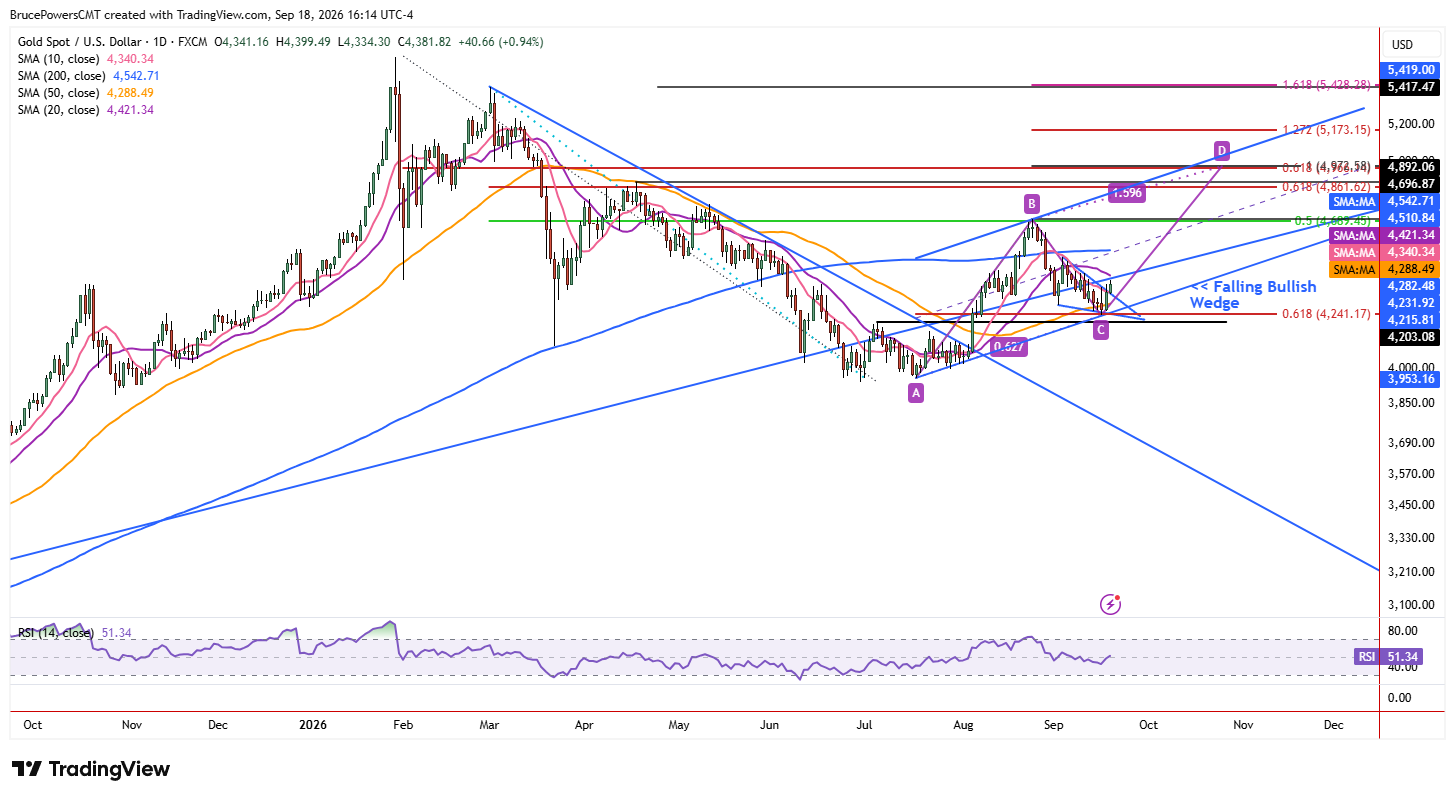
With a higher swing low established, a rising ABCD pattern is added to the chart to estimate a possible upside target defined by price symmetry. Such symmetry commonly marks a potential pivot level. For gold, that level is near $4,973, reinforced by the 61.8% Fibonacci retracement at $4,966. The confluence of the two indicators adds to the significance of the resistance zone and therefore the potential for it to be tested before the larger advance continues into its second leg.
Rising Channel Defines Potential Path
This week’s higher swing low also provides a second anchor for a rising channel, which shows potential upper dynamic resistance and lower support for the developing advance. The channel midline can also serve as a key potential pivot level. Notably, the initial 100% projection for the ABCD pattern may be reached while gold remains within the rising channel, providing a technical framework for the potential advance toward the $4,973 target zone.
If you’d like to know more about how to trade gold and silver, please visit our educational area.


