
SP500 Rebounds From Session Lows As Traders Shrug Off Worries About High Treasury Yields
SP500 is mostly flat as 10-year yields tests 5% again. The yield of 10-year Treasuries continues its attempts to settle above the key 5.00% level as bond traders focus on longer-term outlook for U.S. interest rates and worry about rising debt pile.
According to FedWatch Tool, the probability of a rate hike at the next meeting in October has increased to 57.6%. I’d note that rate hike expectations have not put material pressure on SP500 today.
Traders also focus on the situation in the oil market. Oil prices moved lower as French President Macron called for a G7 meeting to discuss the release of strategic oil reserves. Recent reports indicated that Saudi Arabia would not be able to supply oil to customers in Europe as the East-West pipeline was damaged. Interestingly, the market believes that the potential release of strategic stockpiles would put pressure on prices.
Traders also had a chance to take a look at the Industrial Production report for August. The report showed that Industrial Production was unchanged on a month-over-month basis, compared to analyst consensus of +0.3%.
Tech stocks managed to gain ground in today’s trading session as traders remained bullish on AI-related names. Most market sectors moved lower. Basic materials stocks found themselves under pressure despite rising precious metals markets. Utilities and real estate stocks moved lower amid rising Treasury yields.
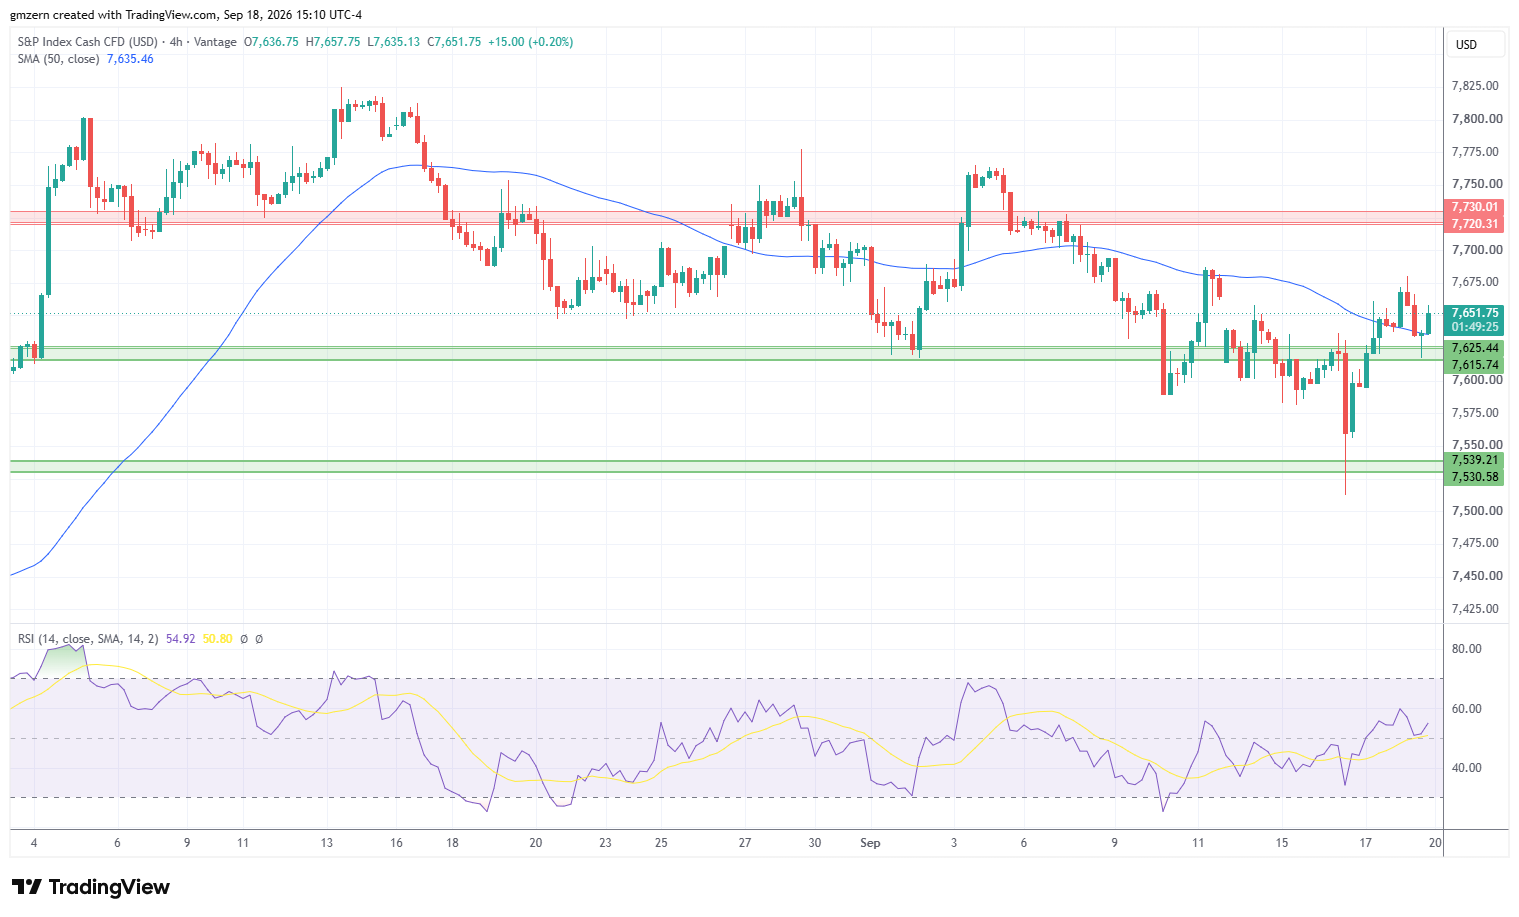
SP500 failed to settle below the support at 7615 – 7625 and is trying to settle back above the 50 MA at 7635. In case this attempt is successful, SP500 will head towards recent highs near the 7680 level. A move above 7680 will open the way to the test of the resistance at 7720 – 7730.
On the support side, a successful test of the support at 7615 – 7625 will push SP500 towards the next support at 7530 – 7540.

NASDAQ Moves Higher As Demand For Tech Stocks Stays Strong
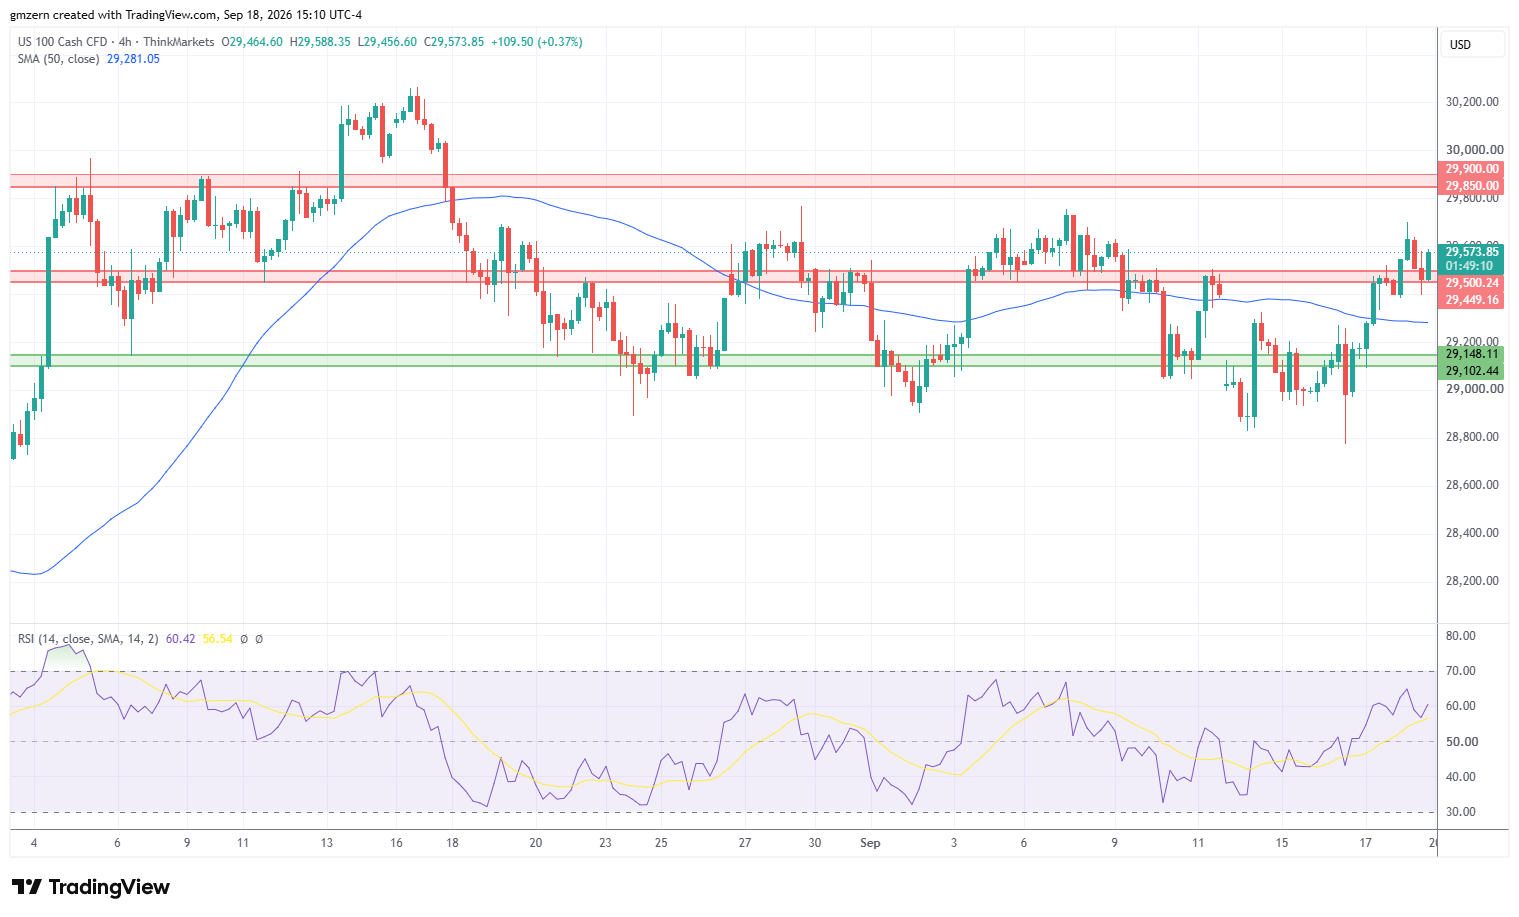
From the technical point of view, NASDAQ continues its attempts to settle above the resistance level at 29,450 – 29,500. If NASDAQ manages to settle above the 29,500 level, it will head towards the next resistance at 29,850 – 29,900.
Dow Jones Price Forecast
Every new Dow Jones analysis as it publishes, today's technical signal and key levels, live price — on one page.
See all Dow Jones forecastsDow Jones Attempts To Settle Below 51,600
Dow Jones pulled back amid falling demand for financial and consumer stocks. Disney, which was down by -2.6%, was the worst performer in the Dow Jones index today. IBM and Salesforce have also gained material downside momentum in today’s trading session.
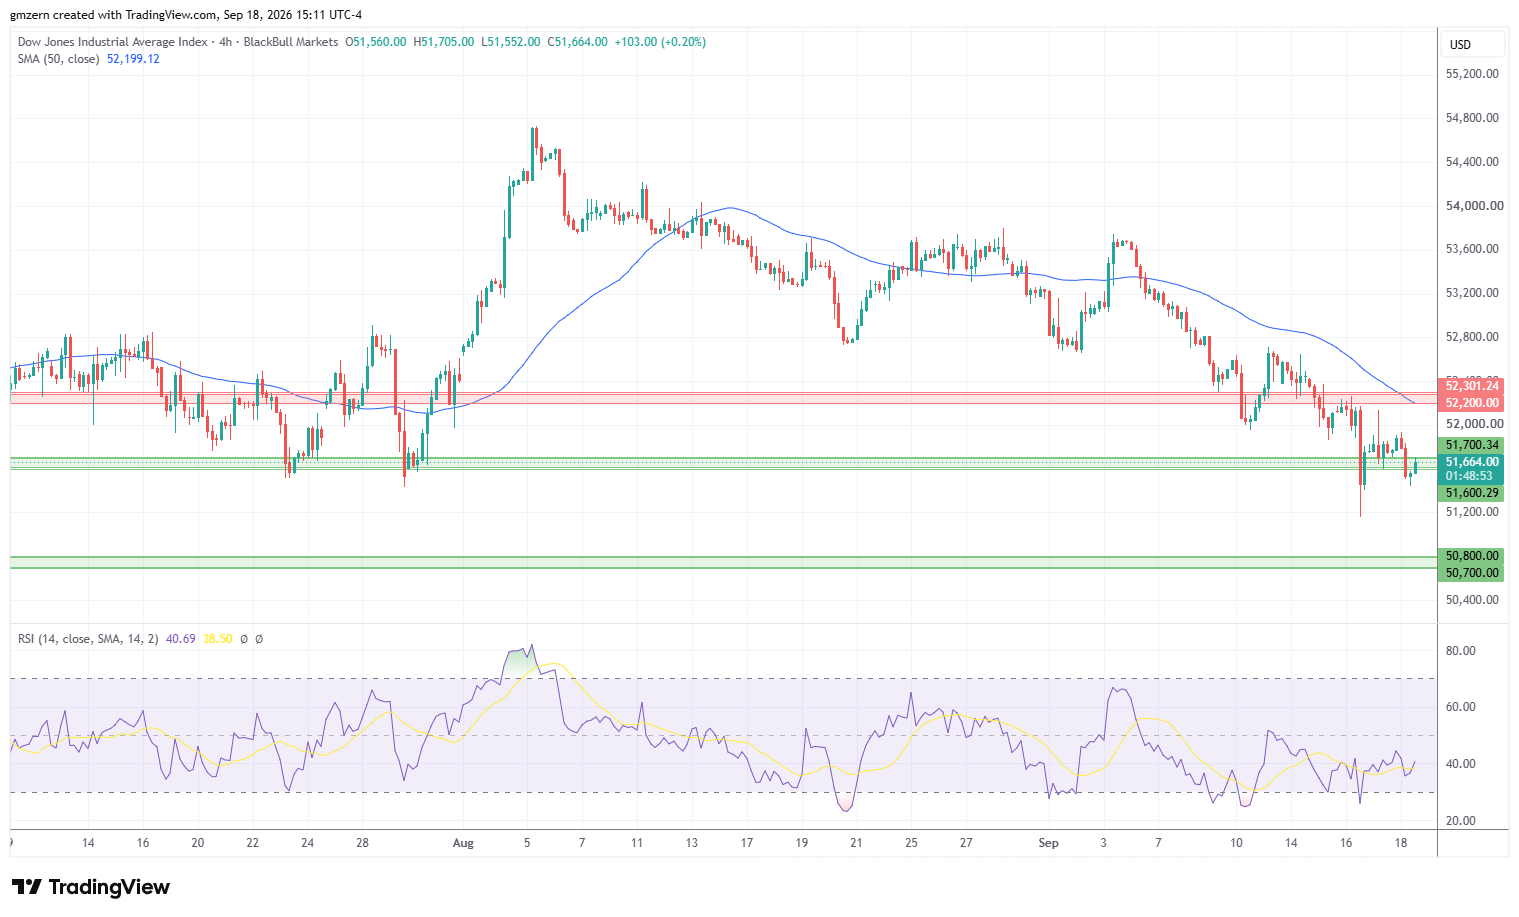
Currently, Dow Jones is trying to settle below the support level at 51,600 – 51,700. In case this attempt is successful, Dow Jones will head towards the next support level at 50,700 – 50,800. On the upside, a move above the 51,900 level will push Dow Jones towards the nearest resistance level, which is located in the 52,200 – 52,300 range.
For a look at all of today’s economic events, check out our economic calendar.