


Gold & Silver Outlook: Softer Dollar and Oil Offer Relief as Markets Digest Hawkish Fed
Gold and silver should get a boost on Friday after major banks adjusted their forecasts higher for both metals following the Fed’s rate increase. Energy prices, the dollar, and the yield curve have all eased since Wednesday’s FOMC announcement, taking some pressure off precious metals.
The FOMC voted to increase their target range by 25 basis points to 3.75% – 4.00%. With 16 of 18 policymakers projecting another rate increase by the end of the year, and Warsh’s emphasis on the “core” inflation being above the 2% target, the market has priced in at least one more rate hike this year, and expects the Fed to remain hawkish.
Longer-dated U.S. Treasury yields and the dollar have eased since the FOMC announcement, with the 10-year U.S. Treasury yield falling to 4.96% on Friday. Reduced yields and a eased dollar ease some of the headwinds for gold and silver. Easing energy prices and the 2-year/10-year Treasury inversion should also be bullish for metals.
There are a few other variables to discuss. First, Saudi Arabian officials have said they will increase crude oil shipments through the Strait of Hormuz. As a result, oil prices are down, and the supply concerns have eased. Additionally, lower oil prices mean less of a chance that the current conflict in the Middle East would cause a large increase in inflation. The Federal Reserve would then be forced to raise interest rates even more.
Also following the trends in the U.S. dollar and bond yields, silver has the potential to increase in price. However, like with gold, the negative effect of rising interest rates on the economy and industry will hurt the price of silver.
The price of gold and silver will also be hurt by the Fed, if the expected Central Bank meetings in October and December result in rate hikes.
Overall, I am neutral to slightly bullish on gold and silver in the short term, as the price of oil and other commodities, as well as bonds and the U.S. dollar, will also help the price of gold and silver rise.
Gold Technical Analysis: XAU/USD Breaks Descending Trendline as $4,403 Becomes the Next Upside Test
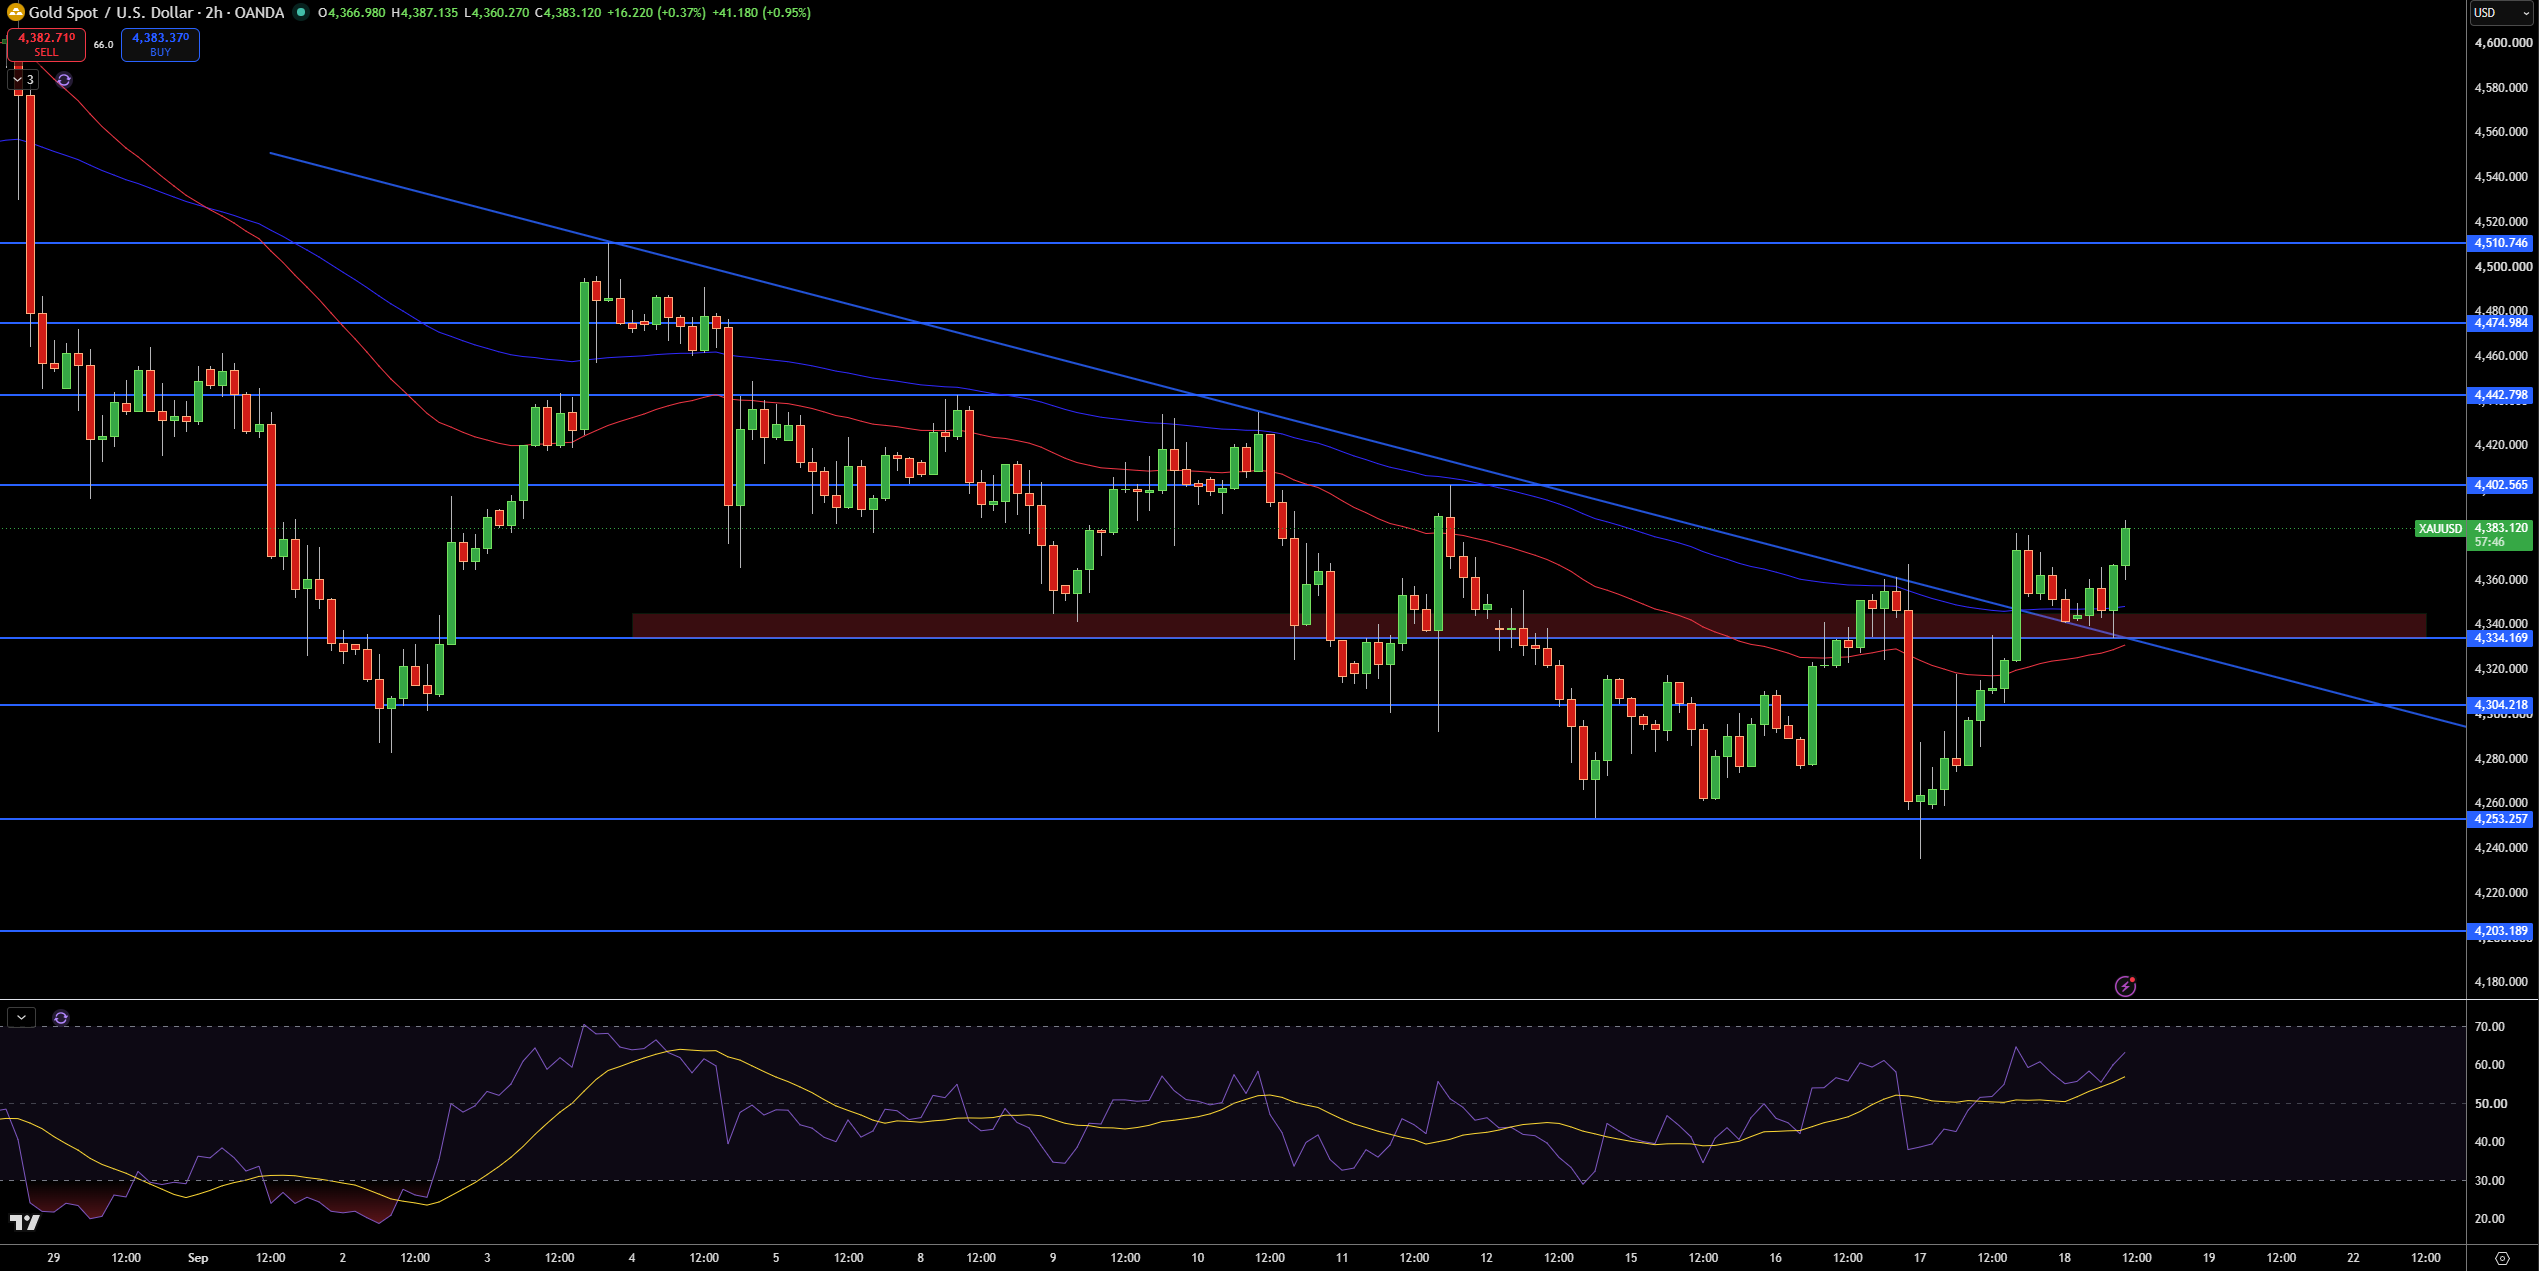
Gold is currently trading at $4383.41 after breaking and rising above a descending trendline and a support zone at $4334.25. The bullish move began after a correction to $4253.31 and $4283.19. The shorter-term moving averages and the trendline provided support, and the bullish structure is now dominating.
I am looking for a possible rally towards $4402.81 and $4443.19. The support zone at $4334.25 is now the first major support level. The zone at $4253.31 and $4283.19 come into play as support if the rally fails.
The RSI is also supporting the bullish structure, currently at 53. A break above $4334.25 and the trendline should be supported and elevated by the bullish structure, barring an excessive overextension.
Gold Price Forecast
Every new Gold analysis as it publishes, today's technical signal and key levels, live price — on one page.
See all Gold forecastsSilver Technical Analysis: XAG/USD Clears $65.64 as $67.24 Comes Into Focus
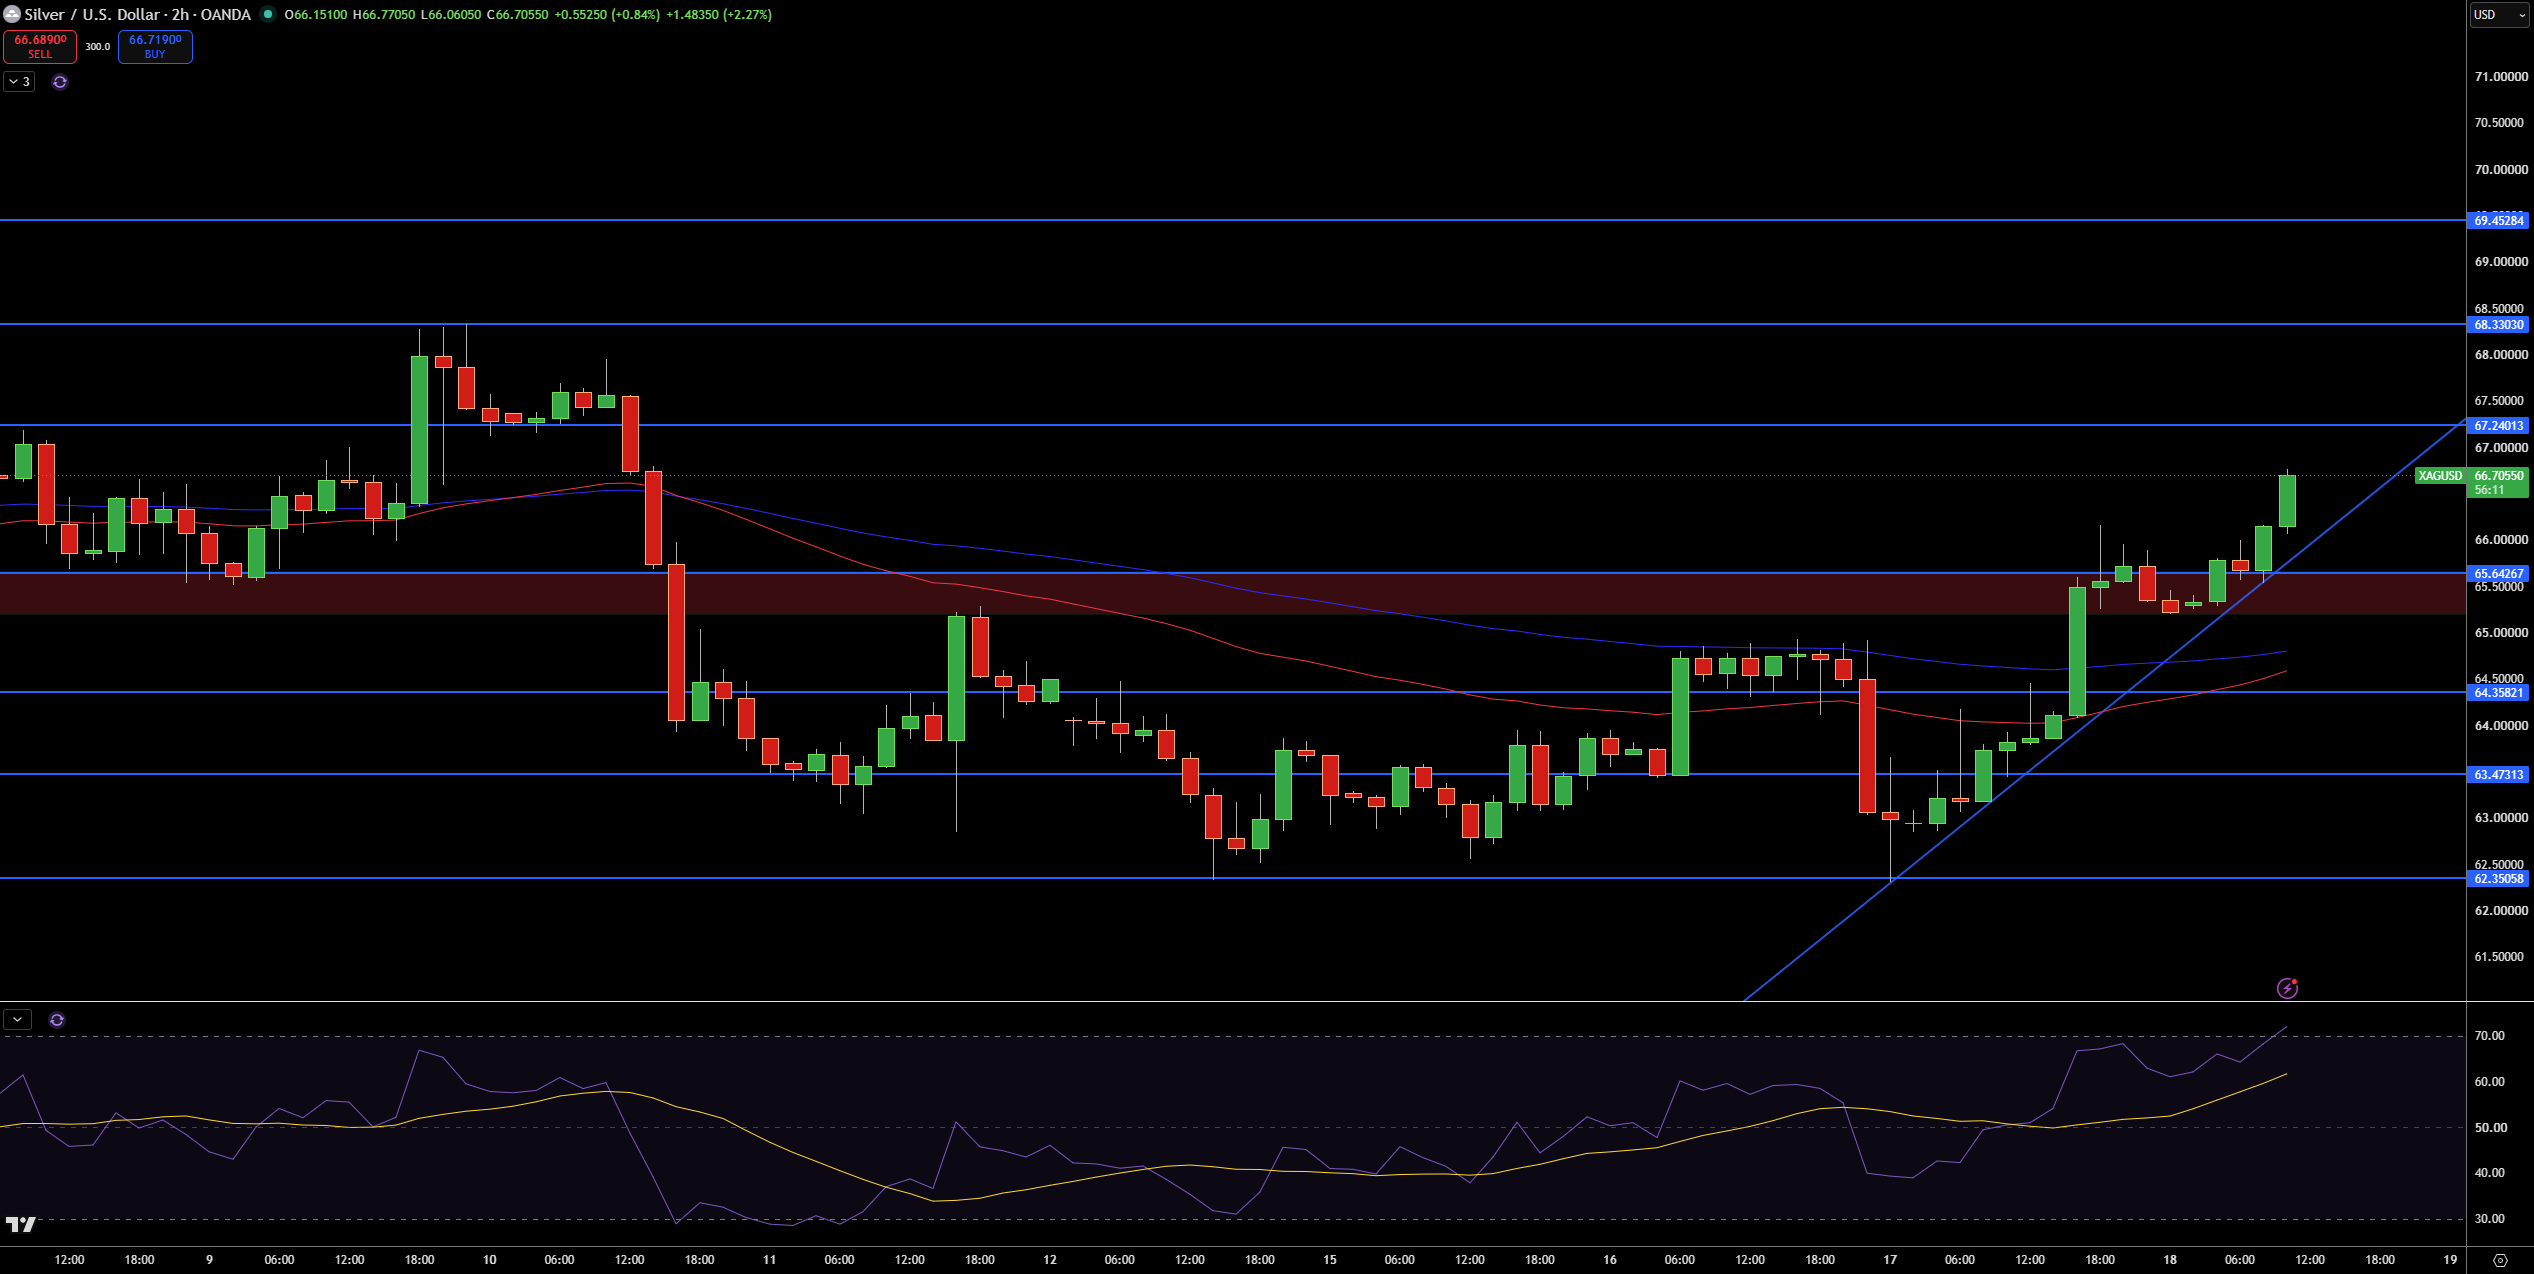
Silver is currently trading at $6671.09. After breaking above $65.64, it is continuing its upward move beyond the 200-SMA and 100-SMA. A rising trendline also provides support. The rising trendline and the two moving averages supported Silver in the 200-SMA and 100-SMA area.
I am looking for the first signs of movement at $67.24. If we see an excellent outside candlestick here, we could see $68.33 and $69.45 in relatively quick order. For the short-term, $65.64 is very important support and a loss of this level could test $64.36 and then $63.47.
RSI is showing the presence of overbought conditions. While this indicators generally means that we could see a correction, I am looking for price action to support this. Again, I will focus on the shorter term outlook and look for prices above $65.64 and the rising trendline. A move and close below $64.36 would see me look for further losses. A move above the previous resistance at $67.24 would support the case for a run to $68.33.


