
Dollar Index Outlook: Fed Tightening Supports Dollar as BoE Turns Hawkish and ECB Urges Patience
This Friday’s Dollar Index looks strong due to several central bank policies. First, the Fed raised interest rates this week and shows more hikes are likely. Meanwhile, the Bank of England (BoE) is becoming more hawkish, and the European Central Bank (ECB) is encouraging more patience before any policy changes.
The U.S. dollar and forex markets have been largely Federal Reserve focused this week. After raising its base rates by 25 basis points to the 3.75% – 4.00% range, the greenback consolidated as oil and equity markets retraced. Nonetheless, the CME Group’s Fed Funds rate tool shows a 95% probability of a fourth rate hike next month.
The U.S. Dollar Index (DXY) is also contending with declining energy prices. While the recent BOJ 50 basis point rate hike was unsuccessful in weakening the dollar, the split vote suggests further Japanese monetary policy tightening will be gradual, easing inflation concerns. Meanwhile, the ECB is signaling patience.
ECU policy is becoming harder to read. The ECB lifted its deposit rate to 2.50% last week. Vujcic, however, noted that further rate hikes are not certain. Higher inflation expectations do not necessarily mean further hikes are warranted. According to him, policymakers will look at other data, including growth and economic activity. The markets, however, expect further rate hikes.
The Bank of England also met this week. Three members of the MPC also voted to raise rates this week and bring them to 4.00%. The Bank also withdrew its guidance which included its expectation of inflation of 4% in early 2023. Governor Andrew Bailey did not rule out further rate hikes if energy costs remained elevated.
The Bank of England also extended the tenor of its gilt purchases to 6 months from the time of writing. This was expected to ease gilt market illiquidity.
Fundamental bias: EUR expected to appreciate vs. USD, GBP expected to appreciate vs. USD.

U.S. Dollar Index Technical Analysis: DXY Holds 100.19 Support as 100.37 Breakout Stays in Focus
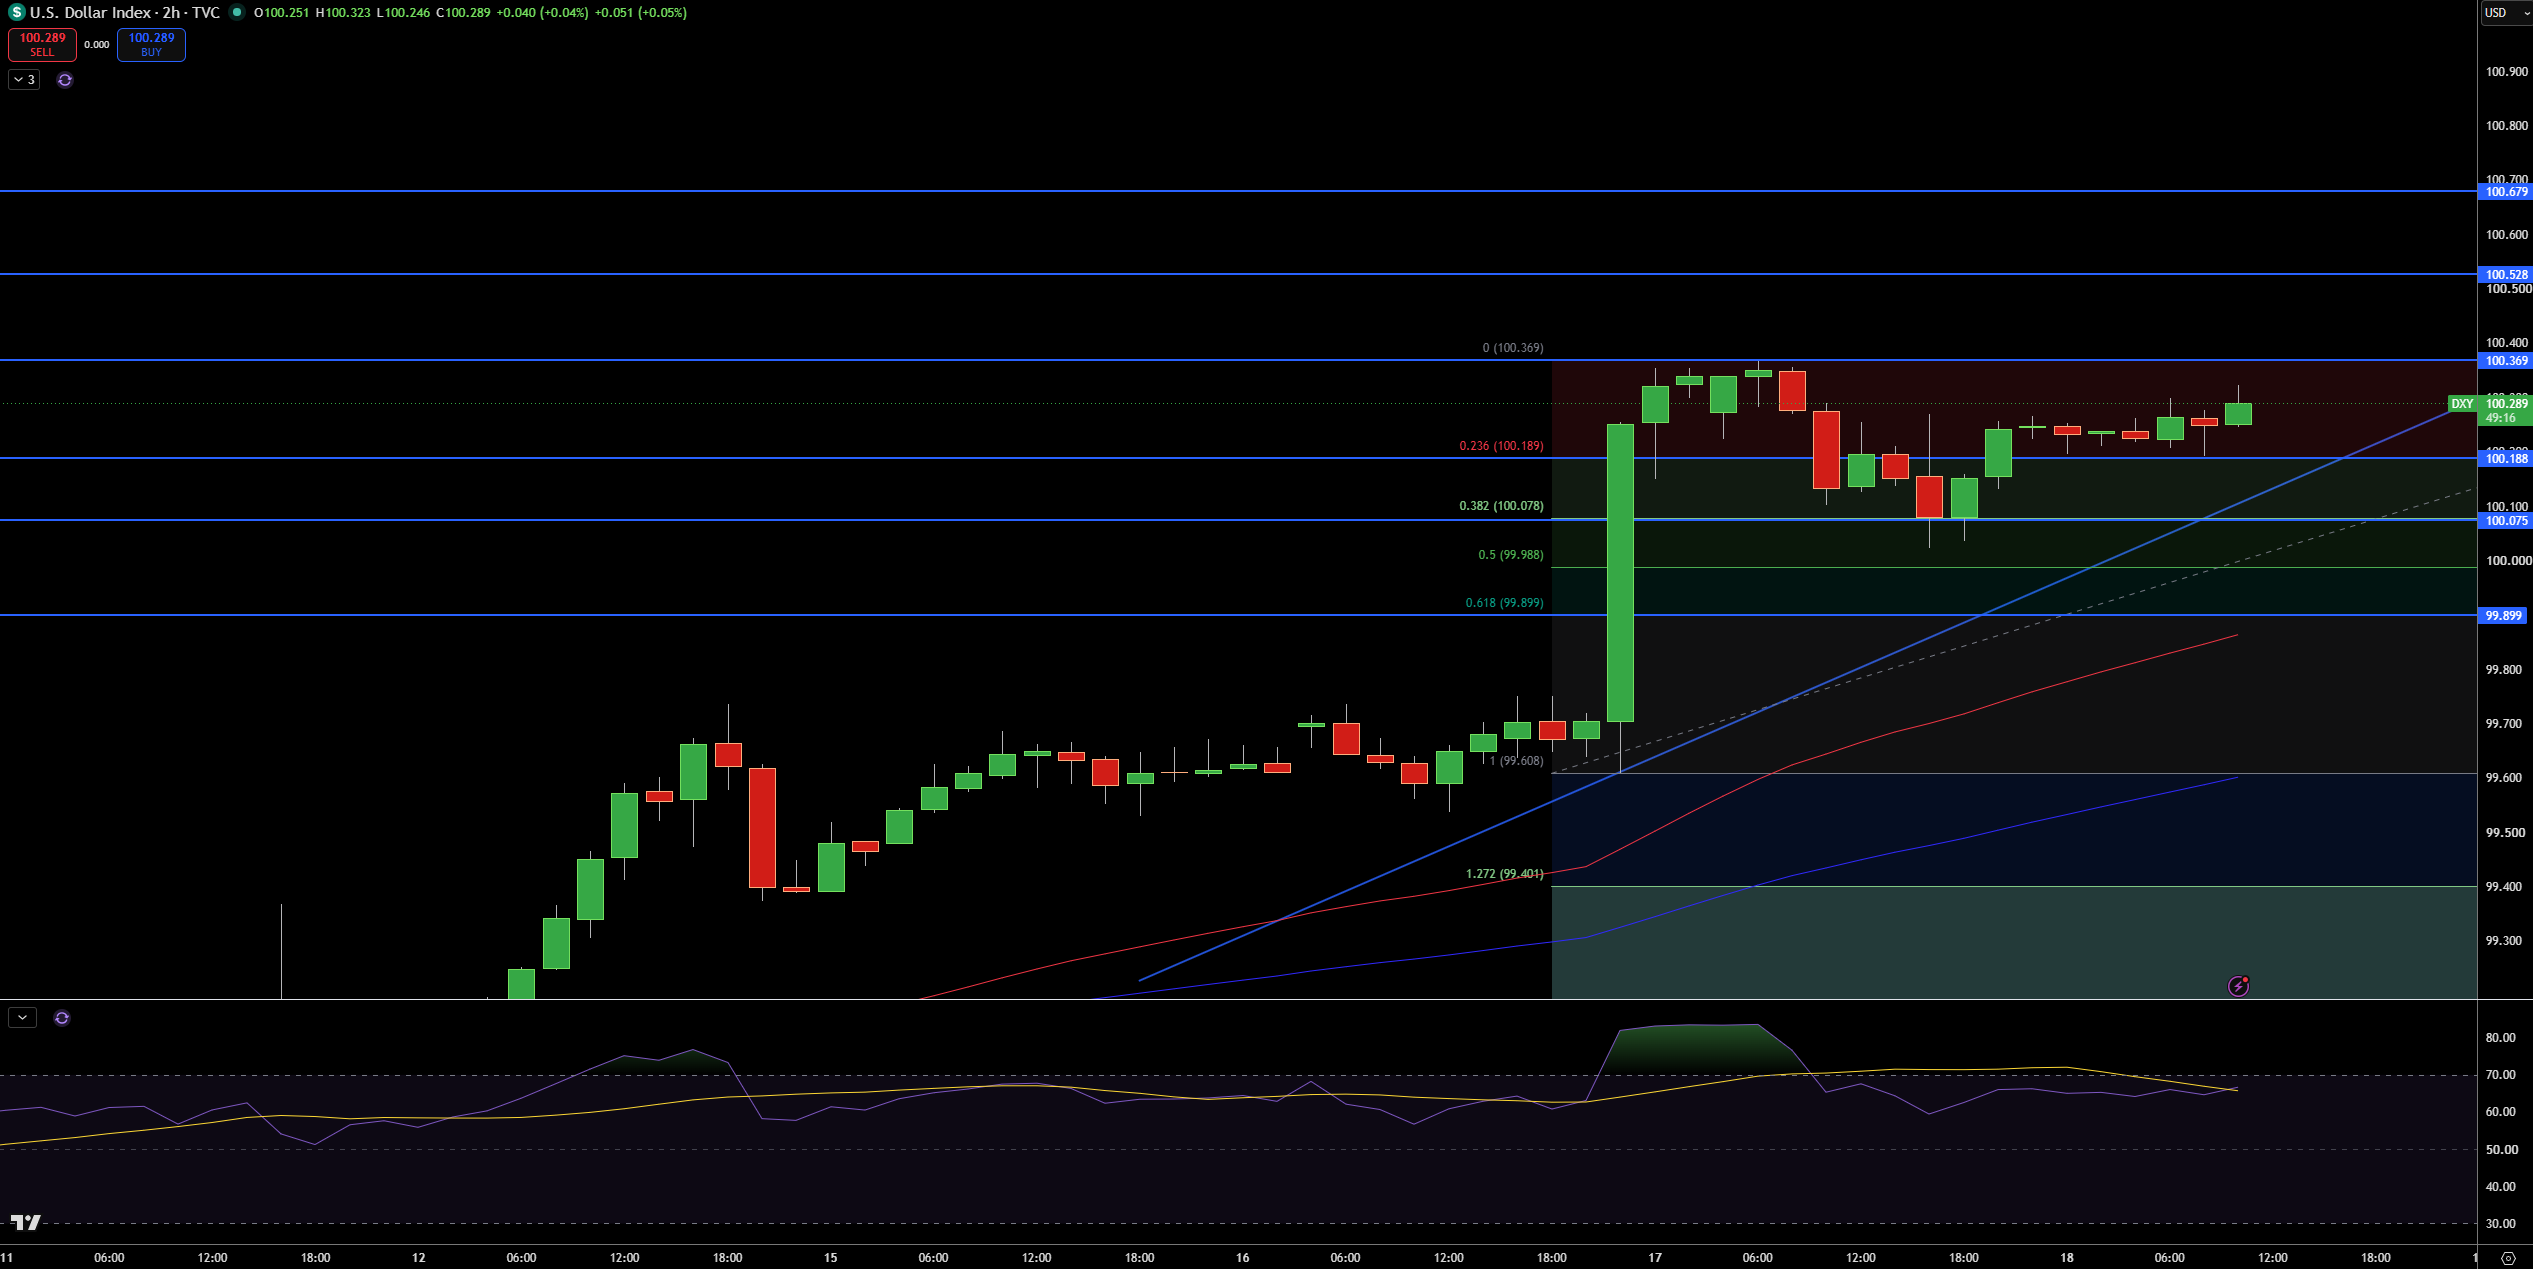
The U.S. Dollar Index is currently trading at 100.29 on the 2-hour time frame. Price has formed a consolidation pattern just below the 100.37 resistance level. A breakout above the 100.37 level may open the way to 100.53 followed by 100.68.
For now, I will consider 100.19 as a floor level for the consolidation. In case of a further extension of the consolidation, the 100.08 and 99.99 levels may gain support levels.
The Relative Strength Index (RSI) has eased from its overbought levels and is currently at 55. I will consider a break below the 99.99 level as a bearish invalidation level. A confirmatory close above 100.37 would allow the bullish setup to gain more strength.
EUR/USD Price Forecast
Every new EUR/USD analysis as it publishes, today's technical signal and key levels, live price — on one page.
See all EUR/USD forecastsGBP/USD Technical Analysis: Sterling Tests Descending Trendline as 1.3377 Resistance Caps Recovery
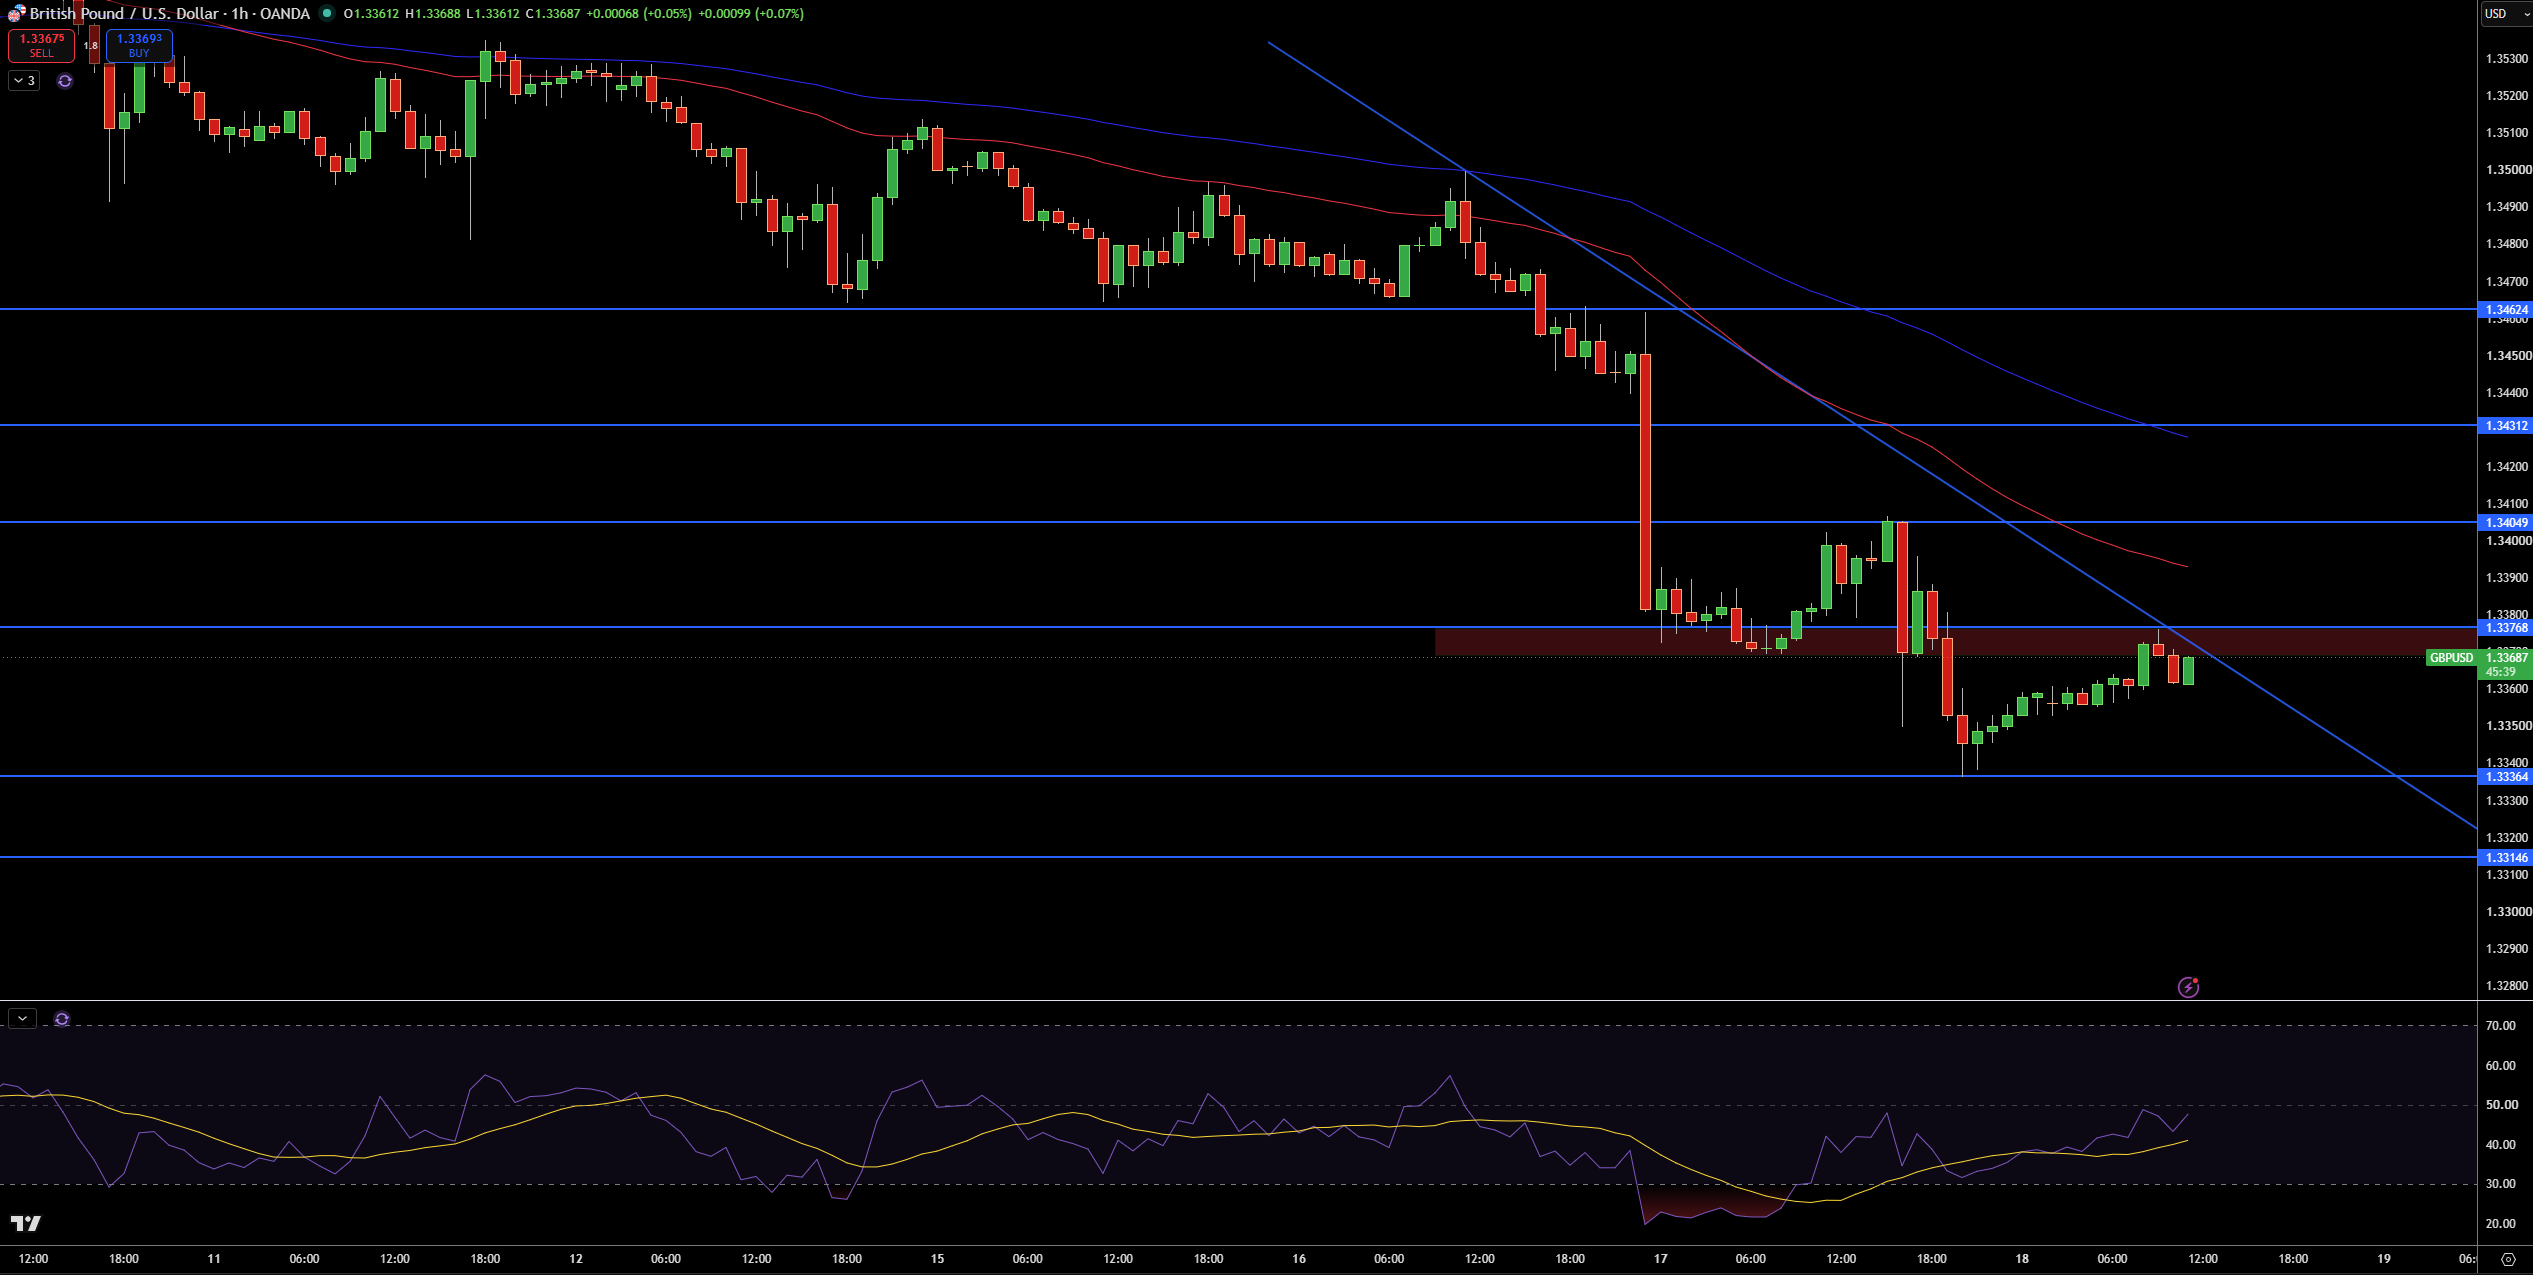
The British Pound is currently trading at 1.3369 against the US Dollar and is currently encountering the 100 and 200 SMA as well as the descending trendline as it recovers from the 1.3336 support. From a technical analysis standpoint, this means that while the short term outlook has improved for the British Pound, the U.S. Dollar has the upper hand in the overall trend.
1.3377 is the first major resistance level and is a short term target for the British Pound. Beyond 1.3377 is the 1.3405, 1.3431, and 1.3462 levels. Should support at 1.3336 hold and the British Pound make a further recovery, the 1.3315 level is the next major support.
RSI is also returning to a neutral level which supports the GBP/USD short term trend. Until the British Pound breaks the descending trendline and 1.3377, it should remain in a downtrend. Should it break 1.3405 in the short term, it could improve and break even 1.3377. Breaking 1.3336 in the other direction is bearish.
EUR/USD Technical Analysis: Euro Struggles Below 1.1491 as 1.1456 Support Remains Vulnerable
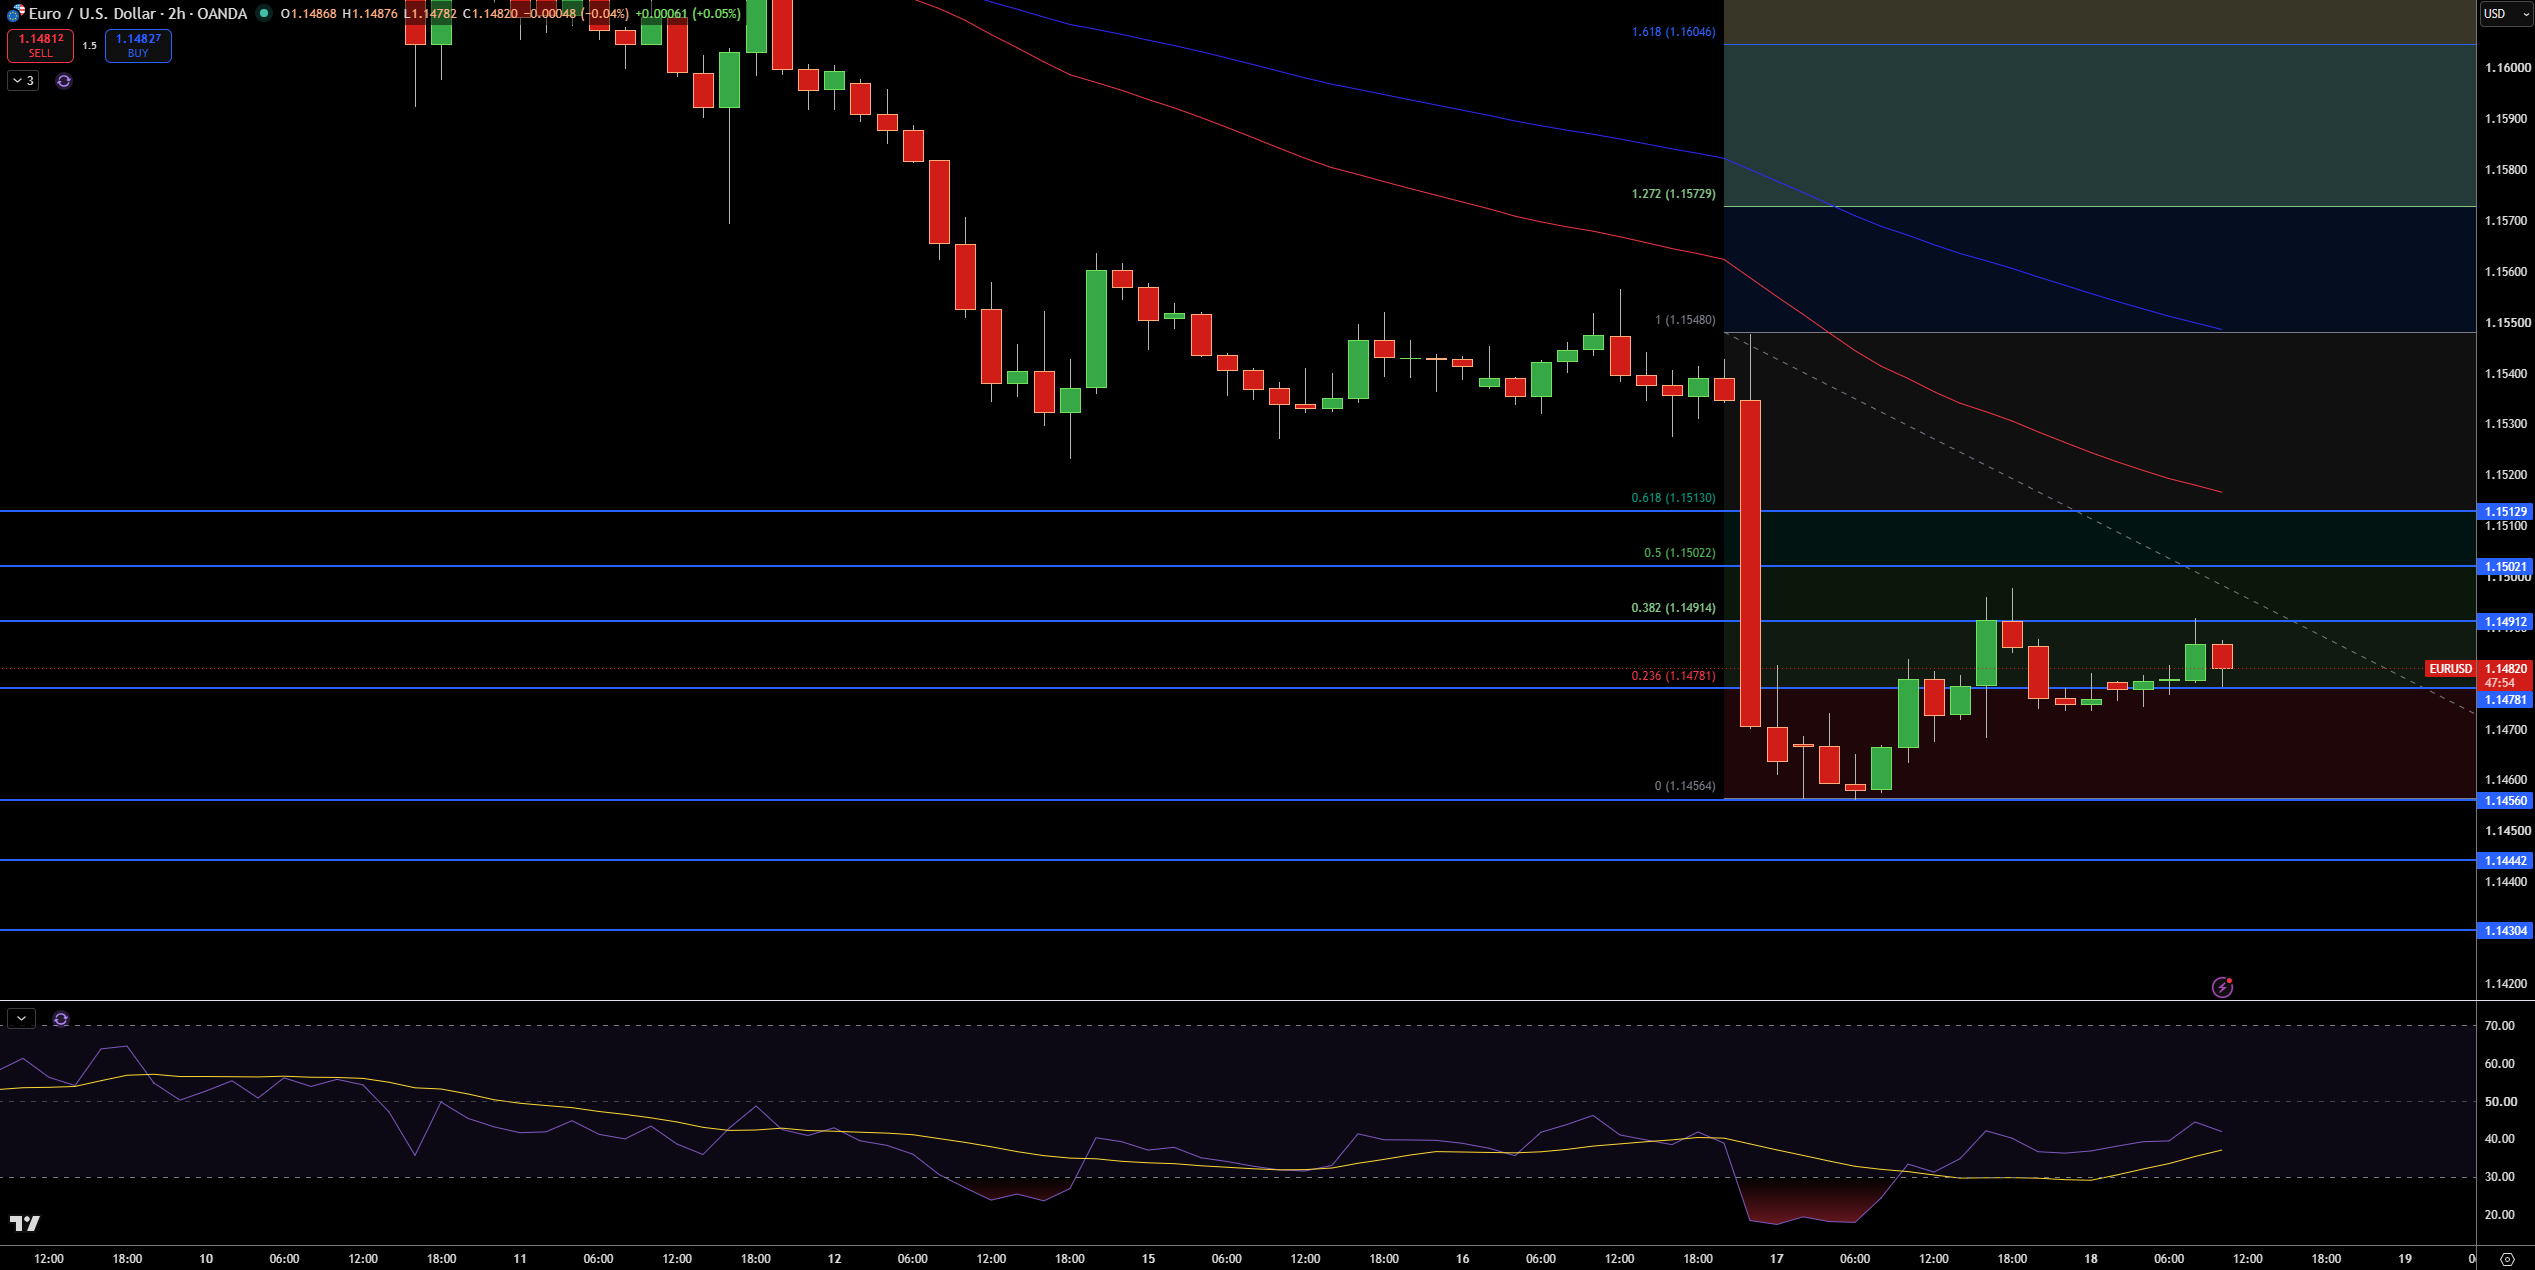
EUR/USD has recently traded at 1.1482. It is currently in a major down trend and is testing the 1.1456 support level. The current price is well below both the 100 and 200 SMAs. The over arching bearish trend of lower highs and lower lows is still intact. The rebound from 1.1456 has run into immediate resistance at 1.1491.
I am looking for the price of EUR/USD to eventually break and close below the 1.1456 support level. 1.1430 and 1.1444 are support levels that should also be of interest. There is resistance at 1.1502, 1.1513, and 1.1548.
RSI is still trending lower and is still in a downtrend. I am looking for the price of EUR/USD to eventually break and close below 1.1456. This would negate the potential for a trend reversal. From a bearish perspective, I would like to see a close below 1.1456. A close above the 1.1513 resistance would negate the bearish outlook.