


USOIL, UKOil & Natural Gas Outlook: Saudi Supply Fears Ease, but Hormuz and LNG Risks Persist
On Friday, oil fundamentals appeared balanced. Rerouted and restored Saudi Arabian oil shipments eased worry about a supply shortage in the short term, but shipments are still at risk due to damaged infrastructure and restricted Gulf shipping.
Repair efforts on the East-West pipeline are expected to take four to six weeks, and industry experts say it may be months before the pipeline fully resumes normal operations. Meanwhile, Saudi Arabia has increased its shipments using other oil shipment routes to ease concern about supply shortages in the market. Restrictions in the Strait of Hormuz remain. On Thursday, only four cargo ships transit the Strait of Hormuz, down from six the day before. The 10-day average for ship transit through the Strait of Hormuz is 16 ships. Before the conflict with Iran, the Strait of Hormuz accounted for approximately 21% of total international oil and gas shipments.
Demand is becoming an important factor in global oil markets. According to J.P. Morgan, global oil consumption is approximately 4.4 million barrels lower than last year, allowing the market to absorb the loss of Middle Eastern oil without significant draw downs on oil stocks.
In the global natural gas market, conditions remain tight. With below average natural gas storage heading into the winter in Europe, and restrictions on the flow of oil through the Strait of Hormuz, international competition for natural gas has increased. Shell has estimated that the loss of natural gas due to the war has been approximately 36 million tons. With Asia and the Middle East relying on natural gas, Europe is increasingly dependent on natural gas from other suppliers, and has resorted to increased purchases of natural gas on the global spot market.
We have a moderately bullish view of oil for both the U.S. and UK, as well as a moderately bullish outlook for natural gas.

Natural Gas Technical Analysis: NG Holds $2.84 Support as $2.91 Resistance Limits Recovery
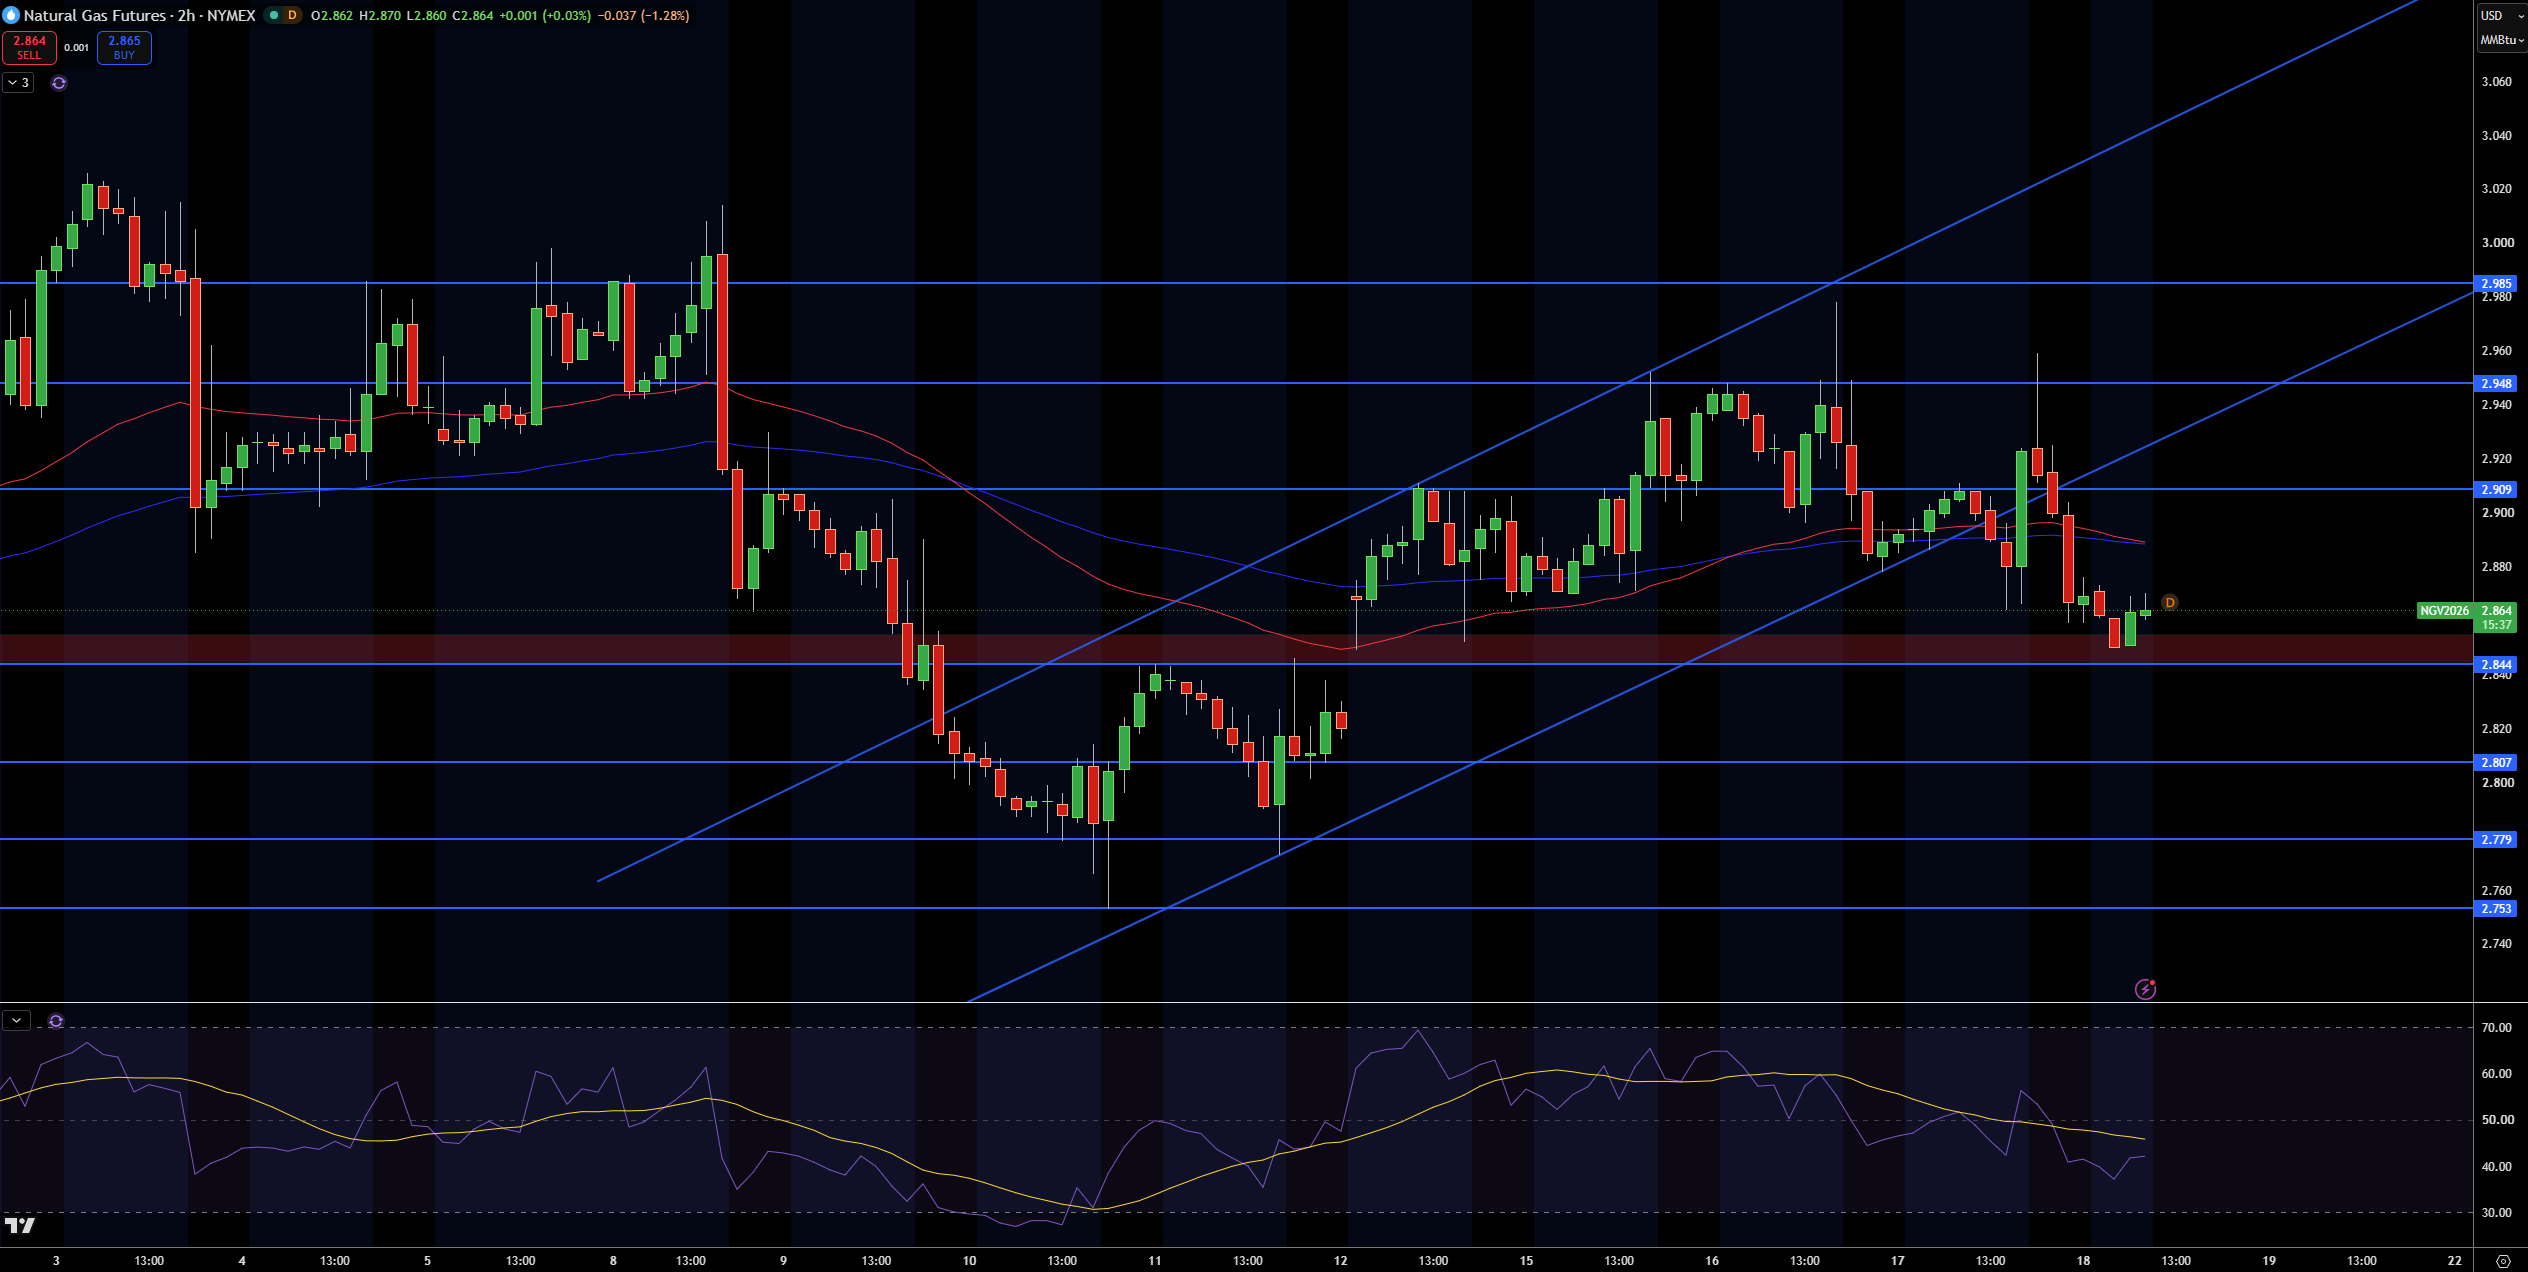
Natural gas is trading at $2.86 on the 2 hour chart, falling from an uptrend and both of the moving averages. In this case, I see that the $2.84 level is still providing support, but many tests of the $2.91 level show that the trend is still bearish.
The level that I am focused on is $2.91. A break above that would bring the focus to the $2.95 level, and eventually $2.99. The $2.84 level provides support, and a break below that focuses on the levels of $2.81, $2.78, and $2.75.
The RSI still shows a bearish trend, but shows an improvement from before. Because of this, along with the current trend, I am bearing a bearish bias. A move above the $2.91 level would show that the trend is improving, and a move below the $2.84 level would show that the trend is still bearish and focusing on the $2.78 level.
Natural Gas Price Forecast
Every new Natural Gas analysis as it publishes, today's technical signal and key levels, live price — on one page.
See all Natural Gas forecastsWTI Crude Oil Technical Analysis: USOIL Tests $95.42 Support as Breakdown Risk Builds
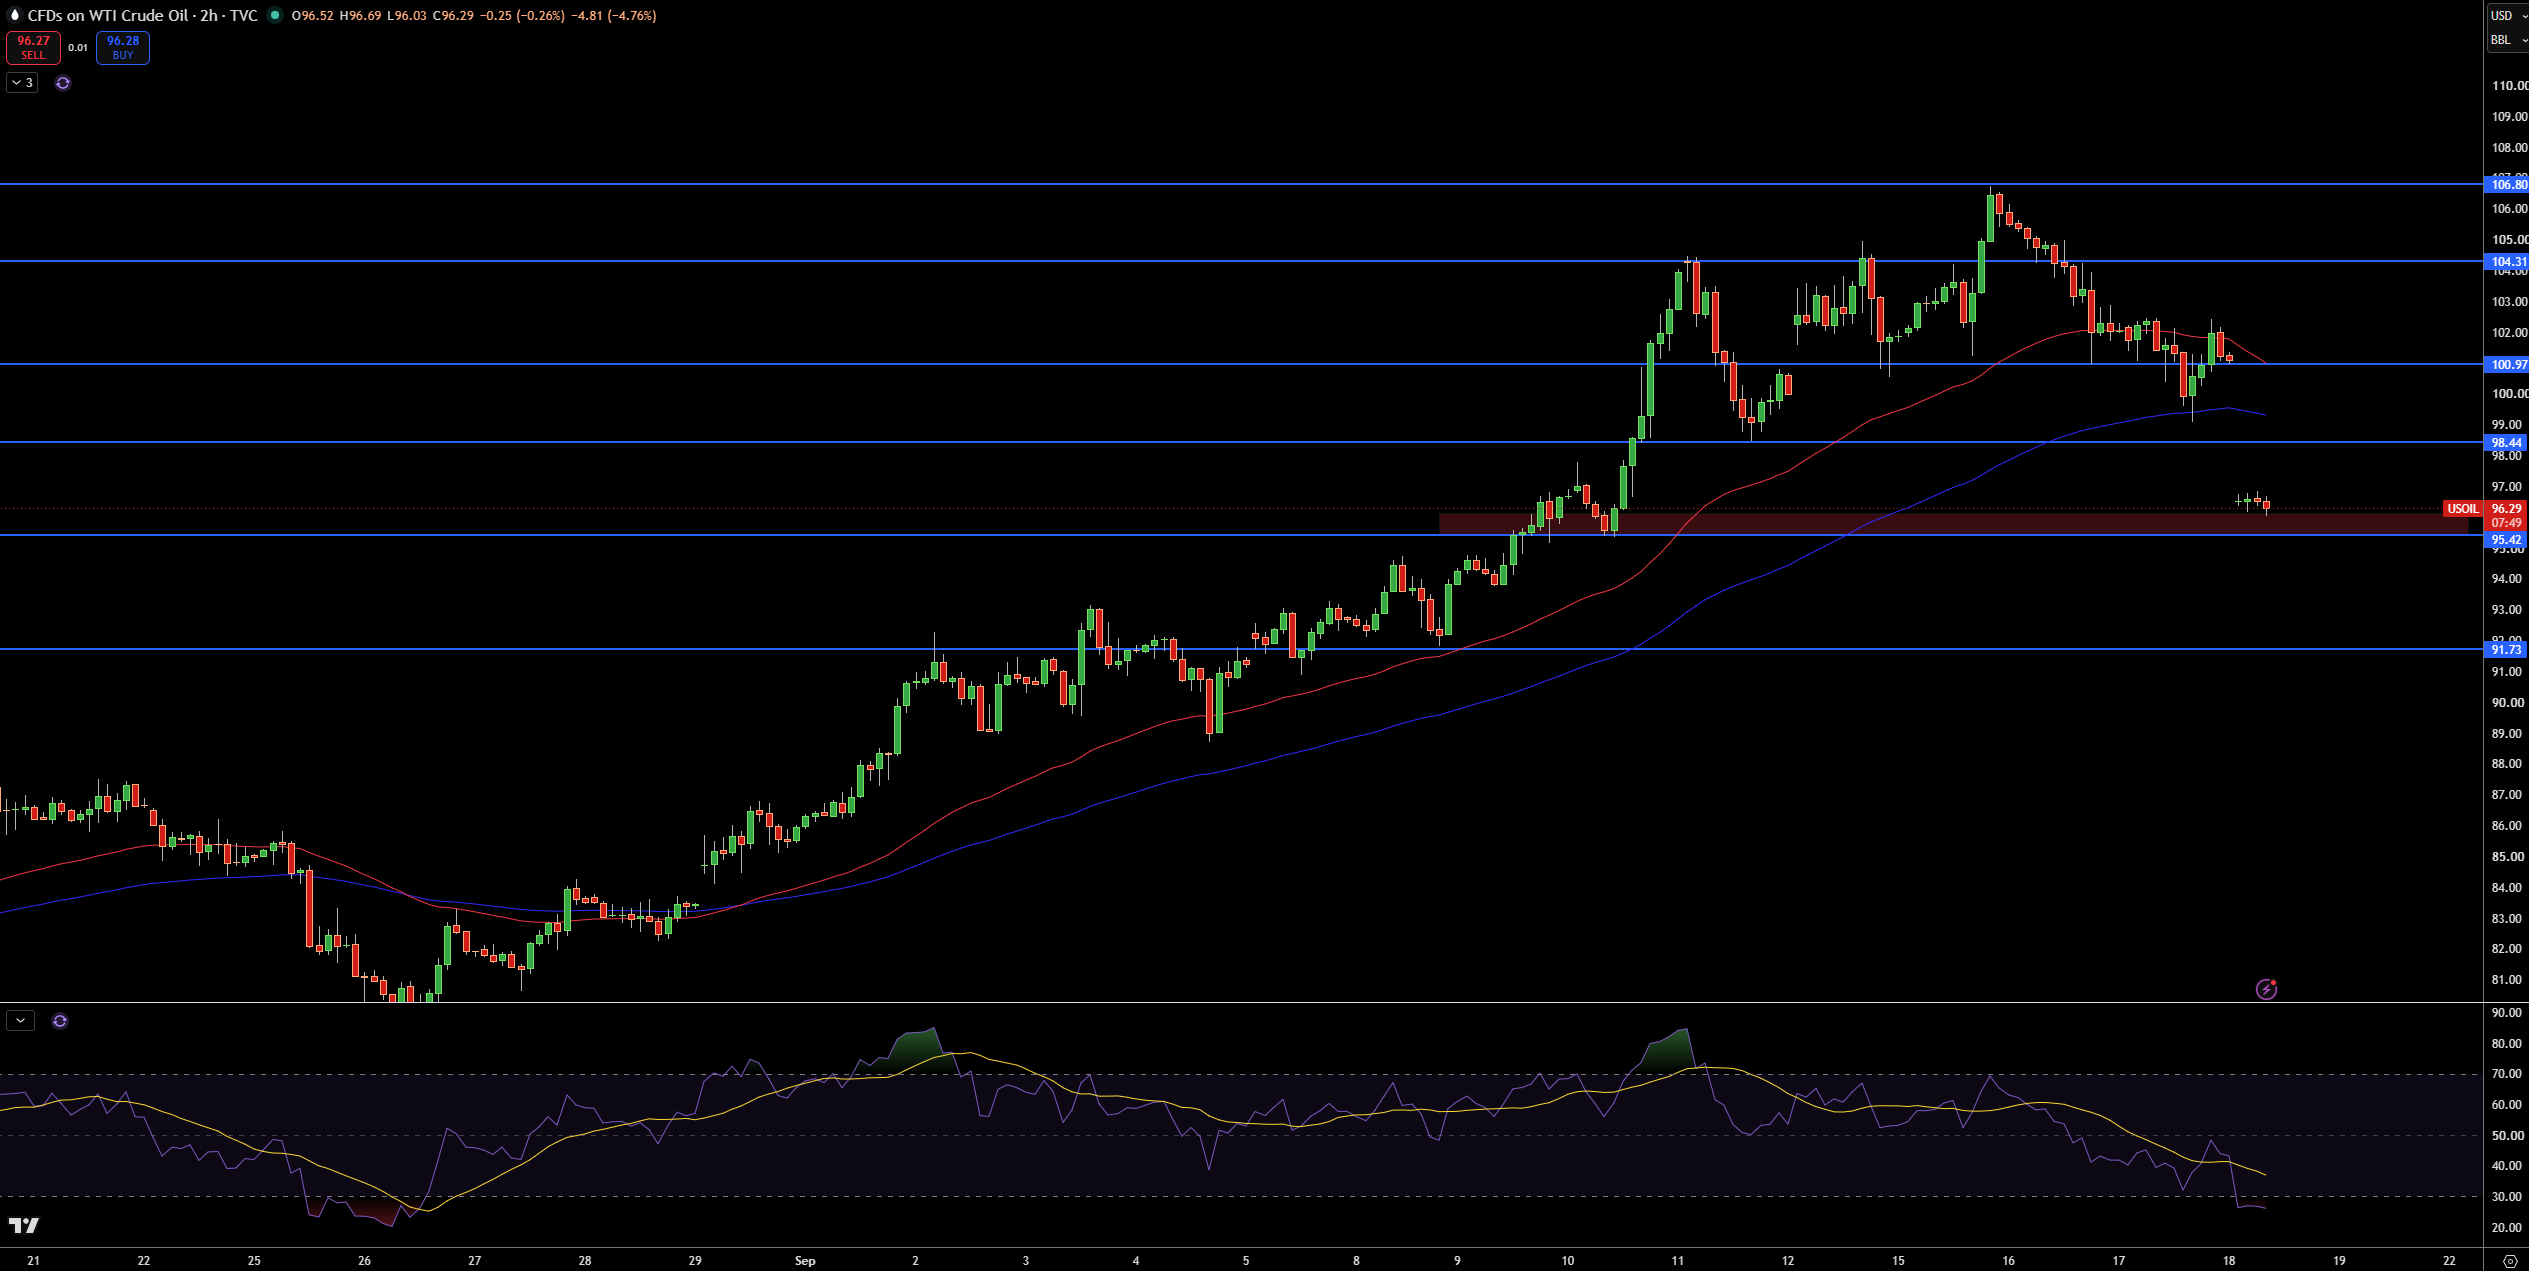
WTI crude oil recently broke support from the rising trendline and also broke below both the 50 and 200 hour moving averages. Recently, price also broke below the $96.50 area.
The latest decline has brought price to the $95.42 support level. Price has also broken a rising trendline from May that was also support. The recent bearish momentum has also pushed Price to a 200 day moving average which is also acting as a support level. With the $95.42 level being a “floor” for price in May, June and July, it could again provide support.
The Relative Strength Index is in oversold territory which may indicate a short term bounce. Given the recent breakdown, I expect further downside to bethe case. I will look for shorting opportunities on rallies to the $98.44 and $100.97 areas.
Depending on how price trades relative to the $100.97 area, I may also look to change my bias to more bullish if the $100.97 area is broken to the upside.
Brent Crude Oil Technical Analysis: UKOIL Pressures $103.26 as $101.58 Becomes the Next Downside Test
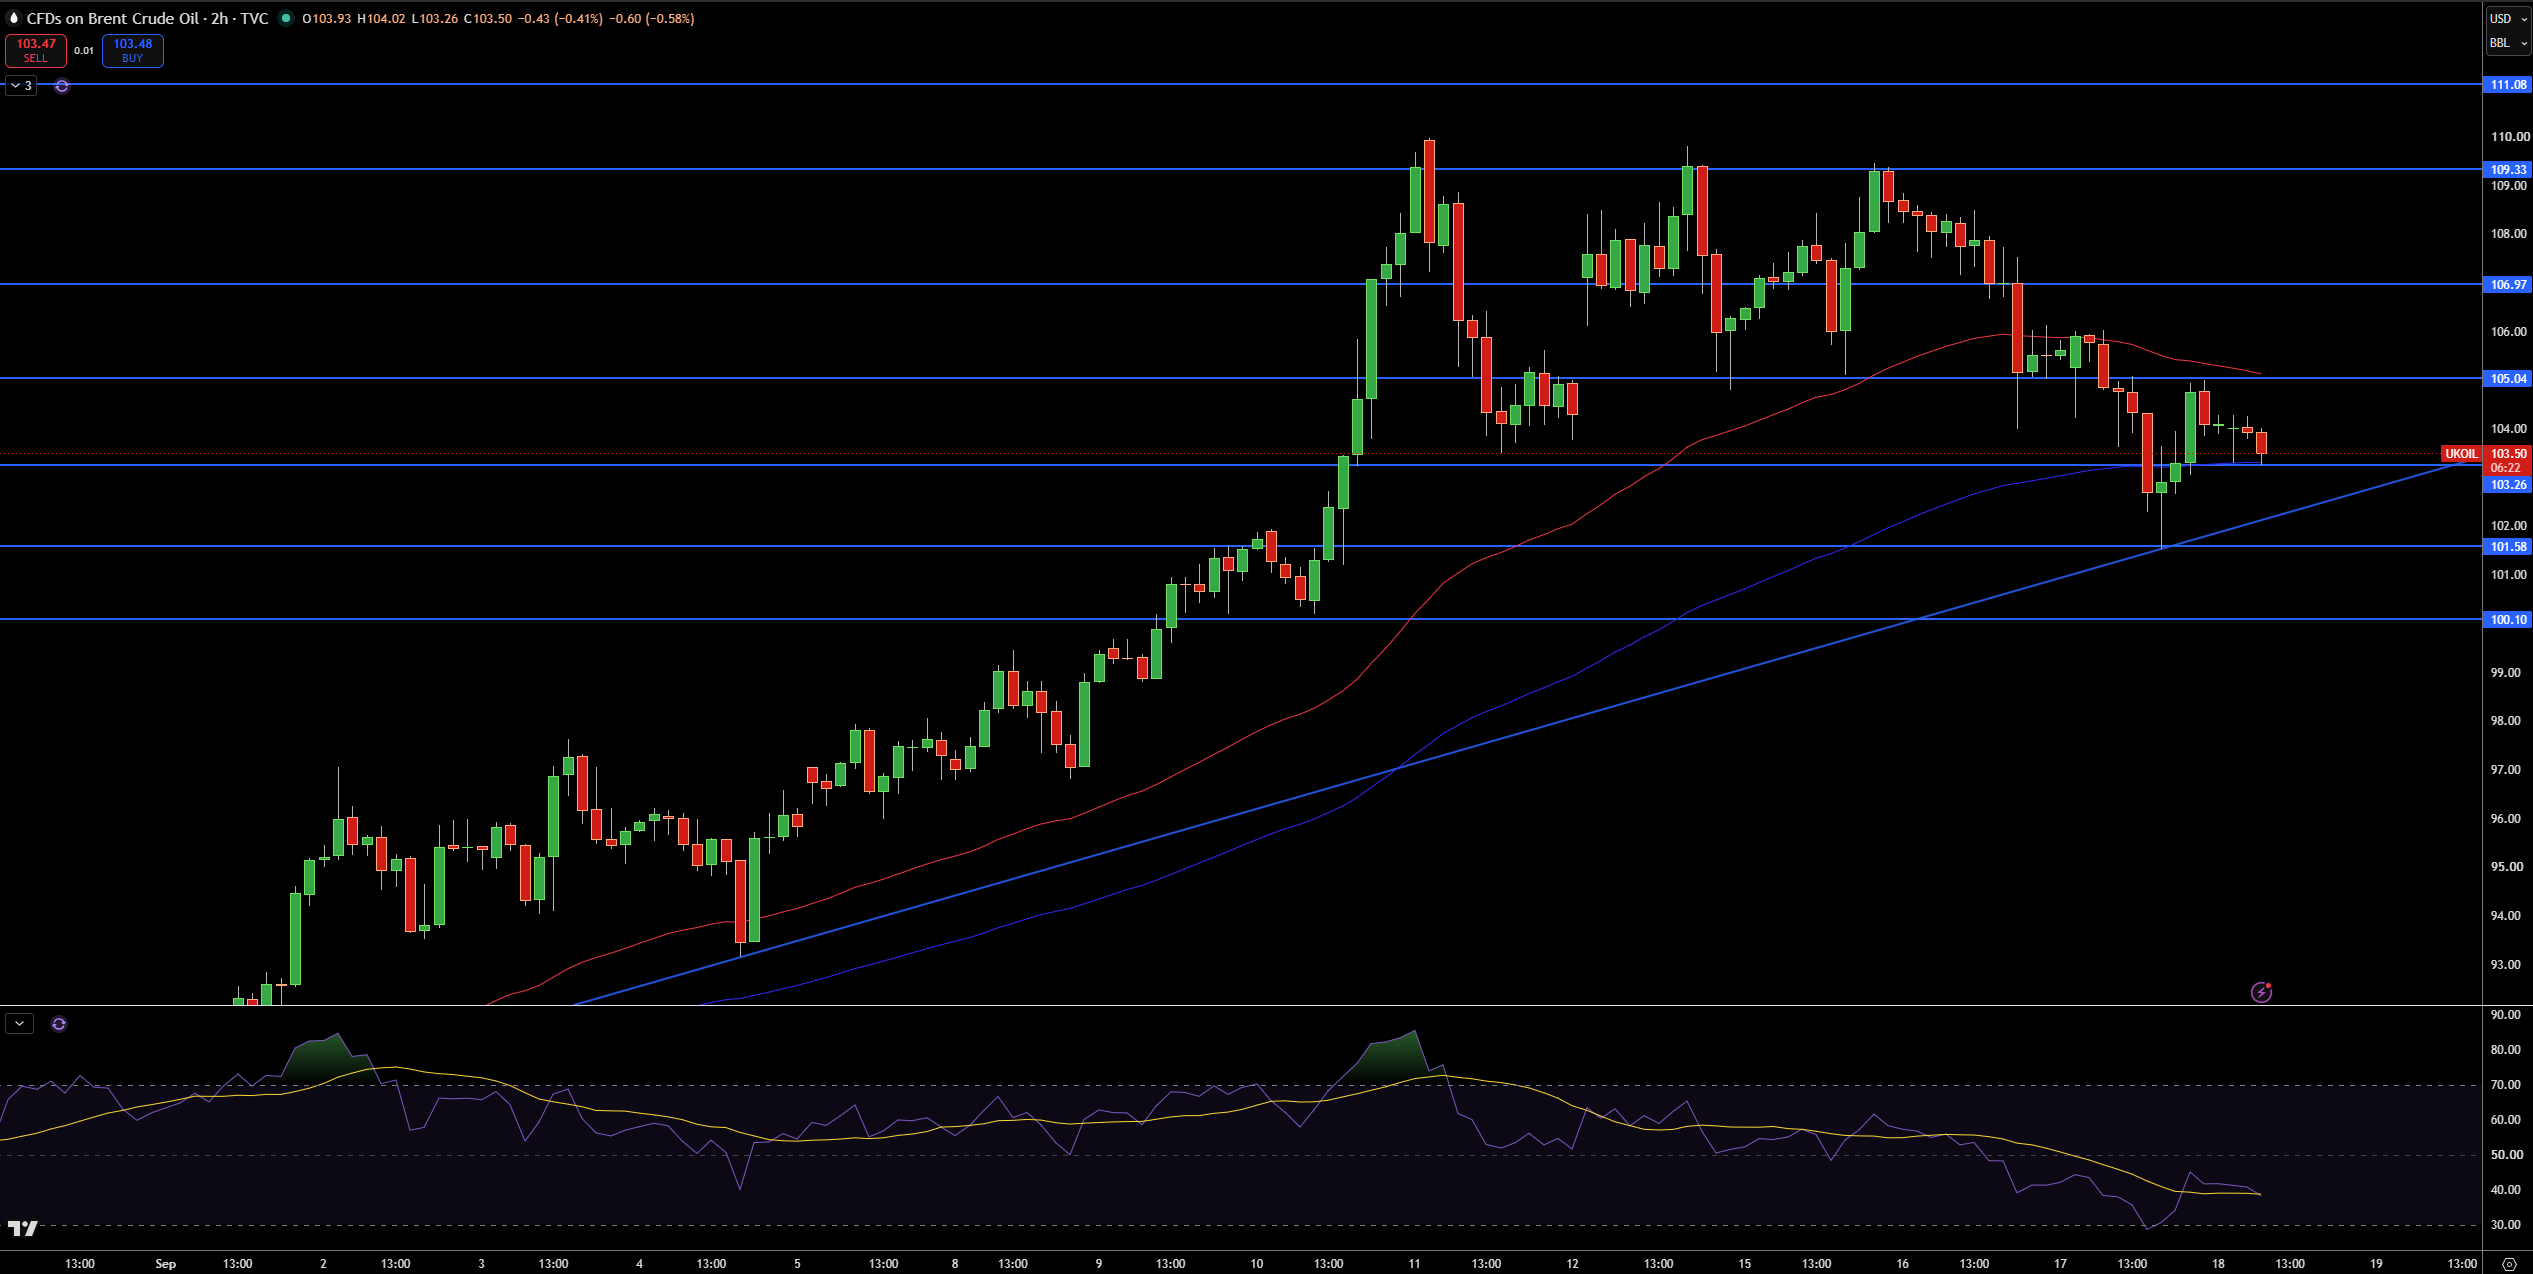
British crude oil is presently trading at around $103.50, and is moving towards the $103.26 region after breaking below the $105.04 support area and the rising trendline. The 100 period moving average is situated at $103.26.
Looking at the daily chart, we can see a series of lower highs starting from the $109.33 level. With this in mind, I am expecting more downside from the market in the short term.
Holding everything else equal, the $103.26 region should provide some support. The next significant supports are situated at $101.58 and $100.10. The $105.04 level should act as resistance in the near term. If we break above the $106.97 level, then the $109.33 level should also come into play.
RSI is also suggesting that the market is in over sold territory. All of the above mentioned factors give me a bearish bias to Brent crude, and I am expecting prices to move towards $100 in the near term. A break above $106.97 should negate this analysis.


