
Bitcoin Bull Flag Breakout Puts $93K Target in Focus
Since our July 1 and subsequent August–early September updates, we have tracked a potential five-wave impulsive advance from the July low using the Elliott Wave Principle. That structure remains intact. The daily chart now shows a high-probability completion of a smaller-degree fourth wave off the July 1 low, with price action shifting into a fifth-wave advance (gray wave v) whose ideal target zone sits between $85,200 and $94,500. See Figure 1 below.
Meanwhile, the recent consolidation should resolve as a classic bull flag (outlined in the black box on the chart), and the measured-move projection from the flagpole points toward approximately $93,000 as an ideal target. Combined with the fifth-wave Fibonacci and resistance confluence, the $85K–$95K region is the primary upside objective.
Figure 1: Bitcoin daily Elliott Wave count with technical indicators (StockCharts.com)
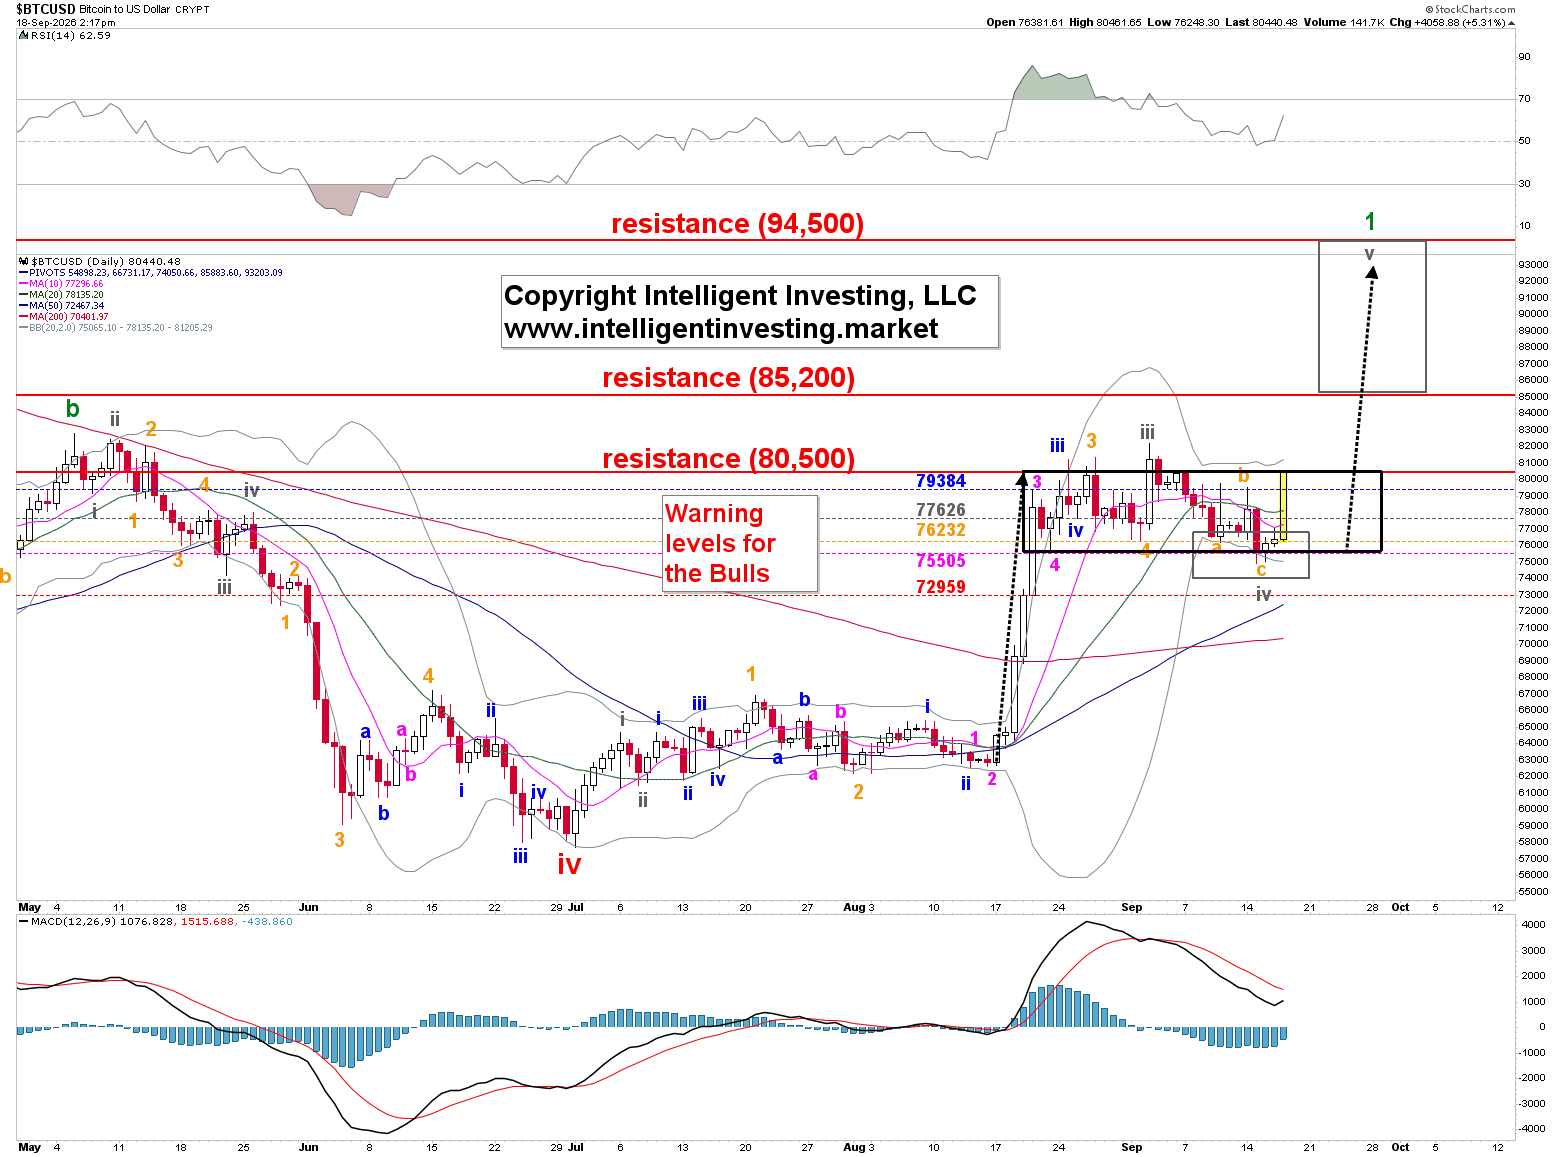
The gray wave-iv low appears to have been registered September1 5 at $74,955, which is near the $75,505–$76,232 support cluster. Today, price is now trying to break out of the flag with a strong daily candle, consistent with the start of gray wave v. As long as Bitcoin holds above today’s low, $76,248, which coincides with the 3rd warning level for the bulls at $76,232, the impulsive count stays valid. A decisive break of those levels would increase the odds that the current advance is still part of a larger correction rather than the start of a new cycle.

Five Waves Up from the July 1 Low Would Officially End the Bear Market and the Four-Year Cycle
As discussed in prior updates, if the potential five-wave sequence from the July 1 low completes as projected, it would confirm that an important cycle low was struck on July 1. That would mean the bear market that began after the prior cycle peak has ended prematurely and the long-followed four-year cycle is officially over. The next larger-degree targets would then open toward the $164K–$216K Fibonacci zone for the fifth wave of the new cycle. See Figure 2 below. In addition, 5th waves are often 1.236-1.382x the length of the prior same degree 4th wave, which would target $152-170K.
Figure 2: Monthly Elliott Wave count with long-term trade alert signals (Tradingview.com)
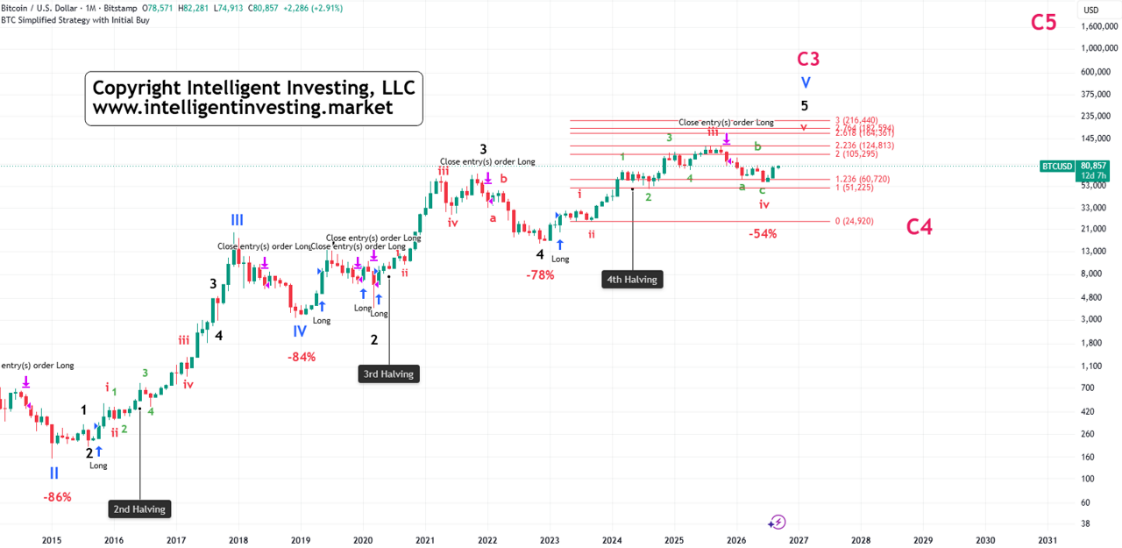
The immediate path of least resistance is higher provided the $79,384–$80,500 zone now acts as support. A clean break and hold above $81,300–$85,200 would further increase confidence in the $93K measured-move target from the completed bull flag and the broader $85K–$95K fifth-wave zone.
Bitcoin Price Forecast
Every new Bitcoin analysis as it publishes, today's technical signal and key levels, live price — on one page.
See all Bitcoin forecastsFailure to hold the warning levels, especially a close below $76,248, would force a reassessment of the impulsive count and reopen the possibility of a deeper correction before the larger third wave can develop. For now, the weight of the evidence—wave structure, flag completion, and momentum—favors the bulls targeting the $85K–$95K region in the weeks ahead.