


XLK Technical Analysis

The first chart I’m looking at is the XLK. It’s an ETF for technology, and it does look like it’s going to open slightly positive. We’re at the top of a range, and we have been bouncing from the 50-day EMA from time to time. So, when I look at this chart, it does suggest that perhaps we may try to rally from here.
We’ll just have to wait and see if we can clear the latest swing high closer to $192. It would more likely than not provide a little bit of comfort for the bulls. The rates dropping in the United States might help as well, as they are somewhat elevated. We did pull back from that 5% level on the 10-year multiple times here recently, so that at least is giving tech a little bit of a shot.

Oracle Technical Analysis
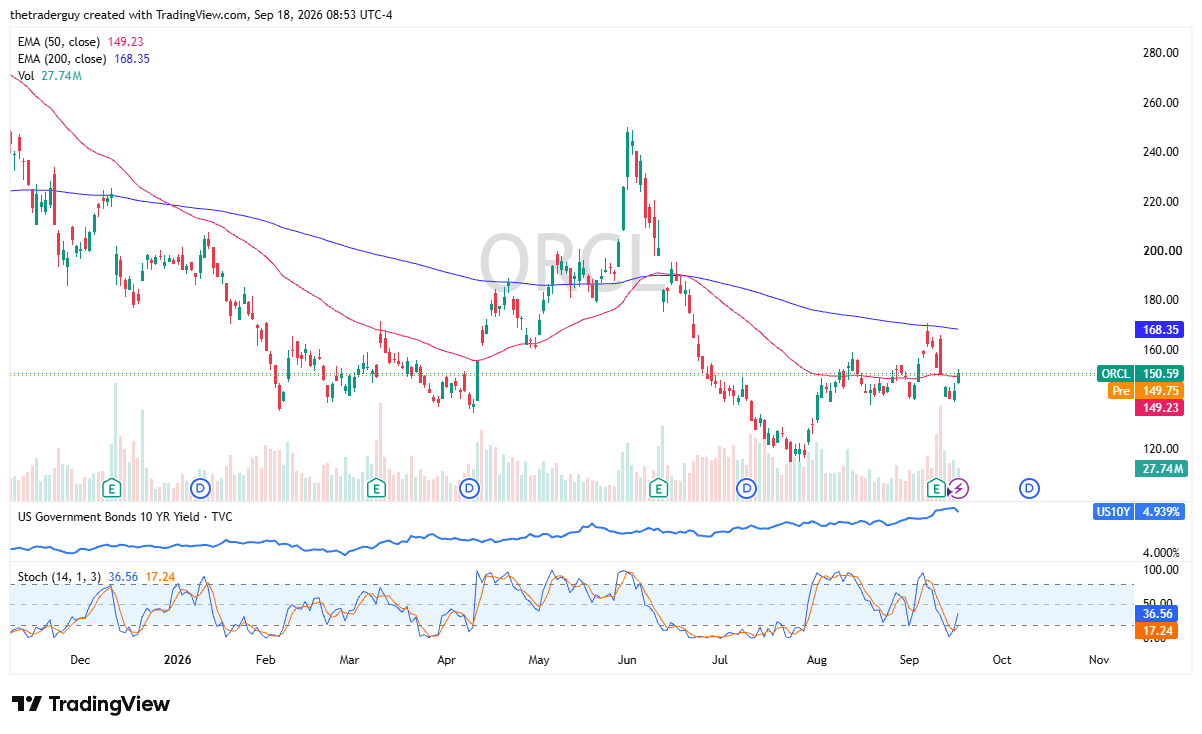
Oracle looks like it’s going to be just a bit negative at the open, but we’re hanging around the 50-day EMA, which is very flat at the moment. We have been going back and forth for a while, with the $138 level underneath and the $165 level above offering resistance, along with the 200-day EMA. It does look a bit like a basing pattern. We’ll have to see whether or not Oracle can really jump from here. We are in the oversold part of the stochastic oscillator and crossing.
AMD Technical Analysis

AMD looks like it might be slightly positive as we get moving here on Friday. We’ll just have to wait and see. There is a bit of a barrier here right at about $190. Clearing that would be extraordinarily bullish. It would be a breakout of a bullish flag. Right now, it looks like the $150 level is a bit of a floor. It’s basically the bottom of the flag. So, still bullish, but we’ll have a little bit of work to do to continue to the upside.
If you’d like to know more about technical analysis and how traders use it, please visit our educational area.


