NASDAQ 100 Technical Analysis
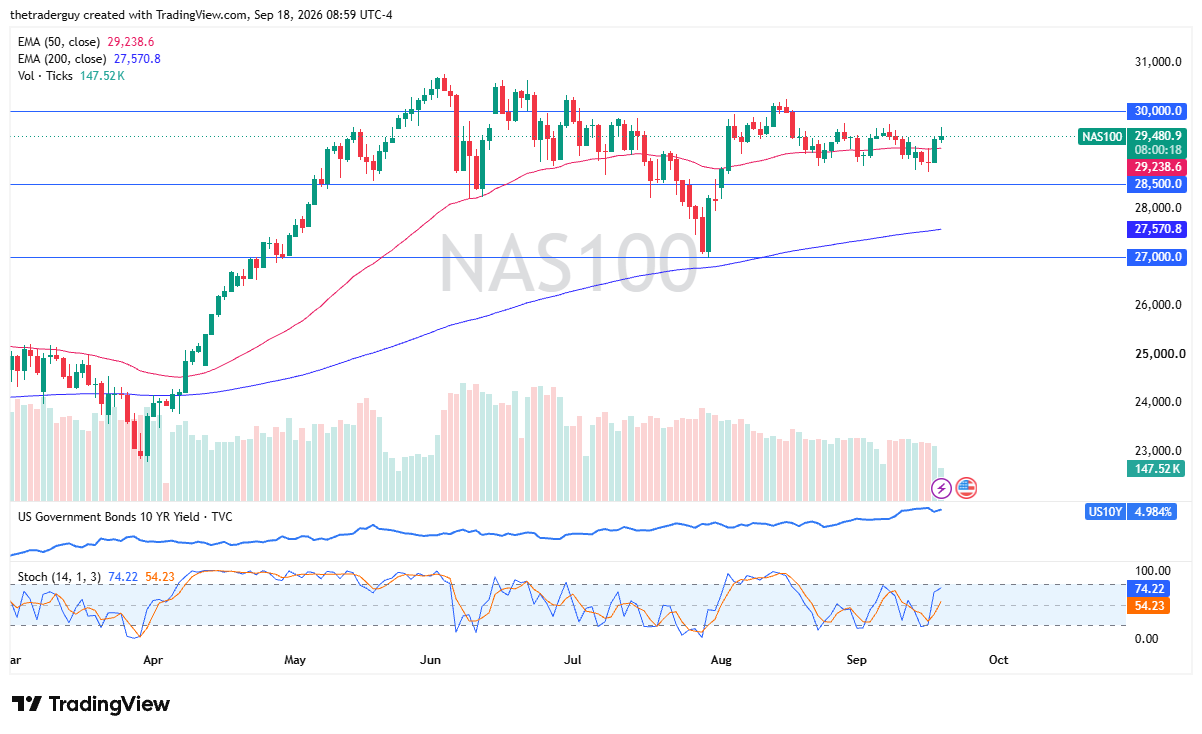
The Nasdaq 100 tried to rally a bit during the early part of the session on Friday, but we have seen the market turn back around as it looks like it is trying to stay in the same range it has been in for weeks. The 29,600 level seems to be a bit difficult to break above. The 29,000 area is somewhat supported, so with that and the 50-day EMA being flat, I do not know that much has changed.
Despite the fact that we have had 3 central banks this week, that is actually a very bullish sign.

Dow Jones 30 Technical Analysis
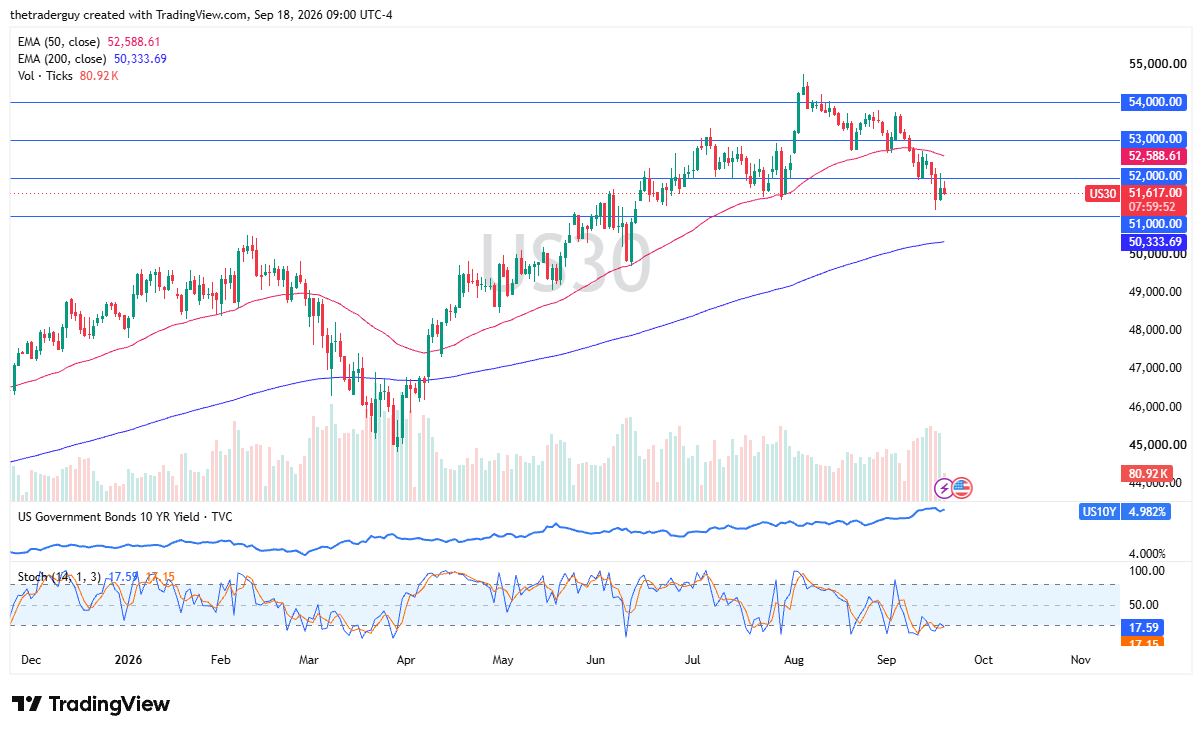
The Dow Jones 30 tried to rally initially, but it continues to find trouble at the 52,000 level. Pulling back from there suggests that we are still going to struggle a bit. With elevated oil prices, that is not a huge surprise in this index. The 51,000 level underneath continues to offer a potential support level. I think really what we need to see here to get overly bullish is a sustained move above 52,000, maybe even a daily close.
S&P 500 Technical Analysis
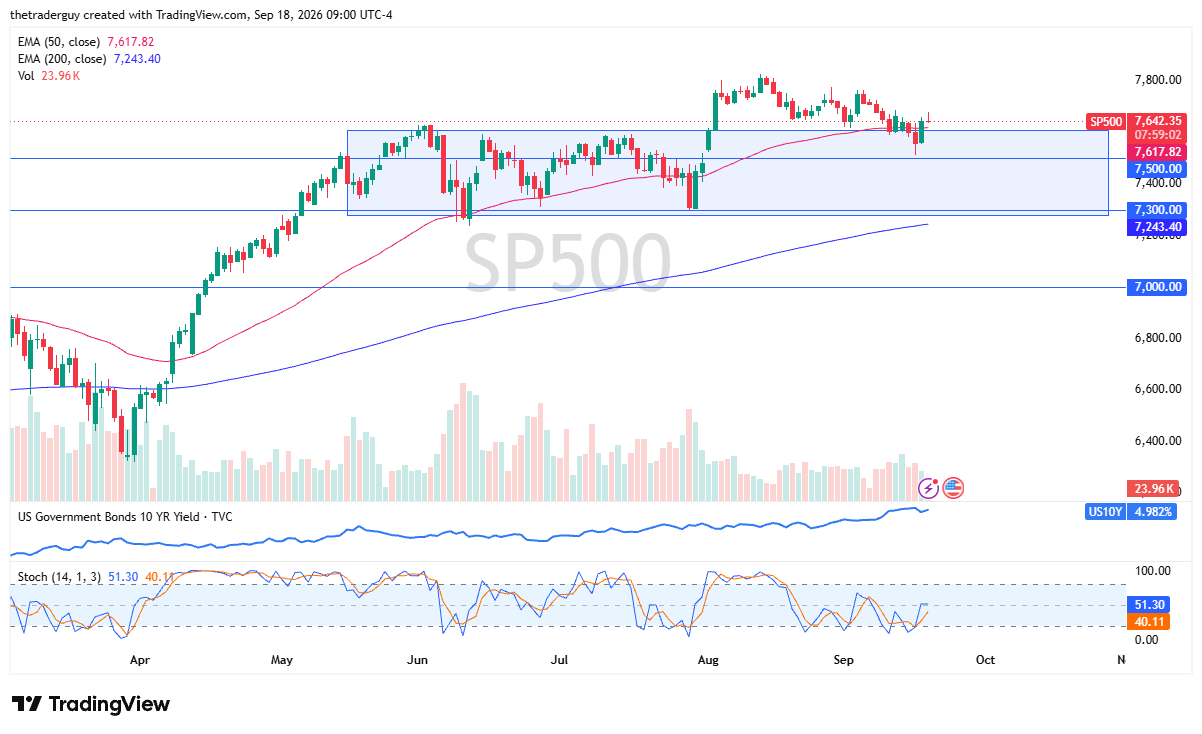
The S&P 500 initially rallied during the early part of the Friday session, but has given back those gains to show signs of exhaustion. We continue to dance around the 7,600 level. What would be particularly interesting for me is how this market behaves after the Europeans leave and it is just American traders.
The interest rate situation in the United States continues to be rather elevated. That does work against stocks, but the fact that we are basically where we have been for the most part of 2 weeks is a bullish sign.
If you’d like to know more about technical analysis and how traders use it, please visit our educational area.