



Storage Beat the Estimate but the Weather Won
The EIA gave natural gas bulls the number they wanted Thursday and the weather took it back Friday morning. The 44 bcf injection came in below the 48 bcf estimate and well under the five-year average build of 74 bcf. The contract settled higher. By Friday the bid was gone. Commodity Weather Group shifted the forecast cooler across the South and Southeast between September 22 and October 1 and that was worth more to sellers than one lean storage print was worth to buyers.
At 10:45 GMT, October natural gas futures are trading $2.848, down $0.053 or 1.83%.

Daily October Natural Gas Futures Technical Analysis

October natural gas futures are edging lower on Friday, erasing Thursday’s small $0.010 gain and taking out Thursday’s low at $2.859.
The main trend is down according to the daily swing chart. A new lower main top has formed at $2.978. A trade through this level will change the main trend to up. Taking out $2.753 will signal a resumption of the downtrend.
Natural gas is trading just below the 50-day moving average at $2.849. Holding on the weak side of this indicator will reaffirm the strength of the swing-chart downtrend.
On the upside, a minor retracement zone at $2.890 to $2.922 is resistance. On the downside, the next retracement zone target is $2.847 to $2.805.
Natural Gas Price Forecast
Every new Natural Gas analysis as it publishes, today's technical signal and key levels, live price — on one page.
See all Natural Gas forecastsThe Forecast Killed Thursday’s Rally Before Friday’s Open
The cooler outlook did exactly what production alone could not do all week. It gave sellers a reason to press the market lower even after a bullish storage number. Gas-fired power burn was the demand story keeping this market off its lows for two weeks. A narrower heat footprint heading into October takes that story away right when the bulls needed another week of it.
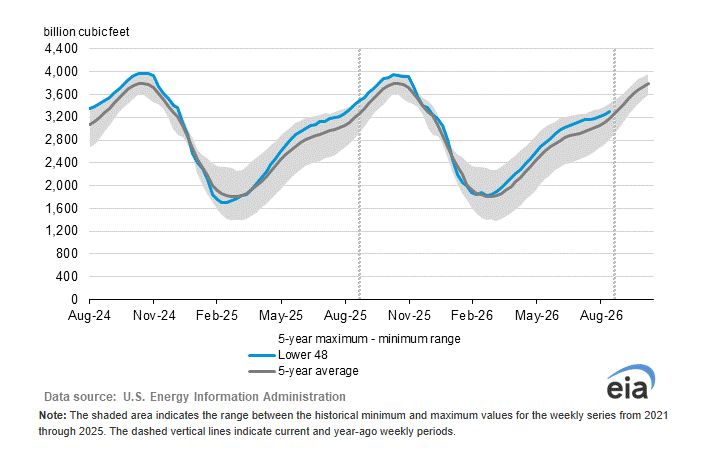
Inventories are down 3.9% from a year ago but still 3.7% above the five-year seasonal average. That is not a deficit the bulls can trade. It is a surplus that was shrinking as long as the South stayed hot. Friday’s forecast says the shrinking may be over before it mattered enough to change the conversation.
Production Is Not Giving the Bulls Anything to Work With
Lower-48 dry gas output hit 113.2 bcf per day Thursday, up 5.0% from a year ago according to BNEF. Baker Hughes added two rigs last week bringing the count to 132, just below February’s three-year high of 134. The EIA projects inventories reaching 3,985 bcf by the end of October, the highest in a decade. The agency also raised its 2027 production forecast to 116.0 bcf per day.
Producers at $2.85 are not slowing down. They are adding rigs. A single below-normal storage build does not change that math and the projection for record October inventories is sitting over every attempt to rally. The bulls needed a string of lean builds to shift the argument. They got one and the weather pulled the rug before the next one could arrive.
LNG Pull Softened the Same Week the Heat Faded
Estimated net flows to U.S. LNG export terminals came in at 18.7 bcf per day Thursday, down 4.1% from the prior week. That timing made the cooler forecast hit harder. The domestic demand story was already losing its strongest support and now the export pull is easing at the same time.
Lower-48 electricity output was still running 16.1% above a year earlier at 94,427 GWh in the week ended September 12. Power demand is the one pillar that stayed consistent all month. But it cannot carry the balance sheet alone with exports fading and the forecast cooling. The rally needed both pillars standing and one of them cracked Friday morning.
Europe Pulled Back but the Winter Problem Has Not Been Solved
European gas surged to a 3.75-year high Monday and pulled back by Friday after a labor strike ended at France’s Dunkirk LNG terminal. Dutch TTF and British NBP are on track to snap five-week winning streaks. The immediate squeeze eased.
European storage was about 69% full as of September 15 against an 85% average. The Strait of Hormuz is still restricting LNG tanker traffic. One headline from the Strait or another terminal disruption and the European bid comes right back. That floor underneath U.S. gas has not been removed. It got a week of relief from Dunkirk and the market treated it as a reason to sell the overseas premium. Whether that selling lasts depends on how long the current supply improvement holds with winter approaching and storage still 16 points below normal.
What to Watch
The weather models next week determine whether sellers can extend Friday’s decline or whether buyers get one more shot at the $2.978 level before October expiration compresses the timeframe. LNG flows above 19 bcf per day would put the export demand back into the balance sheet at a time when the domestic side is losing support. Europe at 69% storage with Hormuz still impaired is the variable that can override everything else on a single headline.
The bias leans bearish with the main trend down on the daily swing chart and a new lower main top at $2.978 reinforcing the resistance. The 50-day moving average at $2.849 has been the pivot all week and October gas slipped below it Friday. That is where the bearish case gets stronger. The retracement zone at $2.847 to $2.805 is the last support before $2.753. If that zone breaks, the downtrend resumes and the storage beat was a one-day event.
On the upside, recapturing the 50-day and pushing through $2.922 weakens the bearish case and puts $2.978 back in play. That level has stopped every rally this month. The trend does not change to up until it breaks.
More Information in our Economic Calendar.


