Bullish Breakout Confirms Reversal
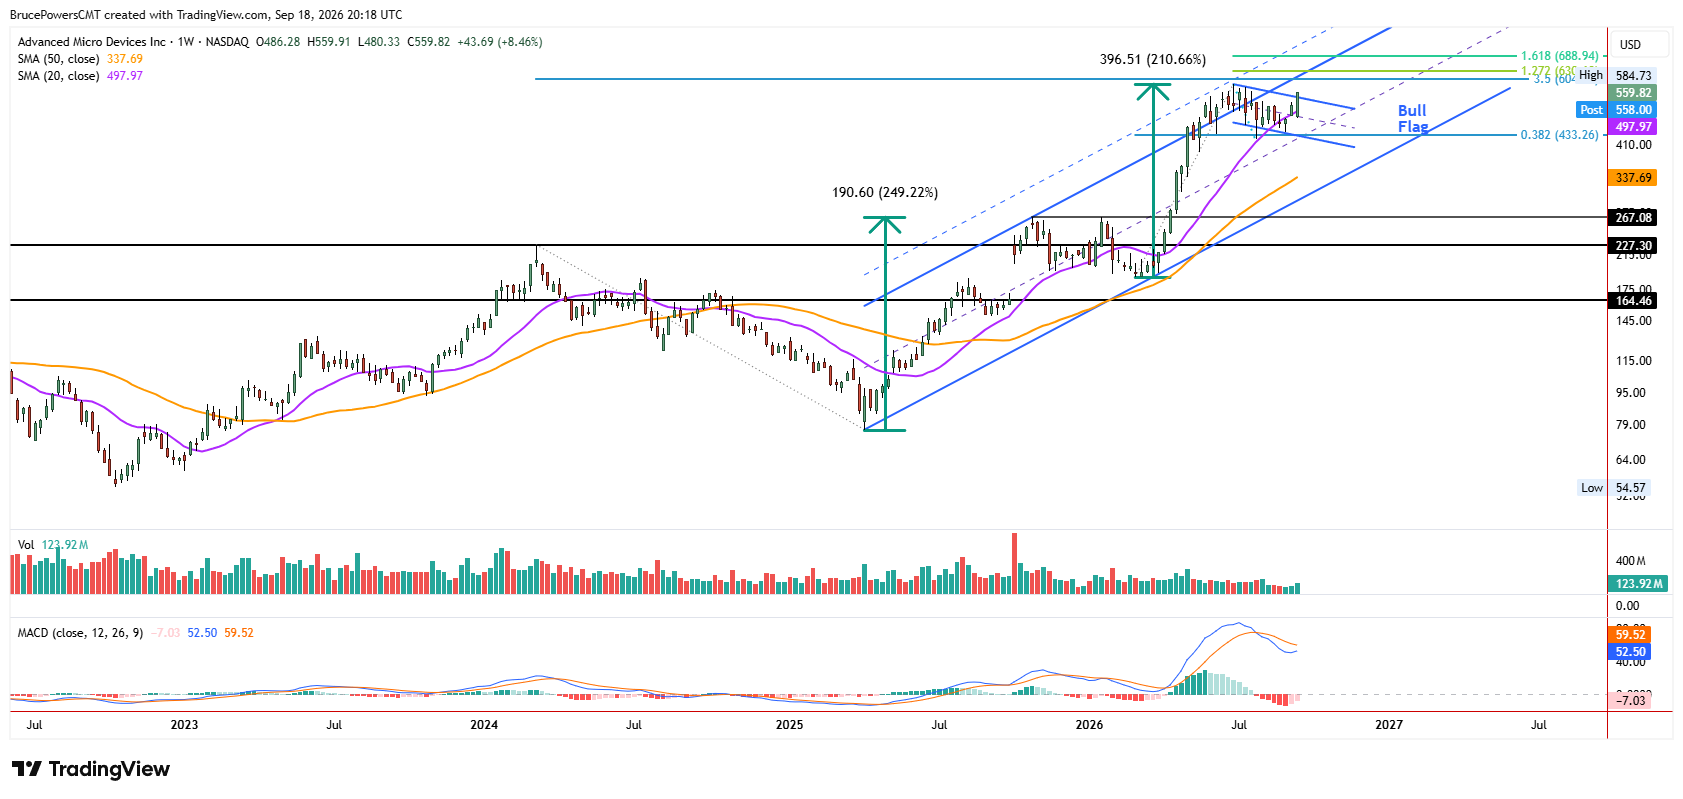
Advanced Micro Devices, Inc. (AMD) ended the week at $559.62, a 10-week closing high, while establishing a bullish engulfing candlestick pattern. Although the week’s low of $480.44 was briefly below the 20-week moving average near $497, signaling a temporary failure of support, buyers quickly reclaimed the level and drove a further advance.
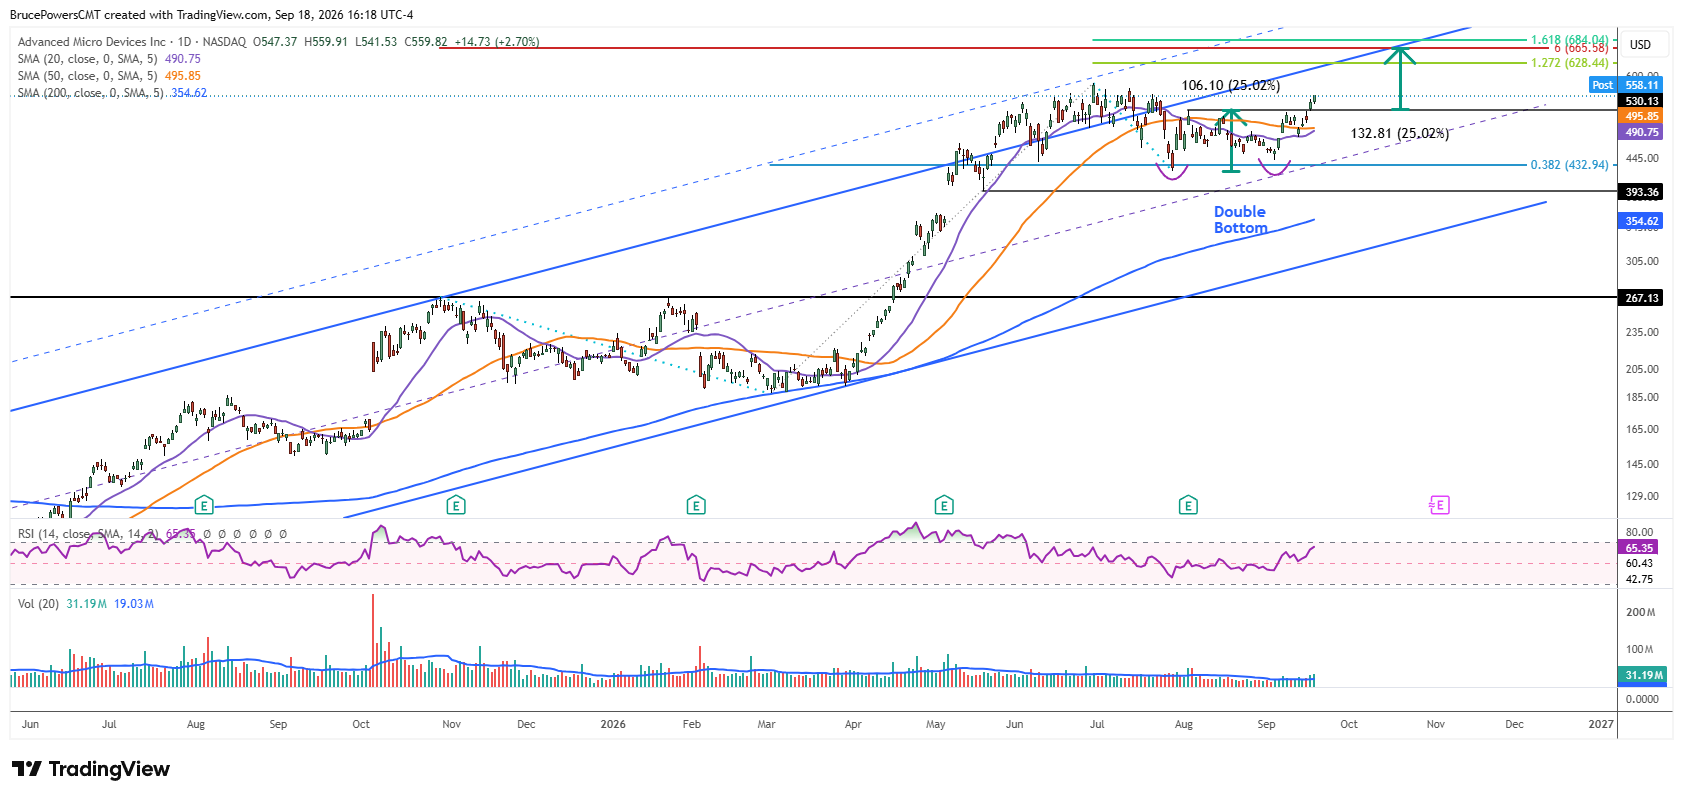
A low of $480.33 on Monday was followed by an advance that triggered an upside breakout of an eight-week bottom consolidation range in the form of a bullish double- bottom with resistance at $530.13. Thursday’s close above $530.13 confirmed the breakout and bullish reversal signal. On the daily chart, AMD also reclaimed both the 20-day and 50-day moving averages during the advance on the way to the week’s high of $559.91, providing additional confirmation of strengthening momentum.

Higher Low Builds Double-Bottom Structure
The recent bearish correction from a peak of $584.73 in June was relatively mild, completing only a 38.2% Fibonacci retracement of the prior advance at $432.94 before buyers eventually regained control. A low of $424.03 in July established the first bottom, followed by a second bottom at $440.50. the higher second low helped form the bullish double-bottom structure that has now broken higher.
Renewed Momentum Opens Higher Targets
This week’s bullish price action indicates a continuation of the larger bullish trend begun from the 2025 low. The breakout therefore opens the possibility of a move back toward the June high and potentially beyond it toward higher price targets. Investors will be watching pullbacks carefully for signs of renewed demand that could support a continuation of the advance.
Key Support Defines Bullish Structure
The bullish outlook is maintained if AMD holds above key support levels. This week’s higher swing low at $480.33 is key structural support, while the 50-day moving average at $495.56 and the 20-day moving average near $490 provide potential dynamic support. The week’s low successfully tested support at the 20-day moving average shortly after it was reclaimed, and the 20-day moving average is about to cross above the 50-day moving average, providing another sign of improving momentum. Holding these support levels would help maintain the bullish structure established by this week’s breakout.
Double-Bottom Projection Points Toward $659
Potential new high targets include the measuring objective from the double bottom near $659. The 127.2% Fibonacci extension of the recent bearish correction provides an intermediate target near $628.50, while the 161.8% Fibonacci extension near $684 reinforces the higher target zone. Together, these projections provide potential upside objectives if the bullish reversal continues and AMD eventually challenges the June high of $584.73.